

The DOI matches its Crossref record; 53 of the 53 references it cites were found in a registry or an index.
Soil carbon sequestration accelerated by restoration of grassland biodiversity
Open accessAbstract
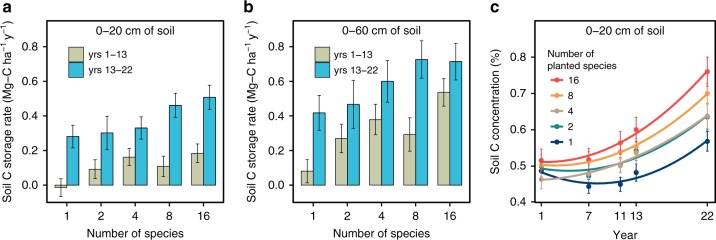
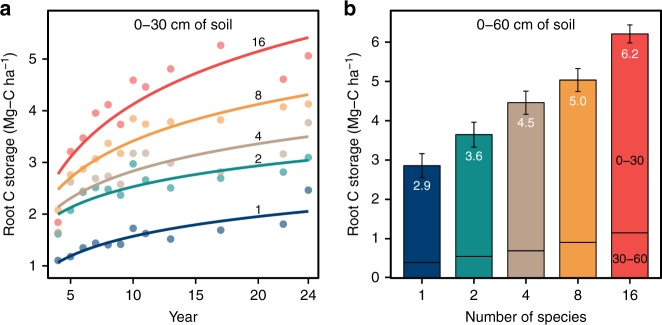
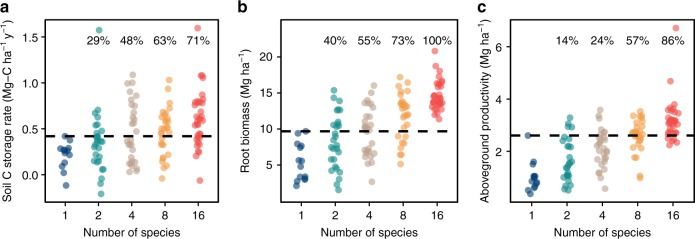
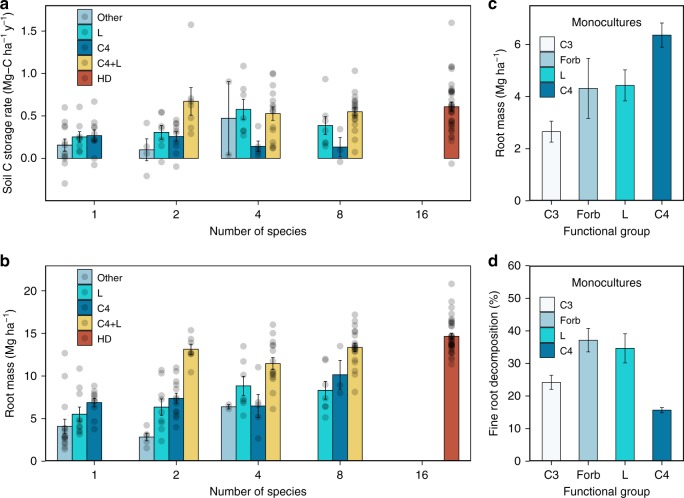
Agriculturally degraded and abandoned lands can remove atmospheric CO 2 and sequester it as soil organic matter during natural succession. However, this process may be slow, requiring a century or longer to re-attain pre-agricultural soil carbon levels. Here, we find that restoration of late-successional grassland plant diversity leads to accelerating annual carbon storage rates that, by the second period (years 13–22), are 200% greater in our highest diversity treatment than during succession at this site, and 70% greater than in monocultures. The higher soil carbon storage rates of the second period (years 13–22) are associated with the greater aboveground production and root biomass of this period, and with the presence of multiple species, especially C4 grasses and legumes. Our results suggest that restoration of high plant diversity may greatly increase carbon capture and storage rates on degraded and abandoned agricultural lands.
Overview
The claims and statistics of this paper haven’t been checked yet.
Run the check — free, no account needed. It reads the open-access text and checks the sources it cites.
Integrity signals
Registry
Cites
Statistics
Figures
Verification
Claims the paper makes
The claims and statistics of this paper haven’t been checked yet.
Run the check — free, no account needed. It reads the open-access text and checks the sources it cites.
Claims other papers make about this one
Each is checked against this paper’s own text: does it say what the citing paper says it does?
The source backs part of the claim, not all of it — or backs it for a different population, condition or comparison.
In the citing paper
“However, globally grass and cropland soils are highly degraded and thus have a long-term sequestration potential (Cotrufo et al., 2019;Yang et al., 2019;Lavallee et al., 2020).”
From Ecosystem Impacts and Productive Capacity of a Multi-Species Pastured Livestock System (2020) · cites this paper as Yang et al., 2019
Experimental — accuracy not yet measuredThe cited source says what the claim attributes to it.
In the citing paper
“On the other hand, rates of carbon uptake and storage in the biomass and soils can be substantially accelerated; for example, by enhancing species diversity and the presence of late successional species at the onset of restoration 63 .”
From Global priority areas for ecosystem restoration (2020) · cites this paper as [63]
Self-check
Percentages, sums and reported differences re-computed from the paper’s own numbers.
The self-check needs the paper’s full text.
Citations
Cites
Soil Carbon Sequestration Impacts on Global Climate Change and Food Security
Lal, R. (2004) · Science · doi:10.1126/science.1097396 · Cited by 8,376
Jost, L. (2006) · Oikos · doi:10.1111/j.2006.0030-1299.14714.x · Cited by 4,669
Soil carbon sequestration to mitigate climate change
Lal, R. (2004) · Geoderma · doi:10.1016/j.geoderma.2004.01.032 · Cited by 3,936
The Influence of Functional Diversity and Composition on Ecosystem Processes
Tilman, D. G., Knops, J. M. H., Wedin, D. A., Reich, P. B., Ritchie, M. E., & Siemann, E. (1997) · Science · doi:10.1126/science.277.5330.1300 · Cited by 3,298
Self-citationSoil carbon sequestration and land‐use change: processes and potential
Post, W. M., & Kwon, K. C. (2000) · Global Change Biology · doi:10.1046/j.1365-2486.2000.00308.x · Cited by 2,602
Biodiversity and ecosystem stability in a decade-long grassland experiment
Tilman, D. G., Reich, P. B., & Knops, J. M. H. (2006) · Nature · doi:10.1038/nature04742 · Cited by 2,409
Self-citationDiversity and Productivity in a Long-Term Grassland Experiment
Tilman, D., Reich, P. B., Knops, J., Wedin, D., Mielke, T., & Lehman, C. (2001) · Science · doi:10.1126/science.1060391 · Cited by 2,373
Self-citationMinasny, B., Malone, B. P., McBratney, A. B., Angers, D. A., Arrouays, D., Chambers, A., Chaplot, V., Chen, Z.-S., Cheng, K., Das, B. S., et al. (2017) · Geoderma · doi:10.1016/j.geoderma.2017.01.002 · Cited by 2,239
PARTITIONING DIVERSITY INTO INDEPENDENT ALPHA AND BETA COMPONENTS
Jost, L. (2007) · Ecology · doi:10.1890/06-1736.1 · Cited by 2,230
Carbon-Negative Biofuels from Low-Input High-Diversity Grassland Biomass
Tilman, D., Hill, J., & Lehman, C. (2006) · Science · doi:10.1126/science.1133306 · Cited by 1,813
Self-citation
Cited by
Sorted by citations
Items 401–500 of 557
Bang, J. H., An, N.-H., Lee, Y., Park, J.-H., Kong, M., & Hong, S.-J. (2025) · Plants · doi:10.3390/plants14020177 · Cited by 2
Li, C., Li, X., Li, X., Chai, Y., Gao, P., Yang, Y., & Zhang, J. (2025) · Plant and Soil · doi:10.1007/s11104-025-07209-9 · Cited by 2
Self-citationOkpara, O. P., & Okogwu, O. I. (2025) · Journal of Applied Life Sciences and Environment · doi:10.46909/alse-574158 · Cited by 2
Lv, W., Jianping, S., Li, B., Zhou, Y., Luo, C., Zhang, Z., Lv, J., Chen, L., Wang, Y., He, J.-S., et al. (2025) · Journal of Plant Ecology · doi:10.1093/jpe/rtaf031 · Cited by 2
Deng, X., Shen, J., Lei, Y., Sheng, M., Xue, J., & Sun, G. (2025) · CATENA · doi:10.1016/j.catena.2025.109207 · Cited by 4
Makovníková, J., Kološta, S., Pálka, B., & Flaška, F. (2025) · Soil Security · doi:10.1016/j.soisec.2025.100207 · Cited by 2
Szentes, S., Járdi, I., Sípos, L., Penksza, K., Kende, Z., Saláta-Falusi, E., Szabó-Szöllősi, T., Kevi, A., Balogh, D. Á., Bajnok, M., et al. (2025) · Earth · doi:10.3390/earth6040119 · Cited by 2
Diverse Perennial Vegetation is Missing!
Crews, T. E. (2021) · Springer eBooks · doi:10.1007/978-3-030-72224-1_10 · Cited by 2
Fang, Z., Ke, Z., & Jiao, F. (2021) · Land Degradation and Development · doi:10.1002/ldr.4103 · Cited by 1
Opportunities for carbon sequestration in intensive soft fruit production systems
Lukáč, M. (2022) · Acta horticulturae et regiotecturae · doi:10.2478/ahr-2022-0014 · Cited by 2
Strategies for Restoring Soil Health in Indian Himalayan Region
Das, A., Sangma, C. B. K., Chakraborty, M., Saha, S., Kumar, A., Das, B., Layek, J., Babu, S., & Pandey, P. (2025) · ASSA, CSSA and SSSA · doi:10.1002/9780891187400.ch9 · Cited by 3
Lv, C., Saba, T., Wang, J., Hui, W., & Gong, W. (2023) · Plant and Soil · doi:10.1007/s11104-023-06268-0 · Cited by 1
Honkanen, H., Nuutinen, V., Heikkinen, J., Lemola, R., Turtola, E., Kaseva, J., & Lång, K. (2024) · Geoderma Regional · doi:10.1016/j.geodrs.2024.e00818 · Cited by 1
Wildfire-enhanced Plio-Pleistocene CO2 drawdown through terrestrial organic carbon burial
Sakthivel, T., Ghosh, P., Nair, N., & Da, J. (2024) · Quaternary Science Reviews · doi:10.1016/j.quascirev.2024.108825 · Cited by 1
Smith, M. J., Schlatter, D., Pombubpa, N., Castle, S. C., Grandy, A. S., Borer, E. T., Seabloom, E. W., & Kinkel, L. L. (2024) · Frontiers in Microbiology · doi:10.3389/fmicb.2024.1452534 · Cited by 1
Effects of restorative treatments confirmed in a restored pond
Lee, C. S., Kim, D. U., Lim, B. S., Kim, G. S., & Seok, J. E. (2024) · Ecological Engineering · doi:10.1016/j.ecoleng.2024.107430 · Cited by 1
Ecological Risk Assessment of Land-Use in Hainan Prefecture, China, Based on Landscape Pattern
Yang, Q., Tang, H., & Yang, C. (2025) · Polish Journal of Environmental Studies · doi:10.15244/pjoes/200212 · Cited by 1
Guo, T. (2025) · Grasses · doi:10.3390/grasses4010010 · Cited by 1
Shilpakar, C., Yang, D., Holbrook, D. L., Norton, U., & Islam, M. A. (2025) · Land Degradation and Development · doi:10.1002/ldr.5647 · Cited by 1
Huang, C., Tian, Y., Wang, J., Peng, D., Shen, Z., Chu, C., & Ma, Z. (2025) · Forest Ecology and Management · doi:10.1016/j.foreco.2025.123007 · Cited by 1
Chen, S., Hua, J., Liu, W., Yang, S., & Ji, W. (2025) · Plants · doi:10.3390/plants14152331 · Cited by 1
Spatial predictions of potentially undisturbed grassland across the conterminous US
Barnes, K. W., Niemuth, N. D., Vest, J. L., Fields, S. P., Estey, M. E., & Iovanna, R. (2025) · Landscape Ecology · doi:10.1007/s10980-025-02187-w · Cited by 1
An, Y., Gao, Y., Liu, J., Zhang, Y., Wang, D., Ma, H., & Tong, S. (2025) · Journal of Plant Ecology · doi:10.1093/jpe/rtaf131 · Cited by 2
Outlook on the knowledge gaps to conserve and increase soil organic carbon stocks
Almås, Å. R., Eich‐Greatorex, S., Sogn, T. A., MULDER, J. P. M., Pandey, M., Dauby, V., Powlson, D. S., Farina, R., Watté, J., Rasse, D. P., et al. (2025) · Soils for Europe. · doi:10.3897/soils4europe.e149027 · Cited by 1
Stan, K., Watt, G. A., & Sánchez-Azofeifa, A. G. (2025) · Land Use Policy · doi:10.1016/j.landusepol.2025.107890 · Cited by 1
Wang, M., Masoudi, A., Wang, C., Wu, C., Yu, Z., & Liu, J. (2026) · Journal of Hazardous Materials · doi:10.1016/j.jhazmat.2026.141092 · Cited by 1
Yin, Z., Sun, X., Tijiu, 蔡. C., & Sun, X. (2026) · Soil Biology and Biochemistry · doi:10.1016/j.soilbio.2026.110086 · Cited by 1
Zang, Z., Li, Y., Tang, F., Deng, S., Yang, K. Q., Li, J., Lv, Y., & Zhao, W. (2026) · Agriculture Ecosystems & Environment · doi:10.1016/j.agee.2026.110241 · Cited by 1
Economic and environmental evaluation and adoption of forage rejuvenation in Canada
Sydora, M. J., Huang, H., Mengistu, G. F., & Grant, B. (2026) · Canadian Journal of Animal Science · doi:10.1139/cjas-2025-0067 · Cited by 1
Above-ground consumers, soil biota, and ecosystem function
Bardgett, R. D. (2025) · Oxford University Press eBooks · doi:10.1093/9780191858710.003.0005 · Cited by 1
Trouw, V. J., Hyvärinen, O., Findlay, N. J., Hawkins, H., Heister, K., Schenkeveld, W. D. C., Cromsigt, J. P. G. M., Kerley, G. I. H., & Beest, M. T. (2026) · Plant and Soil · doi:10.1007/s11104-026-08692-4 · Cited by 1
Climate-smart intercropping for sustainable agriculture
Khan, A., Zheng, J., Nepal, J., Wang, W., Short, A. W., Tan, D. K. Y., Wang, H., Xiong, Y., & Liu, P. (2026) · Environmental Technology & Innovation · doi:10.1016/j.eti.2026.105098 · Cited by 1
Ticllacondor, E. R., & Talaverano, N. S. Z. (2020) · The Biologist · doi:10.24039/rtb2019172351 · Cited by 1
Methods to increase native warm‐season grass diversity in bermudagrass
Rogers, J. K., & Robertson, S. G. (2021) · Crop Forage & Turfgrass Management · doi:10.1002/cft2.20109 · Cited by 1
Cuaichar, D. A. M., Muñoz, A. S. M., Benavides, I. F., Estrada, J. F. N., & Guerrero, J. H. M. (2021) · Forest Systems · doi:10.5424/fs/2021302-17408 · Cited by 1
The assay of soil carbon with naturally occurring cosmic ray neutrons
McTaggart, R. (2023) · Journal of Environmental Radioactivity · doi:10.1016/j.jenvrad.2023.107202 · Cited by 1
Agronomical management of detention basin
Pescatore, A., Vergari, D., Orlandini, S., & Napoli, M. (2023) · Italian Journal of Agrometeorology · doi:10.36253/ijam-2239 · Cited by 1
Das, T. K., Nath, C. P., Bhattacharyya, R., Bandyopadhyay, K., Sudhishri, S., Bhatia, A., Raj, R., Singh, P., Rathi, N., Singh, B., et al. (2024) · International Journal of Plant Production · doi:10.1007/s42106-024-00318-y · Cited by 1
Basic and Traditional Microbial Techniques in Ecosystem Restoration
Prasath, R. V. A., Akila, S., Shankar, M., Raveena, R., Prasanthrajan, M., Boomiraj, K., Karthika, S., & Keerthana, S. (2024) · BENTHAM SCIENCE PUBLISHERS eBooks · doi:10.2174/9789815256598124010012 · Cited by 1
Shi, H., Xia, F., Ran, L., Wu, H., Wang, J., Xue, Y., Wei, W., Zheng, S.-K., Yan, S., Yang, C., et al. (2025) · CATENA · doi:10.1016/j.catena.2025.109287 · Cited by 1
New Approaches in Social, Environmental Management and Policy to Address SDGs
Martínez, M., & Martínez, M. P. L. (2022) · MDPI eBooks · doi:10.3390/books978-3-0365-2950-9 · Cited by 1
Chapter 6 : Land Cover and Land-Use Change. Fifth National Climate Assessment
THORNTON, P. E., Reed, B. C., Xian, G., Chini, L. P., East, A. E., Field, J. L., Hoover, C. M., Poulter, B., Reed, S. C., Wang, G., et al. (2023) · doi:10.7930/nca5.2023.ch6 · Cited by 3
From challenges to opportunities in abandoned farmlands
Fayet, C. M. J. (2023) · doi:10.5463/thesis.355 · Cited by 1
Evaluating Biodiversity Credit Metrics Using Metacommunity ModellingPreprint
Maczik, D., Jansen, V. A. A., & Rossberg, A. G. (2024) · bioRxiv (Cold Spring Harbor Laboratory) · doi:10.1101/2024.06.03.597228 · Cited by 1
Long-Term Contrasting Land Uses Influence Soil Pore Structure and Organic CarbonPreprint
Dor, M., Fan, L., Zamanian, K., & Kravchenko, A. (2024) · SSRN Electronic Journal · doi:10.2139/ssrn.4859802 · Cited by 1
Deng, X., Shen, J., Lei, Y., Sheng, M., Xue, J., & Sun, G. (2025) · SSRN Electronic Journal · doi:10.2139/ssrn.5171295 · Cited by 1
Soil Aggregates and Their Mediation of Agroecosystem Carbon and Nitrogen Cycling Processes
King, A. E. (2020) · The Atrium (University of Guelph)
Carbon sequestration and weedy invasion in CRP fields
Magee, D. (2020) · UNI ScholarWorks (University of Northern Iowa)
Soil and Grassland Effects on Grassland Net Photosynthesis in Gannan, China, from 2000 to 2018Preprint
Nazieh, S., & Zhang, M. (2021) · Preprints.org · doi:10.20944/preprints202104.0365.v1
Herbivores and pathogens mediate grassland responses to global changes
Kohli, M. (2020) · University of Minnesota Digital Conservancy (University of Minnesota)
Scott, D. A., Eckhoff, K. D., Lorenz, N., Dick, R. P., & Swab, R. M. (2021) · Land · doi:10.3390/land10101091
Consumption of spare parts in repairs of milking machines.
Juricek, J., & Karaś, A. (1990)
Demir, M., Green, I., & Ginige, T. (2021) · Gdańskie Studia Prawnicze · doi:10.26881/gsp.2021.3.08
Turismo, D. D. G. E., Duarte, P., Figueiredo, A., & Nunes, A. (2020) · GOT - Geography and Spatial Planning Journal · doi:10.17127/got/2020.20.012
Subedi, P., Inglett, P. W., Sandhu, S. S., Rai, D., Silveira, M. L., Gerber, S., & Inglett, K. S. (2022) · SSRN Electronic Journal · doi:10.2139/ssrn.4129731
Indicadores de serviços ecossistêmicos em sistemas silvipastoris
Obolari, A. D. M. M. (2021) · doi:10.47328/ufvbbt.2022.091
Solascasas, P., Hevia, V., Ochoa‐Hueso, R., & Azcárate, F. M. (2023) · SSRN Electronic Journal · doi:10.2139/ssrn.4481979
Wirth, S. B. (2023) · Biogeosciences · doi:10.5194/bg-2023-55-ac2
Benefits of CO2 fertilization on global grassland nitrogen cyclesPreprint
Gu, B., Zheng, M., Cui, J., Wang, X., Zhang, X., Reis, S., Lam, S. K., Wang, S., & Xu, J. M. (2023) · Research Square · doi:10.21203/rs.3.rs-3227315/v1
(2023) · Biogeosciences · doi:10.5194/bg-2023-107-rc2
White, M. A. (2023) · Elsevier eBooks · doi:10.1016/b978-0-12-822562-2.00360-1
Zhou, G., Lei, Z. K., Jarvie, S., Peng, Y., Zang, L., Chen, D., Zhang, G., Sui, M., He, Y., Liu, Q., et al. (2023) · SSRN Electronic Journal · doi:10.2139/ssrn.4635581
Carbon Capture via Ocean and Soil Separation
Wang, C. (2024) · Elsevier eBooks · doi:10.1016/b978-0-323-93940-9.00179-1
Ali, M. R., Rahman, J., Hossain, M. M., Wadud, M. A., Fahim, A. H. F., & Nahar, M. S. (2023) · Food and Agri Economics Review · doi:10.26480/faer.01.2023.19.21
Novel Method for Carbon Monoxide and Carbon Dioxide Simulation in the TunnelsPreprint
Shishegaran, A. (2024) · SSRN Electronic Journal · doi:10.2139/ssrn.4786024
Roohollahi, N., Javadi, S. A., Jafari, M., & Chahouki, M. A. Z. (2024) · Modeling Earth Systems and Environment · doi:10.1007/s40808-024-01980-x
ENVIRONMENTAL AND ECONOMIC ASSESSMENT OF COMPOST BARN SYSTEM IN MILK PRODUCTION IN BRAZIL
Basaia, D. C. K., Morais, H. B., Pietramale, R. T. R., Pereira, L., Oliveira, L. E. D. N., & Ruviaro, C. F. (2024) · Revista Contemporânea · doi:10.56083/rcv4n7-193
Breeveld, A. A., Pagella, S., & Fisher, J. (2024) · Academia Environmental Sciences and Sustainability · doi:10.20935/acadenvsci6238
Social economy and intuitional development for grassland management
Li, S., Xu, S., Degen, A. A., Wang, W., & Shang, Z. (2024) · Elsevier eBooks · doi:10.1016/b978-0-443-21882-8.00019-6
Prasad, S., Karthika, S., Sinduja, M., Poornima, R., Dinesh, G. K., & Sathya, V. (2024) · BENTHAM SCIENCE PUBLISHERS eBooks · doi:10.2174/9789815256598124010003
YILMAZ, Ü., & KAVAKLIGİL, S. S. (2024) · EURASIAN JOURNAL OF SOIL SCIENCE (EJSS) · doi:10.18393/ejss.1558316
Sandhage‐Hofmann, A., Lenzen, J., Frindte, K., Angombe, A., & Amelung, W. (2025) · Geoderma · doi:10.1016/j.geoderma.2025.117171
Yuan, X., Jiao, L., Xue, R., Che, X., Wu, J., Li, Q., Wang, X., & Guo, Z. (2025) · Hydrological Sciences Journal · doi:10.1080/02626667.2025.2462699
Genç, Ç. Ö., & Arıcak, B. (2025) · CERNE · doi:10.1590/01047760202531013423
LOOK-OUT TO THE BRAZILIAN CERRADO:
Silva, J., Pereira, T. T. C., & Siqueira, M. V. B. M. (2023) · Brazilian Geographical Journal · doi:10.14393/bgj-v14n2-a2023-72532
Biochar’s influence on plant competition differs under present and future climate conditions
Laungani, R., Elgersma, K. J., & Starman, C. (2025) · Soil Advances · doi:10.1016/j.soilad.2025.100041
Wall, A. M., Barton, P. S., & Schultz, N. L. (2025) · Journal of Insect Conservation · doi:10.1007/s10841-025-00668-6
Bhuyan, S. (2025) · Elsevier eBooks · doi:10.1016/b978-0-443-31406-3.00002-3
Macedo, L. O. B., da Costa, M. A., de Oliveira, I. L., & Sturza, J. A. I. (2025) · Revista Tocantinense de Geografia · doi:10.70860/rtg.v14i33.19460 · Cited by 1
A Day Trip Through Technology Choices
Schmitt, K. (2025) · IEEE Technology and Society Magazine · doi:10.1109/mts.2025.3560347
Chen, A., Scott, P., Gresshoff, P. M., & Ferguson, B. J. (2025) · bioRxiv (Cold Spring Harbor Laboratory) · doi:10.1101/2025.06.04.657758
Eshel, G. (2025) · The MIT Press eBooks · doi:10.7551/mitpress/13832.001.0001
Kumar, R., Madival, Y., Nagangoudar, M. B., Paramesh, V., Karthik, A. N., Boraiah, B., Jadesha, G., Nagesha, N., & Ranganath, G. (2025) · Environmental and Sustainability Indicators · doi:10.1016/j.indic.2025.100790
From Marshes to Mines: Germination and Establishment of Crinum bulbispermum on Gold Mine Tailings
Clarke, V. C., Claassens, S., Cilliers, D., & SIEBERT, S. J. (2025) · Plants · doi:10.3390/plants14152443
Li, C., Yang, Y., Wang, G., Wang, B., & Ma, J. (2025) · International Soil and Water Conservation Research · doi:10.1016/j.iswcr.2025.09.016
Self-citationKoala, J., Bognounou, F., Savadogo, P., & Sawadogo, L. (2025) · Agroforestry Systems · doi:10.1007/s10457-025-01380-9
Oldbury-Thomas, D., Franklin, A., & Fraser, M. D. (2025) · Landscape Research · doi:10.1080/01426397.2025.2587759
Sebastian, L. T., Laughlin, D. C., Wauters, V. M., & Funk, J. L. (2025) · Restoration Ecology · doi:10.1111/rec.70285
Plant functional traits can guide the regeneration of soil fertility in Kenyan grasslands
Fry, E. L., Owino, Y. O., Nyakundi, B., Lynn, J. S., Hitimana, J., Quinton, J. N., Rufino, M. C., & Bardgett, R. D. (2025) · Plant and Soil · doi:10.1007/s11104-025-08208-6
Tei, M., Soma, F., Barbieri, E., Uga, Y., & Kawahito, Y. (2024) · Figshare · doi:10.6084/m9.figshare.25322851
Restoring grassland legumes using overseeding can depend on seed spatial structure
Houseman, G. R. (2025) · Restoration Ecology · doi:10.1111/rec.70275
Muraina, T. O., Te, N., Jimoh, S. O., Griffin‐Nolan, R. J., Song, L., Chen, J., Shi, Y., Amisu, A. A., Chaudhary, T., Yu, Q., et al. (2026) · Oecologia · doi:10.1007/s00442-025-05858-2 · Cited by 2
Perfil funcional do microbioma da rizosfera do feijão tolerante à seca
da Silva, A. M. J. C. C. G. (2024) · LA Referencia (Red Federada de Repositorios Institucionales de Publicaciones Científicas)
Mia, S., Karunaratne, S. B., Guggenberger, G., Dijkstra, F. A., & Singh, B. (2026) · Soil Research · doi:10.1071/sr25136
Metadata
- Authors
- Yang, Y., Tilman, D., Furey, G., & Lehman, C.
- Affiliations
- University of Minnesota (US)
- Corresponding author
- Tilman, David
- Venue
- Nature Communications
- Published
- 2019-02-12
- Volume
- 10
- Issue
- 1
- Pages
- 718-718
- ISSN
- 2041-1723 (ISSN-L)
- PMC
- PMC6372642
- OpenAlex
- W2911658412
- Cited by
- 557
- References
- 53
- Citations by year
- 2026: 68 · 2025: 111 · 2024: 96 · 2023: 93 · 2022: 65 · 2021: 67 · 2020: 48 · 2019: 8
- FWCI
- 37.42
- Type
- journal article
- Language
- en
- Open access
- gold
- doi.org
- Locations
- Nature Communications (publishedVersion, cc-by)
- Europe PMC (PubMed Central) (publishedVersion, cc-by)
- PubMed Central (publishedVersion, cc-by)
- PubMed (publishedVersion)
- RePEc: Research Papers in Economics (submittedVersion)
- DOAJ (DOAJ: Directory of Open Access Journals) (submittedVersion, cc-by-sa)
- DOAJ (DOAJ: Directory of Open Access Journals) (submittedVersion)
- Funders
- National Science Foundation (1234162, 0620652)
- Topics
- Life Sciences › Agricultural and Biological Sciences › Soil Science › Soil Carbon and Nitrogen Dynamics
- Life Sciences › Agricultural and Biological Sciences › Soil Science › Soil erosion and sediment transport
- Physical Sciences › Environmental Science › Nature and Landscape Conservation › Ecology and Vegetation Dynamics Studies
- Keywords
- soil carbon sequestration, grassland restoration, plant diversity, root biomass, aboveground production, C4 grasses, Fabaceae, degraded agricultural land, monoculture, natural succession
- MeSH terms
- Agriculture, Carbon, Carbon Dioxide, Poaceae, Soil, Biomass, Biodiversity, Carbon Sequestration, Grassland
About these checks
Registry, retraction, Cites and statistics results are computed, not judged, with one exception: a printed reference that no index lists is read once by a model before it counts as a citation error. Claims are extracted by a model and kept only when their quote appears verbatim in the text; each cited source is then checked, with a model’s help, for whether it says what the claim relies on. Those verdicts can be wrong — read the claim’s quote and the cited source before relying on one.
Statistics and arithmetic are recomputed, not judged.
Confidence bands are shown only for fields calibrated on our annotated test set. None is calibrated yet, so no band is shown.
What counts as a claim ›How we measure confidence ›How we check this ›
Are you an author, or do you see a problem with this page? Request a review
