

Precise segmentation of densely interweaving neuron clusters using G-Cut
Open accessThe DOI matches its Crossref record; 33 of the 33 references it cites were found in a registry or an index.
Abstract
Characterizing the precise three-dimensional morphology and anatomical context of neurons is crucial for neuronal cell type classification and circuitry mapping. Recent advances in tissue clearing techniques and microscopy make it possible to obtain image stacks of intact, interweaving neuron clusters in brain tissues. As most current 3D neuronal morphology reconstruction methods are only applicable to single neurons, it remains challenging to reconstruct these clusters digitally. To advance the state of the art beyond these challenges, we propose a fast and robust method named G-Cut that is able to automatically segment individual neurons from an interweaving neuron cluster. Across various densely interconnected neuron clusters, G-Cut achieves significantly higher accuracies than other state-of-the-art algorithms. G-Cut is intended as a robust component in a high throughput informatics pipeline for large-scale brain mapping projects.
Overview
The claims and statistics of this paper haven’t been checked yet.
Free: it reads the open-access text and checks the first 5 claims that cite a source we can check. Create a free account to check every claim.
Integrity signals
Registry
Cites
Statistics
Figures
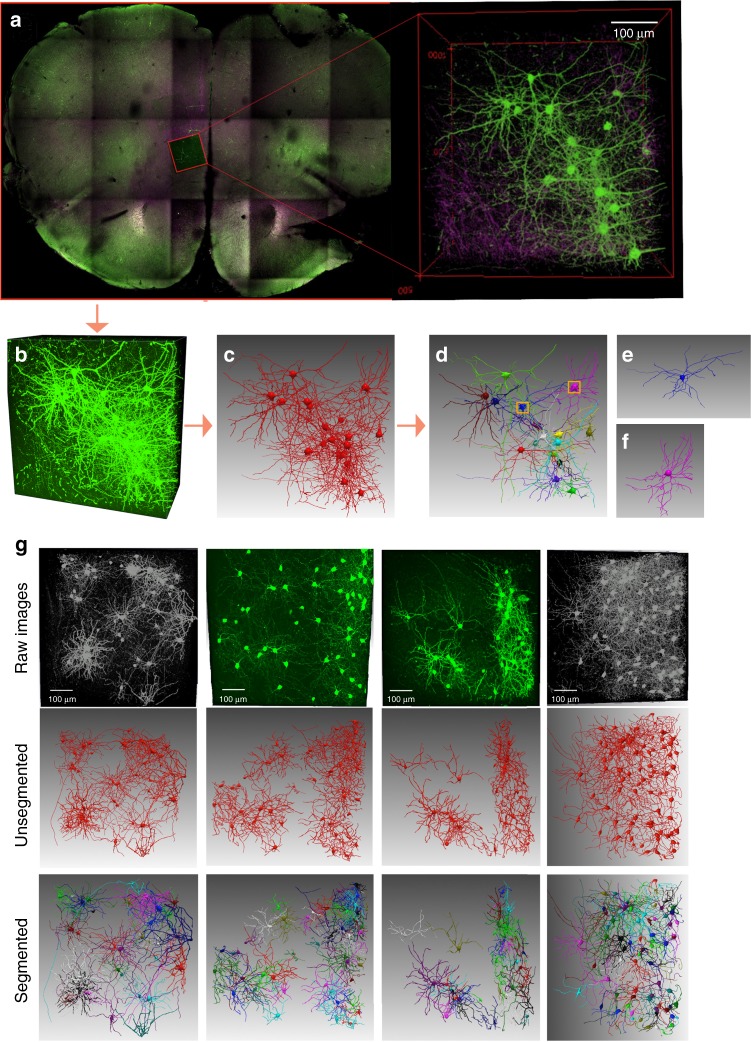


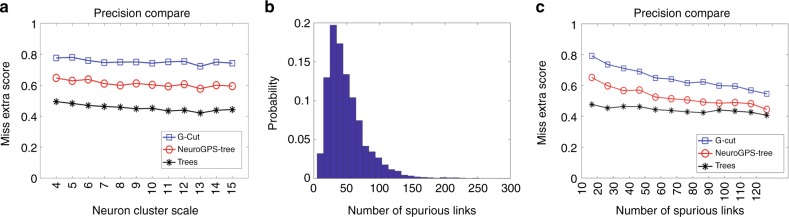


Verification
Claims the paper makes
The claims and statistics of this paper haven’t been checked yet.
Free: it reads the open-access text and checks the first 5 claims that cite a source we can check. Create a free account to check every claim.
Claims other papers make about this one
Each is checked against this paper’s own text: does it say what the citing paper says it does?
In the citing paper
“Innovations in more automated reconstruction and registration will be necessary to generate high-throughput and comprehensive data sets40,41.”
From The diversity of GABAergic neurons and neural communication elements (2019) · cites this paper as [40]
Self-check
Percentages, sums and reported differences re-computed from the paper’s own numbers.
The self-check needs the paper’s full text.
Citations
Cites
A note on two problems in connexion with graphs
Dijkstra, E. W. (1959) · Numerische Mathematik · doi:10.1007/bf01386390 · Cited by 29,065
Transgenic strategies for combinatorial expression of fluorescent proteins in the nervous system
Livet, J., Weissman, T. A., Kang, H., Draft, R. W., Lu, J., Bennis, R. A., Sanes, J. R., & Lichtman, J. W. (2007) · Nature · doi:10.1038/nature06293 · Cited by 1,876
CLARITY for mapping the nervous system
Chung, K., & Deisseroth, K. (2013) · Nature Methods · doi:10.1038/nmeth.2481 · Cited by 747
Peng, H., Ruan, Z., Long, F., Simpson, J. H., & Myers, E. W. (2010) · Nature Biotechnology · doi:10.1038/nbt.1612 · Cited by 707
Huang, W., Massouras, A., Inoue, Y., Peiffer, J., Ràmia, M., Tarone, A. M., Turlapati, L., Zichner, T., Zhu, D., Lyman, R. F., et al. (2014) · Genome Research · doi:10.1101/gr.171546.113 · Cited by 661
Improved tools for the Brainbow toolbox
Cai, D., Cohen, K. B., Luo, T., Lichtman, J. W., & Sanes, J. R. (2013) · Nature Methods · doi:10.1038/nmeth.2450 · Cited by 426
One Rule to Grow Them All: A General Theory of Neuronal Branching and Its Practical Application
Cuntz, H., Forstner, F., Borst, A., & Häusser, M. (2010) · PLoS Computational Biology · doi:10.1371/journal.pcbi.1000877 · Cited by 375
Wearne, S. L., Rodriguez, A., Ehlenberger, D. B., Rocher, A. B., Henderson, S. C., & Hof, P. R. (2005) · Neuroscience · doi:10.1016/j.neuroscience.2005.05.053 · Cited by 330
Šišková, Z., Justus, D., Kaneko, H., Friedrichs, D., Henneberg, N., Beutel, T., Pitsch, J., Schoch, S., Becker, A., von der Kammer, H., et al. (2014) · Neuron · doi:10.1016/j.neuron.2014.10.024 · Cited by 320
2,2′‐Thiodiethanol: A new water soluble mounting medium for high resolution optical microscopy
Staudt, T., Lang, M. C., Medda, R., Engelhardt, J., & Hell, S. W. (2007) · Microscopy Research and Technique · doi:10.1002/jemt.20396 · Cited by 291
Cited by
Blunt, J. W., Copp, B. R., Keyzers, R. A., Munro, M. H. G., & Prinsep, M. R. (2017) · Natural Product Reports · doi:10.1039/c6np00124f · Cited by 465
Cellular Anatomy of the Mouse Primary Motor Cortex
Muñoz-Castañeda, R., Zingg, B., Matho, K. S., Wang, Q., Chen, X., Foster, N. N., Narasimhan, A., Li, A., Hirokawa, K. E., Huo, B., et al. (2020) · doi:10.1101/2020.10.02.323154 · Cited by 270
Self-citationCellular anatomy of the mouse primary motor cortex
Muñoz-Castañeda, R., Zingg, B., Matho, K. S., Chen, X., Wang, Q., Foster, N. N., Li, A., Narasimhan, A., Hirokawa, K. E., Huo, B., et al. (2021) · Nature · doi:10.1038/s41586-021-03970-w · Cited by 267
Self-citationThe diversity of GABAergic neurons and neural communication elements
Huang, Z. J., & Paul, A. (2019) · Nature Reviews Neuroscience · doi:10.1038/s41583-019-0195-4 · Cited by 201
Synaptic Specificity and Application of Anterograde Transsynaptic AAV for Probing Neural Circuitry
Zingg, B., Peng, B., Huang, J., Tao, H. W., & Zhang, L. I. (2020) · The Journal of Neuroscience · doi:10.1523/jneurosci.2158-19.2020 · Cited by 186
“Last, we demonstrate that AAV1 transsynaptic tagging may be used to catalog cell types based on their input, morphology, and gene expression by incorporating the use of transgenic mice and techniques for achieving sparse labeling of transsynaptically tagged neurons (Kim et al., 2017; Gouwens et al., 2019; Li et al., 2…”
Background
Metadata
- Authors
- Li, R., Zhu, M., Li, J., Bienkowski, M. S., Foster, N. N., Xu, H., Ard, T., Bowman, I., Zhou, C., Veldman, M. B., Yang, X. W., Hintiryan, H., Zhang, J., & Dong, H.-W.
- Affiliations
- University of Southern California (US)
- Xiamen University (CN)
- University of California, Los Angeles (US)
- Corresponding author
- Zhang, Junsong
- Dong, Hong-Wei
- ORCID
- Venue
- Nature Communications
- Published
- 2019-04-04
- Volume
- 10
- Issue
- 1
- Pages
- 1549-1549
- ISSN
- 2041-1723 (ISSN-L)
- PMC
- PMC6449501
- OpenAlex
- W2925806435
- Cited by
- 57
- References
- 32
- Citations by year
- 2026: 5 · 2025: 9 · 2024: 10 · 2023: 5 · 2022: 10 · 2021: 10 · 2020: 5 · 2019: 2
- FWCI
- 3.26
- Type
- journal article
- Language
- en
- Open access
- gold
- doi.org
- Licence
- cc-by
- creativecommons.org/licenses/by/4.0 (tdm)
- creativecommons.org/licenses/by/4.0 (vor)
- Locations
- Nature Communications (publishedVersion, cc-by)
- Europe PMC (PubMed Central) (publishedVersion, cc-by)
- PubMed Central (publishedVersion, cc-by)
- PubMed (publishedVersion)
- RePEc: Research Papers in Economics (submittedVersion)
- DOAJ (DOAJ: Directory of Open Access Journals) (submittedVersion)
- DOAJ (DOAJ: Directory of Open Access Journals) (submittedVersion, cc-by-sa)
- Funders
- National Natural Science Foundation of China (2013CB329502, 61772440)
- China Scholarship Council
- Xiamen University
- National Institutes of Health
- National Key Research and Development Program of China (2013CB329502)
- National Institute of Mental Health (MH094360, U01MH106008, R01MH094360, MH094360-01A1)
- National Cancer Institute (U01CA198932)
- Topics
- Life Sciences › Biochemistry, Genetics and Molecular Biology › Biophysics › Cell Image Analysis Techniques
- Physical Sciences › Computer Science › Computer Vision and Pattern Recognition › Medical Image Segmentation Techniques
- Physical Sciences › Computer Science › Computer Vision and Pattern Recognition › Advanced Neural Network Applications
- Keywords
- neuron segmentation, graph cuts
- MeSH terms
- Algorithms, Brain Mapping, Computer Simulation, Models, Theoretical, Nerve Net, Neurons, Computational Biology
About these checks
Registry, retraction, Cites and statistics results are computed, not judged, with one exception: a printed reference that no index lists is read once by a model before it counts as a citation error. Claims are extracted by a model and kept only when their quote appears verbatim in the text; each cited source is then checked, with a model’s help, for whether it says what the claim relies on. Those verdicts can be wrong — read the claim’s quote and the cited source before relying on one.
Statistics and arithmetic are recomputed, not judged.
Confidence bands are shown only for fields calibrated on our annotated test set. None is calibrated yet, so no band is shown.
What counts as a claim ›How we measure confidence ›How we check this ›
Are you an author, or do you see a problem with this page? Request a review
How to cite
Cite CoChat for the checks on this page, and the paper for its own findings.
- This page
- CoChat. (2026). Citation check: Precise segmentation of densely interweaving neuron clusters using G-Cut. https://app.cochat.ai/papers/10.1038/s41467-019-09515-0
- The paper
- Li, R., Zhu, M., Li, J., Bienkowski, M. S., Foster, N. N., Xu, H., Ard, T., Bowman, I., Zhou, C., Veldman, M. B., Yang, X. W., Hintiryan, H., Zhang, J., & Dong, H.-W. (2019). Precise segmentation of densely interweaving neuron clusters using G-Cut. Nature Communications. https://doi.org/10.1038/s41467-019-09515-0
Data sources
Bibliographic data: Semantic Scholar, OpenAlex, Crossref.
Contains information from the Semantic Scholar Academic Graph Datasets, made available under the ODC Attribution License (ODC-BY 1.0).
Semantic Scholar’s data is described in: Kinney, R., et al. (2023). The Semantic Scholar Open Data Platform. arXiv:2301.10140.
