

The DOI matches its Crossref record; 80 of the 80 references it cites were found in a registry or an index.
Epigenetic dysregulation of enhancers in neurons is associated with Alzheimer’s disease pathology and cognitive symptoms
Open accessAbstract
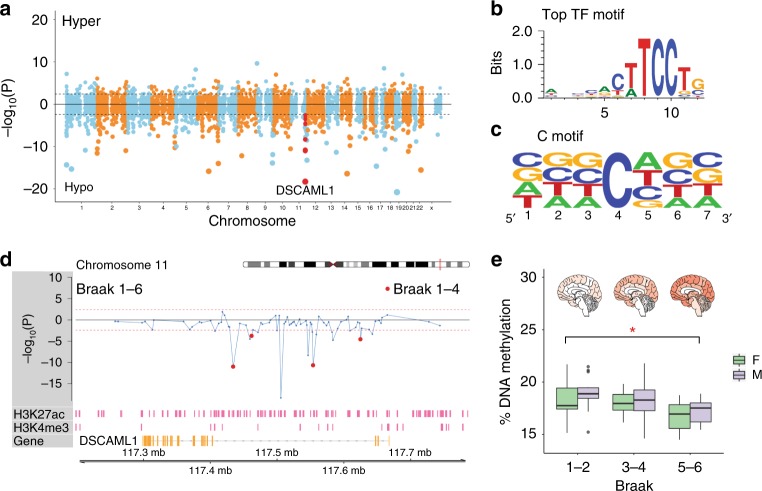
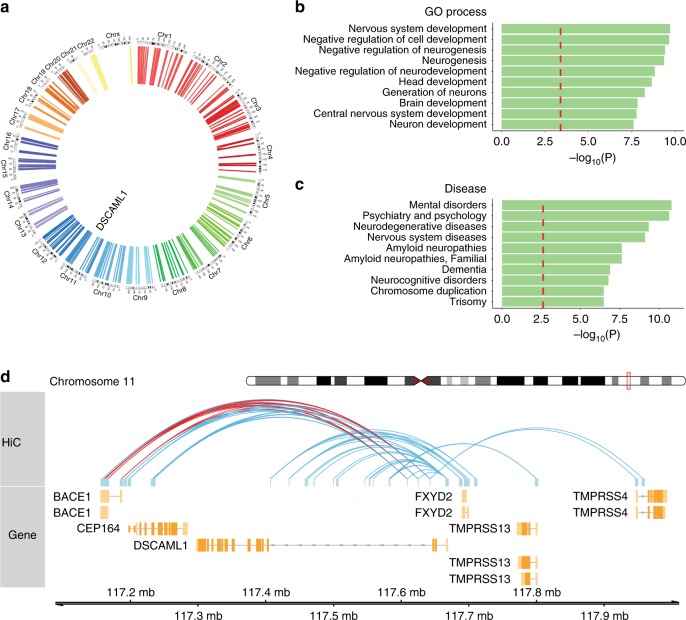
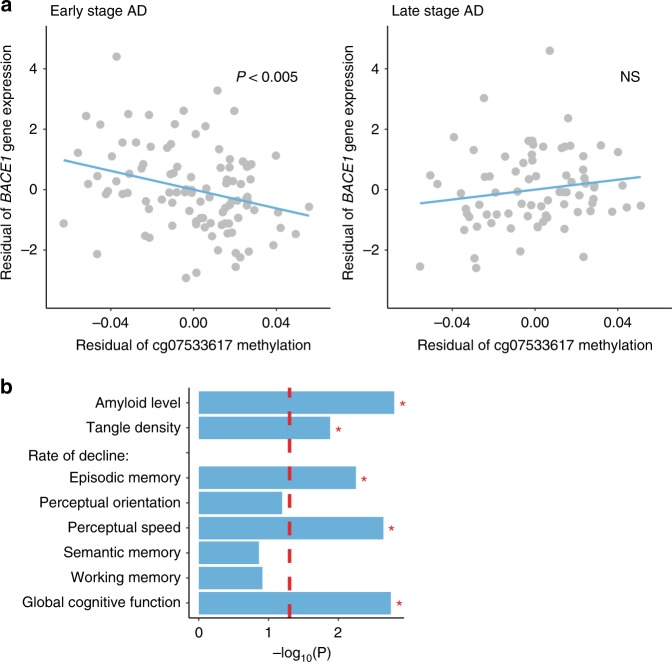
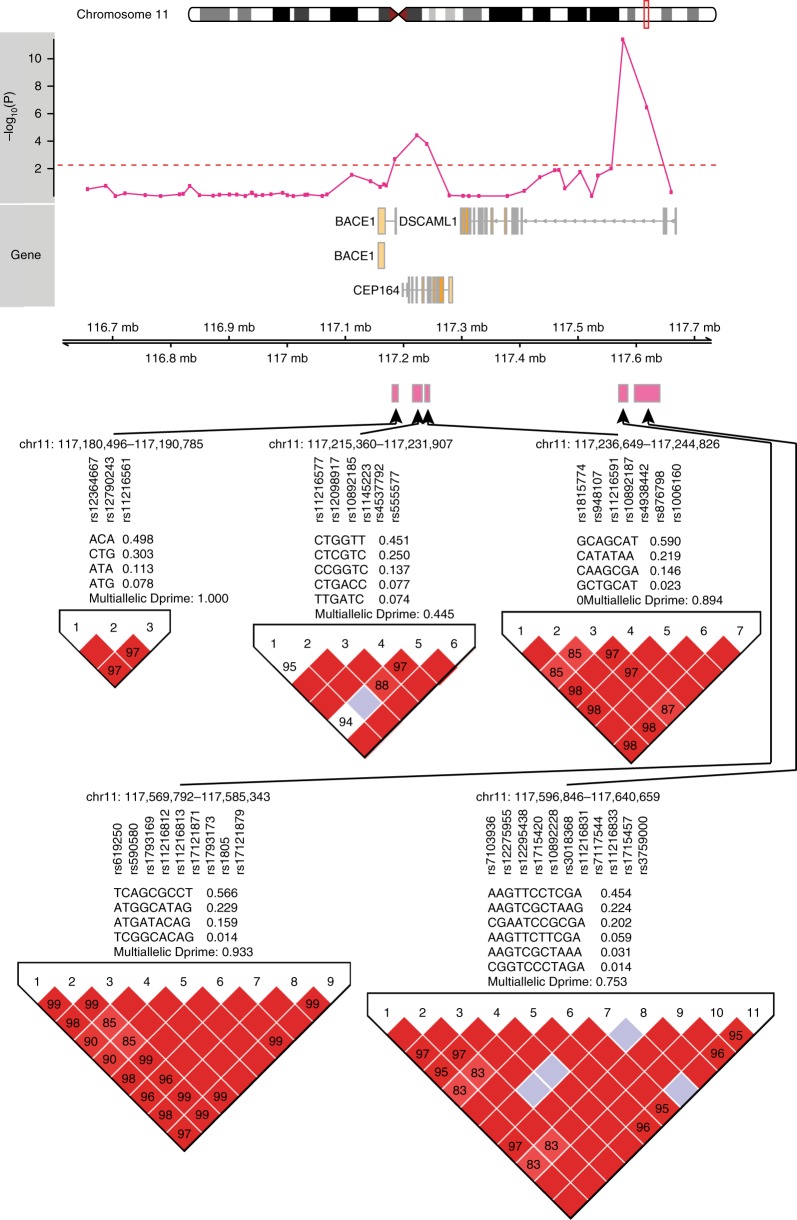
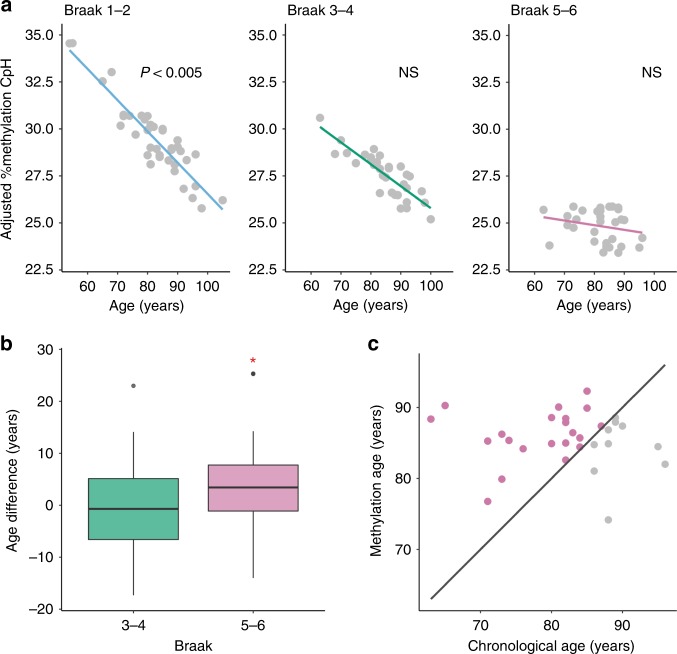
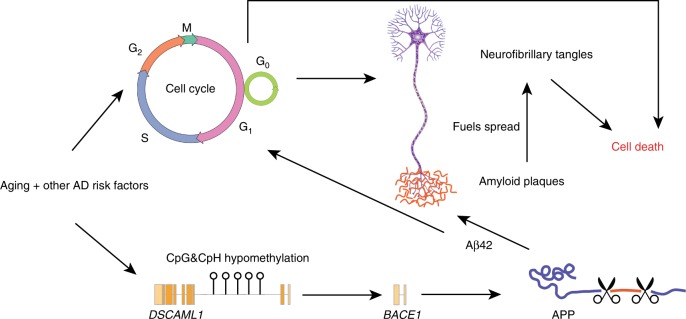
Epigenetic control of enhancers alters neuronal functions and may be involved in Alzheimer’s disease (AD). Here, we identify enhancers in neurons contributing to AD by comprehensive fine-mapping of DNA methylation at enhancers, genome-wide. We examine 1.2 million CpG and CpH sites in enhancers in prefrontal cortex neurons of individuals with no/mild, moderate, and severe AD pathology ( n = 101). We identify 1224 differentially methylated enhancer regions; most of which are hypomethylated at CpH sites in AD neurons. CpH methylation losses occur in normal aging neurons, but are accelerated in AD. Integration of epigenetic and transcriptomic data demonstrates a pro-apoptotic reactivation of the cell cycle in post-mitotic AD neurons. Furthermore, AD neurons have a large cluster of significantly hypomethylated enhancers in the DSCAML1 gene that targets BACE1 . Hypomethylation of these enhancers in AD is associated with an upregulation of BACE1 transcripts and an increase in amyloid plaques, neurofibrillary tangles, and cognitive decline.
Overview
The claims and statistics of this paper haven’t been checked yet.
Run the check — free, no account needed. It reads the open-access text and checks the sources it cites.
Integrity signals
Registry
Cites
Statistics
Figures
Verification
Claims the paper makes
The claims and statistics of this paper haven’t been checked yet.
Run the check — free, no account needed. It reads the open-access text and checks the sources it cites.
Claims other papers make about this one
Each is checked against this paper’s own text: does it say what the citing paper says it does?
In the citing paper
“Hypomethylated enhancer regions have been recently identified in AD neurons, where they may affect the expression of AD-relevant genes including tau kinases and BACE1 [512].”
From Molecular and cellular mechanisms underlying the pathogenesis of Alzheimer’s disease (2020) · cites this paper as [512]
In the citing paper
“More recently, a large cluster of significantly hypomethylated enhancers in the CpH sites were identified in prefrontal cortex neurons of individuals with severe AD pathology, and hypomethylation of these enhancers in the DSCAML1 gene likely upregulate BACE1 transcripts in AD (17).”
From The β-Secretase BACE1 in Alzheimer’s Disease (2021) · cites this paper as [17]
Self-check
Percentages, sums and reported differences re-computed from the paper’s own numbers.
The self-check needs the paper’s full text.
Citations
Cites
limma powers differential expression analyses for RNA-sequencing and microarray studies
Ritchie, M. E., Phipson, B., Wu, D., Hu, Y., Law, C. W., Shi, W., & Smyth, G. K. (2015) · Nucleic Acids Research · doi:10.1093/nar/gkv007 · Cited by 40,458
A global reference for human genetic variation
The 1000 Genomes Project Consortium, authors, C., Auton, A., Abecasis, G. R., Steering committee, Altshuler, D. M., Durbin, R. M., Abecasis, G. R., Bentley, D. R., Chakravarti, A., et al. (2015) · Nature · doi:10.1038/nature15393 · Cited by 18,247
Neuropathological stageing of Alzheimer-related changes.
Braak, H., & Braak, E. (1991) · Acta Neuropathologica · doi:10.1007/bf00308809 · Cited by 16,123
Heinz, S., Benner, C., Spann, N., Bertolino, E., Lin, Y. C., Laslo, P., Cheng, J. X., Murre, C., Singh, H., & Glass, C. K. (2010) · Molecular Cell · doi:10.1016/j.molcel.2010.05.004 · Cited by 13,382
Robust enumeration of cell subsets from tissue expression profiles
Newman, A. M., Liu, C. L., Green, M. R., Gentles, A. J., Feng, W., Xu, Y., Hoang, C. D., Diehn, M., & Alizadeh, A. A. (2015) · Nature Methods · doi:10.1038/nmeth.3337 · Cited by 13,224
Amyloid oligomers exacerbate tau pathology in a mouse model of tauopathy
Selenica, M.-L. B., Brownlow, M., Jimenez, J. P., Lee, D. C., Pena, G., Dickey, C. A., Gordon, M. N., & Morgan, D. (2013) · Neurodegenerative Diseases · doi:10.1159/000337230 · Cited by 10,359
A 3D Map of the Human Genome at Kilobase Resolution Reveals Principles of Chromatin Looping
Rao, S. S. P., Huntley, M. H., Durand, N. C., Stamenova, E. K., Bochkov, I. D., Robinson, J. T., Sanborn, A. L., Machol, I., Omer, A. D., Lander, E. S., et al. (2014) · Cell · doi:10.1016/j.cell.2014.11.021 · Cited by 9,212
DNA methylation age of human tissues and cell types
Horvath, S. (2013) · Genome Biology · doi:10.1186/gb-2013-14-10-r115 · Cited by 7,075
Integrative analysis of 111 reference human epigenomes
Roadmap Epigenomics Consortium, Kundaje, A., Meuleman, W., Ernst, J., Bilenky, M., Yen, A., Heravi-Moussavi, A., Kheradpour, P., Zhang, Z., Wang, J., et al. (2015) · Nature · doi:10.1038/nature14248 · Cited by 6,368
Self-citationLD Score regression distinguishes confounding from polygenicity in genome-wide association studies
Schizophrenia Working Group of the Psychiatric Genomics Consortium, Bulik-Sullivan, B. K., Loh, P.-R., Finucane, H. K., Ripke, S., Yang, J., Patterson, N., Daly, M. J., Price, A. L., & Neale, B. M. (2015) · Nature Genetics · doi:10.1038/ng.3211 · Cited by 5,559
Cited by
Sorted by citations
Items 101–200 of 253
Lutz, M. W., & Chiba‐Falek, O. (2022) · Alzheimer s & Dementia Translational Research & Clinical Interventions · doi:10.1002/trc2.12244 · Cited by 14
Das, V., Miller, J. H., Goud, A. C., Annadurai, N., Sanctis, J. B. D., Hrubá, L., & Hajdúch, M. (2024) · Medicinal Research Reviews · doi:10.1002/med.22033 · Cited by 16
Considerations for integrative multi‐omic approaches to explore Alzheimer's disease mechanisms
Ma, Y., Klein, H., & Jager, P. L. D. (2020) · Brain Pathology · doi:10.1111/bpa.12878 · Cited by 17
Ruffini, N., Klingenberg, S., Heese, R., Schweiger, S., & Gerber, S. (2022) · Frontiers in Aging Neuroscience · doi:10.3389/fnagi.2022.866886 · Cited by 16
Palma‐Gudiel, H., Yu, L., Huo, Z., Yang, J., Wang, Y., Gu, T., Gao, C., Jager, P. L. D., Jin, P., Bennett, D. A., et al. (2022) · Alzheimer s & Dementia · doi:10.1002/alz.12761 · Cited by 14
Gene expression rearrangements denoting changes in the biological state
Gonzalez, A., Nieves, J., Leon, D. A., Vega, M. L. B., & Sosa, P. V. (2021) · Scientific Reports · doi:10.1038/s41598-021-87764-0 · Cited by 14
Park, K. H. J., & Barrett, T. (2020) · Journal of Alzheimer s Disease Reports · doi:10.3233/adr-200170 · Cited by 12
Unveiling DNA methylation in Alzheimer’s disease: a review of array-based human brain studies
Alves, V. C., Carro, E., & Figueiro‐Silva, J. (2024) · Neural Regeneration Research · doi:10.4103/1673-5374.393106 · Cited by 13
Neurodegenerative diseases: Epigenetic regulatory mechanisms and therapeutic potential
Men, J., Wang, X., Zhou, Y., Huang, Y., Zheng, Y., Wang, Y., Yang, S., Chen, N., Yan, N., & Duan, X. (2025) · Cellular Signalling · doi:10.1016/j.cellsig.2025.111715 · Cited by 16
ADmeth: A Manually Curated Database for the Differential Methylation in Alzheimer's Disease
Peng, X., Zhang, W., Cui, W., Ding, B., Lyu, Q., & Wang, J. (2022) · IEEE Transactions on Computational Biology and Bioinformatics · doi:10.1109/tcbb.2022.3178087 · Cited by 12
Mei, T., Li, Y., Dolado, A. O., Li, Z., Andersson, R., Berliocchi, L., & Rasmussen, L. J. (2023) · Frontiers in Aging Neuroscience · doi:10.3389/fnagi.2023.1101216 · Cited by 12
Williams, S. I., Clark, S. J., Pidsley, R., & Stirzaker, C. (2025) · Epigenomics · doi:10.1080/17501911.2025.2548755 · Cited by 13
Epigenetic pharmacology in aging: from mechanisms to therapies for age-related disorders
Yu, H., Feng, T., Zhang, C., Jiao, Z., Fan, W., Jiang, R., Kong, D., & Li, F. (2025) · Frontiers in Pharmacology · doi:10.3389/fphar.2025.1699296 · Cited by 11
Liu, A., Citu, C., Enduru, N., Chen, X., Tung, C.-H., Sinha, T., Sepulveda, S. E., Manuel, A. M., Gorski, D., Fernandes, B. S., et al. (2025) · Science Advances · doi:10.1126/sciadv.adw4917 · Cited by 15
Li, J. Z., Ramalingam, N., & Li, S. (2024) · Neural Regeneration Research · doi:10.4103/nrr.nrr-d-23-01827 · Cited by 11
LOOF, A. D., & Schoofs, L. (2019) · OBM Neurobiology · doi:10.21926/obm.neurobiol.1904046 · Cited by 14
Xu, D., Zhang, C., Bi, X., Xu, J., Guo, S., Li, P., Shen, Y., Cai, J., Zhang, N., Tian, G., et al. (2023) · Computers in Biology and Medicine · doi:10.1016/j.compbiomed.2023.107802 · Cited by 11
Self-citationEpigenetic Regulation of Amyloid-beta Metabolism in Alzheimer’s Disease
He, C., Huang, Z., Yu, C.-C., Wang, H., Zhou, H., & Kong, L.-H. (2020) · Current Medical Science · doi:10.1007/s11596-020-2283-0 · Cited by 11
Neuronal Cell Cycle Re-Entry Enhances Neuropathological Features in App NLF Knock-In Mice
Barrett, T., Stangis, K. A., Saito, T., Saido, T. C., & Park, K. H. J. (2021) · Journal of Alzheimer s Disease · doi:10.3233/jad-210091 · Cited by 12
Fan, Y., Liu, X., Guan, F., Hang, X., He, X., & Jin, J. (2024) · Viruses · doi:10.3390/v16010100 · Cited by 11
Fisher, D. W., Dunn, J. T., Keszycki, R. M., Rodríguez, G., Bennett, D. A., Wilson, R. S., & Dong, H. (2024) · Translational Psychiatry · doi:10.1038/s41398-024-02878-z · Cited by 12
Granov, R., Vedad, S., Wang, S.-H., Durham, A., Shah, D., & Pasinetti, G. M. (2024) · Molecular Neurobiology · doi:10.1007/s12035-024-04339-6 · Cited by 12
Mettl3 regulates the pathogenesis of Alzheimer’s disease via fine-tuning Lingo2
Zhao, X., Ma, C., Sun, Q., Huang, X., Qu, W., Chen, Y., Liu, Z., Bao, A., Sun, B., Yang, Y., et al. (2025) · Molecular Psychiatry · doi:10.1038/s41380-025-02984-4 · Cited by 10
Wu, S., Yang, F., Shan, C., Wang, B., Wang, W., Li, H., Yu, L., He, L., Li, X., Sun, L., et al. (2023) · Frontiers in Genetics · doi:10.3389/fgene.2023.1175864 · Cited by 10
The neurogenic niche in Alzheimer’s disease
Wander, C. M., & Song, J. (2021) · Neuroscience Letters · doi:10.1016/j.neulet.2021.136109 · Cited by 9
E2F4-Based Gene Therapy Mitigates the Phenotype of the Alzheimer's Disease Mouse Model 5xFAD
López‐Sánchez, N., Garrido‐García, A., Ramón‐Landreau, M., Cano‐Daganzo, V., & Frade, J. M. (2021) · Neurotherapeutics · doi:10.1007/s13311-021-01151-1 · Cited by 11
Epigenetic control of heredity
Kachhawaha, A. S., Mishra, S., & Tiwari, A. K. (2023) · Progress in molecular biology and translational science · doi:10.1016/bs.pmbts.2023.03.006 · Cited by 9
Sefiani, A., Rusyn, I., & Geoffroy, C. G. (2022) · Scientific Reports · doi:10.1038/s41598-022-17389-4 · Cited by 8
Deciphering the Gene Regulatory Landscape Encoded in DNA Biophysical Features
Pataskar, A., Vanderlinden, W., Emmerig, J., Singh, A. P., Lipfert, J., & Tiwari, V. K. (2019) · iScience · doi:10.1016/j.isci.2019.10.055 · Cited by 9
Review: In vitro Cell Platform for Understanding Developmental Toxicity
Xie, J., Wettschurack, K. W., & Yuan, C. (2020) · Frontiers in Genetics · doi:10.3389/fgene.2020.623117 · Cited by 11
regionalpcs improve discovery of DNA methylation associations with complex traits
Eulalio, T. Y., Sun, M., Gevaert, O., Greicius, M. D., Montine, T. J., Nachun, D. C., & Montgomery, S. B. (2025) · Nature Communications · doi:10.1038/s41467-024-55698-6 · Cited by 8
Pagano, L., Lagrotteria, D., Facconi, A., Saraceno, C., Longobardi, A., Bellini, S., Ingannato, A., Bagnoli, S., Ducci, T., Mingrino, A., et al. (2025) · International Journal of Molecular Sciences · doi:10.3390/ijms26094198 · Cited by 9
An Emerging Role for Enhancer RNAs in Brain Disorders
Patel, A., & Dharap, A. A. (2024) · NeuroMolecular Medicine · doi:10.1007/s12017-024-08776-3 · Cited by 9
A Mutant Variant of E2F4 Triggers Multifactorial Therapeutic Effects in 5xFAD Mice
López‐Sánchez, N., Ramón‐Landreau, M., Trujillo, C., Garrido‐García, A., & Frade, J. M. (2022) · Molecular Neurobiology · doi:10.1007/s12035-022-02764-z · Cited by 7
Quo vadis PGRMC? Grand-Scale Biology in Human Health and Disease
Cahill, M. A. (2022) · Frontiers in Bioscience-Landmark · doi:10.31083/j.fbl2711318 · Cited by 8
Padhy, B., Kapuganti, R. S., Hayat, B., Mohanty, P. P., & Alone, D. P. (2022) · Gene · doi:10.1016/j.gene.2022.147096 · Cited by 8
Silvaieh, S., König, T., Wurm, R., Parvizi, T., Berger–Sieczkowski, E., Goeschl, S., Hotzy, C., Wagner, M., Berutti, R., Sammler, E. M., et al. (2023) · Human Genomics · doi:10.1186/s40246-023-00499-z · Cited by 8
p53-mediated neurodegeneration in the absence of the nuclear protein Akirin2
Peek, S. L., Bosch, P. J., Bahl, E., Iverson, B. J., Parida, M., Bais, P., Manak, J. R., Michaelson, J. J., Burgess, R. W., & Weiner, J. A. (2022) · iScience · doi:10.1016/j.isci.2022.103814 · Cited by 8
Perez, S. M., Boley, A. M., McCoy, A. M., & Lodge, D. J. (2023) · International Journal of Molecular Sciences · doi:10.3390/ijms24087196 · Cited by 6
Cellular specificity is key to deciphering epigenetic changes underlying Alzheimer's disease
Signal, B., Suárez, T. G. P., Taberlay, P. C., & Woodhouse, A. (2023) · Neurobiology of Disease · doi:10.1016/j.nbd.2023.106284 · Cited by 8
Aderinto, N., Babalola, A. E., Ajagbe͓, A. O., Obasanjo, O. M., Moradeyo, A. A., Ukoaka, B. M., Oyetola, E. O., Babalola, D. O., Abraham, I. C., Olatunji, G. D., et al. (2025) · The Egyptian Journal of Neurology Psychiatry and Neurosurgery · doi:10.1186/s41983-025-00957-6 · Cited by 8
Natarajan, K., Eisfeldt, J., Hammond, M., Patra, K., Laffita‐Mesa, J. M., Andrade‐Talavera, Y., Birtele, M., Öijerstedt, L., Fisahn, A., Parmar, M., et al. (2021) · Acta Neuropathologica Communications · doi:10.1186/s40478-021-01234-2 · Cited by 7
Comprehensive characterization of the transcriptional landscape in Alzheimer’s disease (AD) brains
Chen, C., Zhang, Z., Liu, Y., Hong, W., Karahan, H., Wang, J., Li, W., Diao, L., Yu, M., Saykin, A. J., et al. (2025) · Science Advances · doi:10.1126/sciadv.adn1927 · Cited by 6
“Thirty-six differentially expressed eRNAs (DE eRNAs) were detected in AD samples, and these eRNAs were significantly enriched in AD-associated brain regions ( 30 ).”
Hu, L., Tang, Q., Meng, F., Xu, Y., Chen, W., & Xu, S. (2024) · Journal of Molecular Biology · doi:10.1016/j.jmb.2024.168874 · Cited by 6
Coleman, P. D., Delvaux, E., Kordower, J. H., Boehringer, A. V., & Huseby, C. J. (2025) · Alzheimer s & Dementia · doi:10.1002/alz.14555 · Cited by 7
Tet2 loss and enhanced ciliogenesis suppress α-synuclein pathology
Emmanuel, Q., Vatsa, N., Ensink, E., Brown, J., Cave, T., Aguileta, M., Kuhn, E., Lindquist, A., Gilliland, C., Steiner, J. A., et al. (2025) · Acta Neuropathologica Communications · doi:10.1186/s40478-025-01988-z · Cited by 7
Self-citationАлфимова, М. В., Kondratyev, N. V., Golov, A. K., & Голимбет, В. Е. (2020) · Scientific Reports · doi:10.1038/s41598-020-61671-2 · Cited by 6
Holper, S., Watson, R., Churilov, L., Yates, P., Lim, Y. Y., Barnham, K. J., & Yassi, N. (2023) · The Journal of Prevention of Alzheimer s Disease · doi:10.14283/jpad.2023.55 · Cited by 6
Jąkalski, M., Bruhn‐Olszewska, B., Rychlicka-Buniowska, E., Davies, H., Sarkisyan, D., Siedlar, M., Baran, J., Węglarczyk, K., Jaszczyński, J., Ryś, J., et al. (2025) · Cellular and Molecular Life Sciences · doi:10.1007/s00018-025-05618-8 · Cited by 6
Zimmer‐Bensch, G., & Zempel, H. (2021) · Preprints.org · doi:10.20944/preprints202105.0717.v1 · Cited by 6
The Contributions of Thrombospondin-1 to Epilepsy Formation
Cheng, Y., Zhai, Y., Yuan, Y., Wang, Q., Li, S., & Sun, H. (2024) · Neuroscience Bulletin · doi:10.1007/s12264-024-01194-2 · Cited by 5
The Promise of Epigenetic Editing for Treating Brain Disorders
González-Molina, L. A., Dolga, A. M., Rots, M. G., & Sarno, F. (2025) · Sub-cellular biochemistry/Subcellular biochemistry · doi:10.1007/978-3-031-75980-2_4 · Cited by 5
Targeting Age-Related Neurodegenerative Diseases by AAV-Mediated Gene Therapy
Cagin, U. (2021) · Advances in experimental medicine and biology · doi:10.1007/978-3-030-55035-6_15 · Cited by 5
Ramón‐Landreau, M., Sánchez‐Puelles, C., López‐Sánchez, N., Lozano-Ureña, A., Llabrés-Mas, A. M., & Frade, J. M. (2022) · International Journal of Molecular Sciences · doi:10.3390/ijms232012093 · Cited by 6
Epigenetics and the gut–brain axis: Insights into DNA methylation, aging, and Alzheimer disease
Kumar, V., Shukla, R., Gangani, S., Joseph, R., Jain, S., & Yadav, H. (2026) · Journal of Pharmacology and Experimental Therapeutics · doi:10.1016/j.jpet.2026.104299 · Cited by 5
Mesenchymal Stem Cells from Familial Alzheimer’s Patients Express MicroRNA Differently
Rochín-Hernández, L. J., Rochín‐Hernández, L. S., Padilla-Cristerna, M. L., Duarte-García, A., Jiménez-Acosta, M. A., Figueroa‐Corona, M. D. P., & Meraz‐Ríos, M. A. (2024) · International Journal of Molecular Sciences · doi:10.3390/ijms25031580 · Cited by 4
Jankowski, J., Lee, H., Liu, C., Wilflingseder, J., & Hennighausen, L. G. (2024) · Communications Biology · doi:10.1038/s42003-024-06855-6 · Cited by 5
DNA Methylation in Alzheimer’s Disease
Weymouth, L. S., Smith, A. R., & Lunnon, K. (2024) · Current topics in behavioral neurosciences · doi:10.1007/7854_2024_530 · Cited by 4
Zanfardino, P., Amati, A., Doccini, S., Girolamo, F., Tullo, A., Longo, G., Santorelli, F. M., & Petruzzella, V. (2025) · Life Sciences · doi:10.1016/j.lfs.2025.123995 · Cited by 3
Ziaei, A., Kargar, M., Shirvani-Farsani, Z., & MehrabMohseni, M. (2026) · Biomarker Research · doi:10.1186/s40364-025-00886-9 · Cited by 4
Tripathi, S., & Bhawana, B. (2024) · Neurochemical Research · doi:10.1007/s11064-024-04167-z · Cited by 4
The impact of sex on memory during aging and Alzheimer's disease progression: Epigenetic mechanisms
Scheinman, S. B., & Dong, H. (2024) · Journal of Alzheimer s Disease · doi:10.1177/13872877241288709 · Cited by 3
Naidoo, V., Martínez-Iglesias, O. A., & Cacabelos, R. (2022) · Elsevier eBooks · doi:10.1016/b978-0-12-823039-8.00012-5 · Cited by 3
Shen, W., Yang, J. J., & Yang, P. (2022) · Current Alzheimer Research · doi:10.2174/1567205019666220831125142 · Cited by 3
Zhao, Z., Liu, A., Citu, C., Enduru, N., Chen, X., Manuel, A. M., Sinha, T., Gorski, D., Fernandes, B. S., Yu, M., et al. (2024) · Research Square · doi:10.21203/rs.3.rs-4622123/v1 · Cited by 3
The genetics of phospholipase A2 induced redox signaling in neuroinflammation and neuronal diseases
Maiti, A. K. (2023) · Elsevier eBooks · doi:10.1016/b978-0-323-95698-7.00017-6 · Cited by 2
Zainuddin, M.-S., Ghanesh, K., Ganesan, N., Kumari, M., Radhakrishnan, A. K., & Bhuvanendran, S. (2025) · Nutritional Neuroscience · doi:10.1080/1028415x.2025.2526155 · Cited by 2
Relationship periodontitis and Alzheimer's disease: Relevant aspects from an epigenetic view
Chacón, T., & Hernández, H. G. (2025) · Journal of Alzheimer s Disease · doi:10.1177/13872877251397406 · Cited by 2
Blood gene expression network expression strongly relates to brain amyloid burden
Janve, V. A., Seto, M., Sperling, R. A., Aisen, P. S. S., Rissman, R. A., Koran, M. E. I., Dumitrescu, L. C., Buckley, R. F., Hohman, T. J., & A4 and LEARN Study Group (2025) · Alzheimer s & Dementia · doi:10.1002/alz.70982 · Cited by 2
CRISPR–Cas-based live cell imaging of genome dynamics
Zhu, Y., Moerner, W. E., & Qi, L. S. (2026) · Nature Reviews Genetics · doi:10.1038/s41576-026-00949-z · Cited by 5
Ramos‐Campoy, O., Comas‐Albertí, A., Hervás, D., Borrego‐Écija, S., Bosch, B., Sandoval, J., Fort‐Aznar, L., Moreno, F., Fernández‐Villullas, G., Molina‐Porcel, L., et al. (2024) · International Journal of Molecular Sciences · doi:10.3390/ijms25105445 · Cited by 2
Molecular etiopathogenesis of neurodegenerative diseases
Divya, D., Thekkekkara, D., Sai, T. E., Ramakrishna, D., Manjula, S. N., & Goswami, S. K. (2024) · Elsevier eBooks · doi:10.1016/b978-0-443-28822-7.00002-7 · Cited by 2
Epigenetic Insights Into Aging: Emerging Roles of Natural Products in Therapeutic Interventions
Pang, Y., Zhang, H., Li, H., Wang, X., Wei, P., Yi, L., & Lin, S. (2025) · Phytotherapy Research · doi:10.1002/ptr.70003 · Cited by 3
Epigenetic regulations in neurological disorders
Mondal, P., Sarkar, S., & Das, A. (2023) · Elsevier eBooks · doi:10.1016/b978-0-12-823931-5.00010-4 · Cited by 2
Bioinformatics of epigenetic data generated from next-generation sequencing
Sheu, C.-Y. L., Huang, Y., Lin, P.-Y., Lin, G.-J., & Chen, P. (2023) · Elsevier eBooks · doi:10.1016/b978-0-443-18661-5.00006-3 · Cited by 2
Epigenetic Regulation of Enhancer RNAs in Neuropsychiatric Disease and Addiction
Kyzar, E. J., & Pandey, S. C. (2020) · Epigenomics · doi:10.2217/epi-2020-0135 · Cited by 2
Loss of Y is associated with multi-omic changes in immune cells from Alzheimer’s disease patientsPreprint
Jąkalski, M., Rychlicka-Buniowska, E., Davies, H., Sarkisyan, D., Siedlar, M., Baran, J., Węglarczyk, K., Jaszczyński, J., Ryś, J., Gedraitis, V., et al. (2023) · medRxiv · doi:10.1101/2023.02.07.23285520 · Cited by 2
Aquino, T. G., Courellis, H. S., Mamelak, A. N., Rutishauser, U., & O’Doherty, J. P. (2023) · bioRxiv (Cold Spring Harbor Laboratory) · doi:10.1101/2023.02.10.528055 · Cited by 2
Azadian, M. M., & George, P. M. (2023) · Elsevier eBooks · doi:10.1016/b978-0-12-820480-1.00040-1 · Cited by 3
Jankowski, J., Lee, H., Liu, C., Wilflingseder, J., & Hennighausen, L. G. (2024) · bioRxiv (Cold Spring Harbor Laboratory) · doi:10.1101/2024.02.29.582831 · Cited by 2
Metaxakis, A., Gkikas, I., & Tavernarakis, N. (2022) · Elsevier eBooks · doi:10.1016/b978-0-12-823761-8.00027-6 · Cited by 1
Kavšek, A., Salignon, J., Millán-Ariño, L., Marcinkowski, P., Sen, I., & Riedel, C. G. (2025) · Nature Communications · doi:10.1038/s41467-025-61786-y · Cited by 1
Wang, Z., Chen, Y., Feng, Y., Zu, G., Wang, W., Liang, L., Liu, X., Mei, Y., Yang, J., Wang, T., et al. (2026) · iScience · doi:10.1016/j.isci.2026.114692 · Cited by 1
Self-citationEnhancer-based gene therapy: a new path for precision medicine
Marei, H. E. S. (2026) · Hereditas · doi:10.1186/s41065-026-00655-0 · Cited by 1
Poddar, M. K., & Chakraborty, A. (2019) · Acta Scientifci Nutritional Health · doi:10.31080/asnh.2019.03.0458
Dysregulation of transcription and human diseases
Uchiumi, F. (2022) · Elsevier eBooks · doi:10.1016/b978-0-12-818787-6.00003-5 · Cited by 1
Minocycline Protects Against LPS-induced Neuronal Death and Memory Impairment in the Rat
Qaid, E. Y. A., Abdullah, Z., Zakaria, R., & Long, I. (2022) · Malaysian Journal of Medicine and Health Sciences · doi:10.47836/mjmhs.18.6.29 · Cited by 1
Epigenetic Therapy for Alzheimer’s Disease
Mehak, S. F., Sahu, V., Shivakumar, A. B., Gangadharan, G., & Kabekkodu, S. P. (2023) · Springer eBooks · doi:10.1007/978-981-99-2657-2_10 · Cited by 1
Tecalco-Cruz, Á. C., Macías‐Silva, M., Ramírez‐Jarquín, J. O., Ríos-López, D. G., & Zepeda–Cervantes, J. (2021) · TIP Revista Especializada en Ciencias Químico-Biológicas · doi:10.22201/fesz.23958723e.2021.0.295
Meng, G., Lu, D., Feng, Y., Sun, J., Ding, C., Sun, Y., Liu, X., Dai, J., Jin, W., & Zhang, W. (2019) · bioRxiv (Cold Spring Harbor Laboratory) · doi:10.1101/779249 · Cited by 1
E2F4 as a single multifactorial target against Alzheimer’s diseasePreprint
López‐Sánchez, N., Ramón‐Landreau, M., Trujillo, C., Garrido‐García, A., & Frade, J. M. (2020) · bioRxiv (Cold Spring Harbor Laboratory) · doi:10.1101/2020.05.08.082784 · Cited by 1
Ohadi, M., Khamse, S., Alizadeh, S., Bernhart, S. H., Afshar, H., & Delbari, A. (2022) · Research Square · doi:10.21203/rs.3.rs-1240759/v1 · Cited by 1
Li, R., Xu, T., Cai, G., Li, W., Qi, Y.-F., Xiao, X., Chen, J., Lv, Z., & Hao, Y. (2023) · Research Square · doi:10.21203/rs.3.rs-2699617/v1 · Cited by 1
Wang, Q., Zhao, Z., Lu, D., Xu, H., Xia, J., Zhang, W., & Meng, G. (2023) · bioRxiv (Cold Spring Harbor Laboratory) · doi:10.1101/2023.10.05.561015 · Cited by 1
Tet2 loss suppress α-synuclein pathology by stimulating ciliogenesisPreprint
Quansah, E., Vatsa, N., Ensink, E., Brown, J., Cave, T., Aguileta, M., Kuhn, E., Lindquist, A., Gilliland, C., Steiner, J. A., et al. (2024) · bioRxiv (Cold Spring Harbor Laboratory) · doi:10.1101/2024.08.02.606408 · Cited by 1
Self-citationLlabrés-Mas, A. M., López-Sánchez, N., Garrido‐García, A., Cano‐Daganzo, V., & Frade, J. M. (2024) · bioRxiv (Cold Spring Harbor Laboratory) · doi:10.1101/2024.10.29.620791 · Cited by 1
Tan, J., & Sun, Y. (2026) · bioRxiv (Cold Spring Harbor Laboratory) · doi:10.64898/2026.02.09.704931 · Cited by 1
Epigenetic Dysregulation of Enhancers in Neurons Drive Alzheimer's Disease, Study Finds
Talan, J. (2019) · Neurology Today · doi:10.1097/01.nt.0000578016.41264.3c
Epigenetic contributions to hemisphere asymmetry in healthy brain, aging, and Parkinson’s diseasePreprint
Li, P., Ensink, E., Lang, S., Marshall, L. L., Schilthuis, M., Lamp, J. A., Vega, I. E., & Labrie, V. (2019) · bioRxiv (Cold Spring Harbor Laboratory) · doi:10.1101/794255
Self-citationMultivariate polygenic models in personalized psychiatry
Алфимова, М. В. (2019) · V M BEKHTEREV REVIEW OF PSYCHIATRY AND MEDICAL PSYCHOLOGY · doi:10.31363/2313-7053-2019-4-1-55-57
Metadata
- Authors
- Li, P., Marshall, L., Oh, G., Jakubowski, J. L., Groot, D., He, Y., Wang, T., Petronis, A., & Labrie, V.
- Affiliations
- Van Andel Institute (US)
- Centre for Addiction and Mental Health (CA)
- Washington University in St. Louis (US)
- Corresponding author
- Labrie, Viviane
- ORCID
- Venue
- Nature Communications
- Published
- 2019-05-21
- Volume
- 10
- Issue
- 1
- Pages
- 2246-2246
- ISSN
- 2041-1723 (ISSN-L)
- PMC
- PMC6529540
- OpenAlex
- W2945063373
- Cited by
- 234
- References
- 80
- Citations by year
- 2026: 15 · 2025: 22 · 2024: 31 · 2023: 30 · 2022: 41 · 2021: 51 · 2020: 34 · 2019: 10
- FWCI
- 12.73
- Type
- journal article
- Language
- en
- Open access
- gold
- doi.org
- Locations
- Nature Communications (publishedVersion, cc-by)
- PubMed Central (publishedVersion, cc-by)
- PubMed (publishedVersion)
- Digital Commons@Becker (Washington University School of Medicine) (submittedVersion, cc-by)
- RePEc: Research Papers in Economics (submittedVersion)
- DOAJ (DOAJ: Directory of Open Access Journals) (submittedVersion)
- DOAJ (DOAJ: Directory of Open Access Journals) (submittedVersion, cc-by-sa)
- Funders
- Scottish Rite Charitable Foundation of Canada (15110)
- U.S. Department of Defense (PD170089)
- Topics
- Life Sciences › Biochemistry, Genetics and Molecular Biology › Molecular Biology › Epigenetics and DNA Methylation
- Life Sciences › Neuroscience › Cellular and Molecular Neuroscience › Alzheimer's disease research and treatments
- Health Sciences › Medicine › Psychiatry and Mental health › Dementia and Cognitive Impairment Research
- Keywords
- Alzheimer's disease, prefrontal cortex neurons, BACE1, amyloid plaques, neurofibrillary tangles, cognitive decline, cell cycle re-entry, apoptosis, fine mapping
- MeSH terms
- Aged, Aged, 80 and over, Alzheimer Disease, Enhancer Elements, Genetic, Female, Humans, Male, Middle Aged, Neurons, Cohort Studies, Cell Adhesion Molecules, Up-Regulation, Aspartic Acid Endopeptidases, Prefrontal Cortex, CpG Islands, DNA Methylation, Epigenesis, Genetic, Amyloid Precursor Protein Secretases, Cognitive Dysfunction
About these checks
Registry, retraction, Cites and statistics results are computed, not judged, with one exception: a printed reference that no index lists is read once by a model before it counts as a citation error. Claims are extracted by a model and kept only when their quote appears verbatim in the text; each cited source is then checked, with a model’s help, for whether it says what the claim relies on. Those verdicts can be wrong — read the claim’s quote and the cited source before relying on one.
Statistics and arithmetic are recomputed, not judged.
Confidence bands are shown only for fields calibrated on our annotated test set. None is calibrated yet, so no band is shown.
What counts as a claim ›How we measure confidence ›How we check this ›
Are you an author, or do you see a problem with this page? Request a review
