

The DOI matches its Crossref record; 57 of the 57 references it cites were found in a registry or an index.
Amplification of future energy demand growth due to climate change
Open accessAbstract
Future energy demand is likely to increase due to climate change, but the magnitude depends on many interacting sources of uncertainty. We combine econometrically estimated responses of energy use to income, hot and cold days with future projections of spatial population and national income under five socioeconomic scenarios and temperature increases around 2050 for two emission scenarios simulated by 21 Earth System Models (ESMs). Here we show that, across 210 realizations of socioeconomic and climate scenarios, vigorous (moderate) warming increases global climate-exposed energy demand before adaptation around 2050 by 25–58% (11–27%), on top of a factor 1.7–2.8 increase above present-day due to socioeconomic developments. We find broad agreement among ESMs that energy demand rises by more than 25% in the tropics and southern regions of the USA, Europe and China. Socioeconomic scenarios vary widely in the number of people in low-income countries exposed to increases in energy demand.
Overview
The claims and statistics of this paper haven’t been checked yet.
Run the check — free, no account needed. It reads the open-access text and checks the sources it cites.
Integrity signals
Registry
Cites
Statistics
Figures
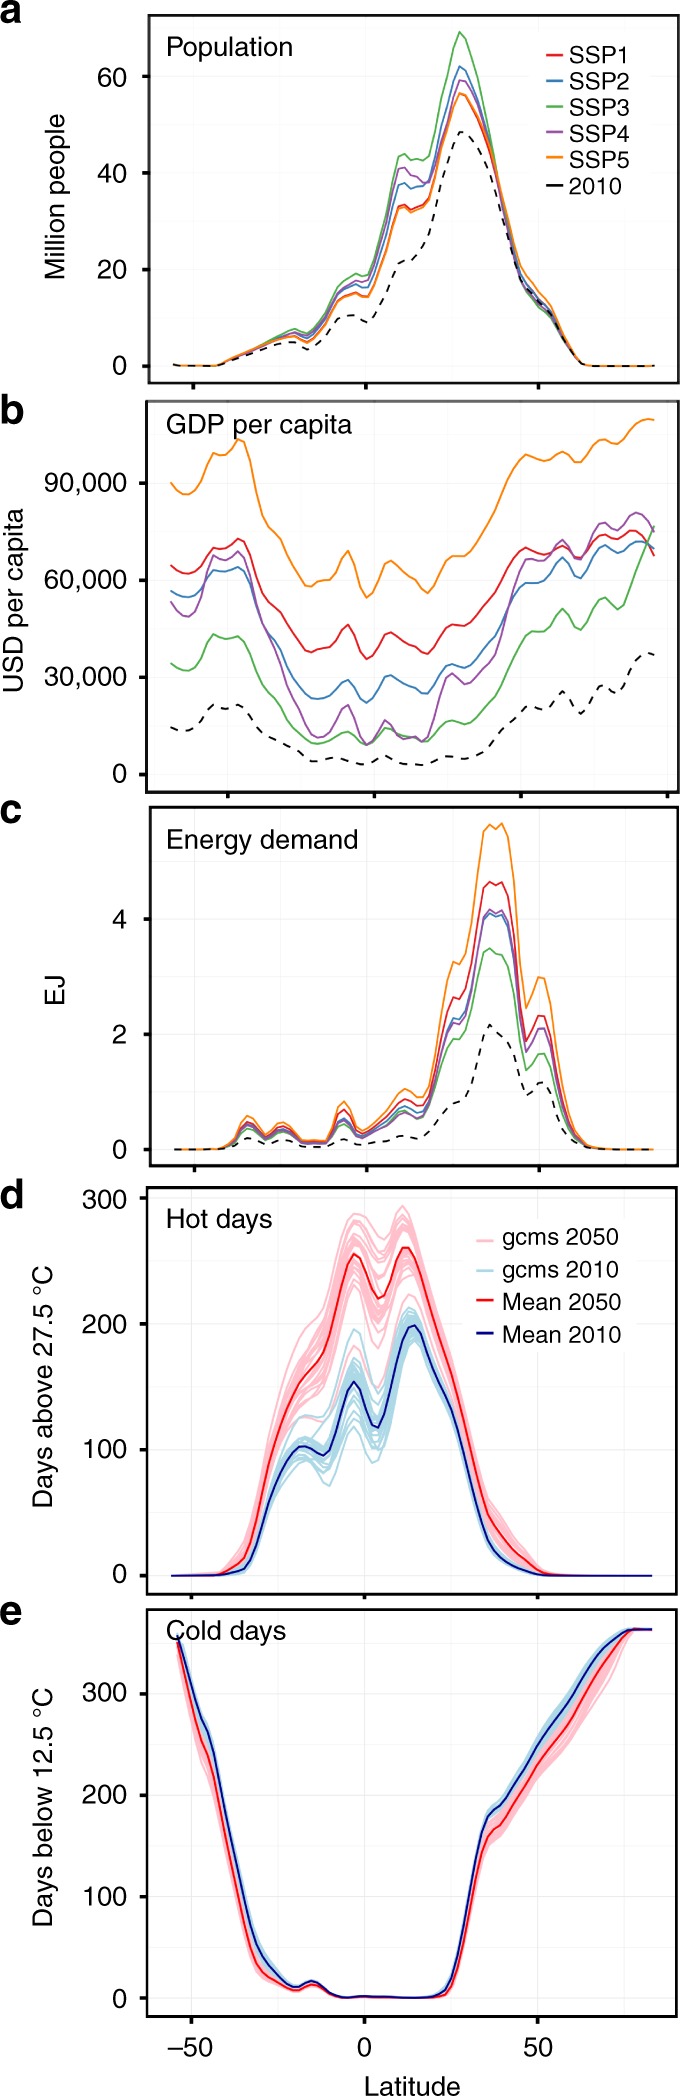
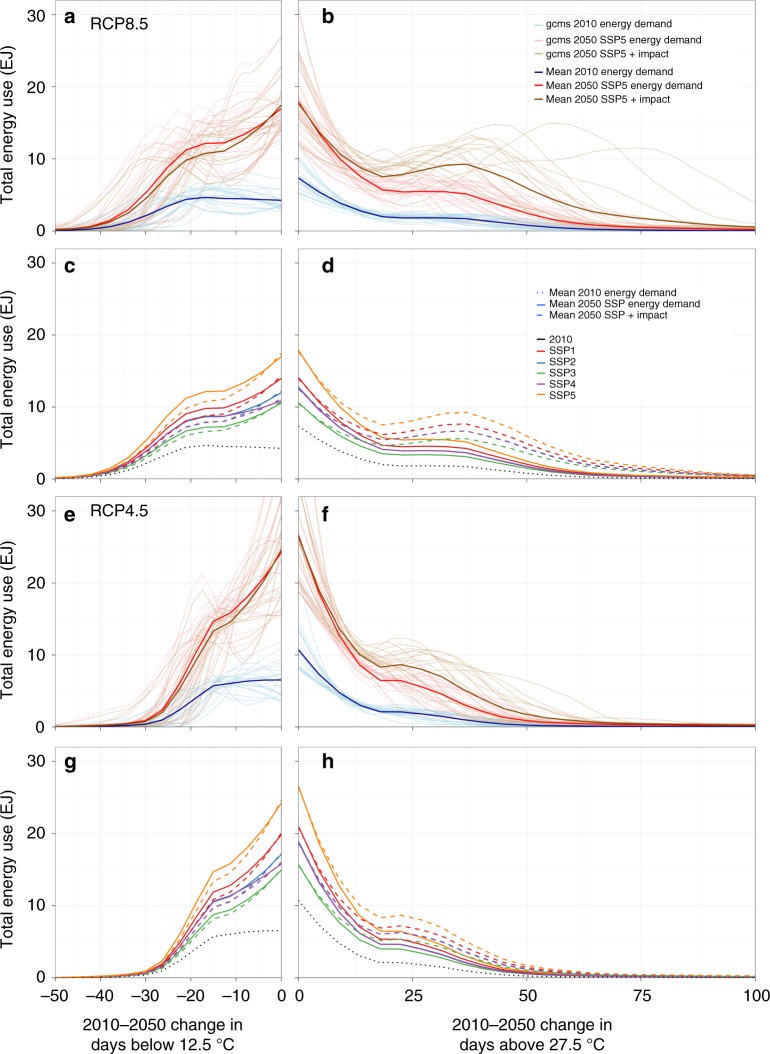
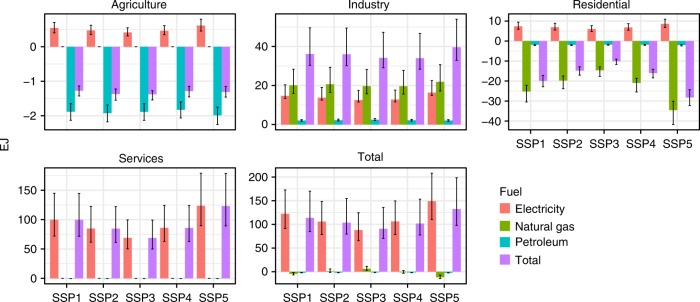
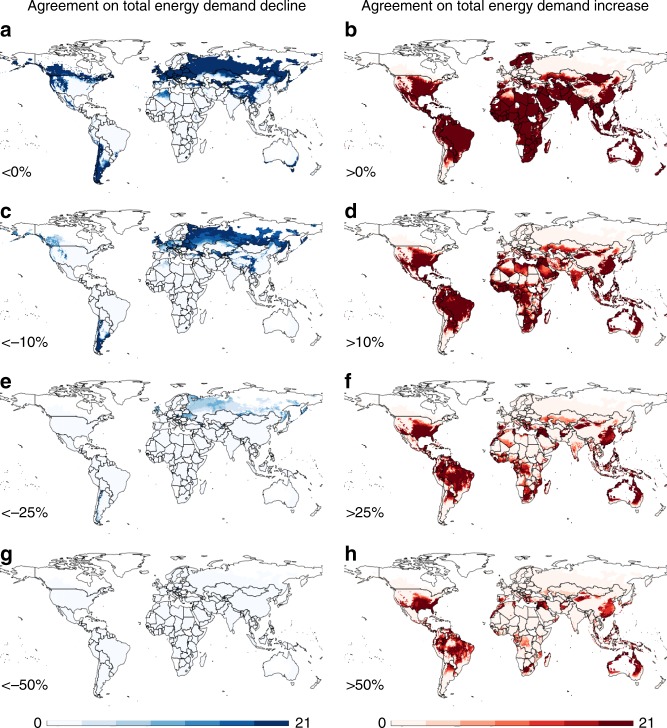
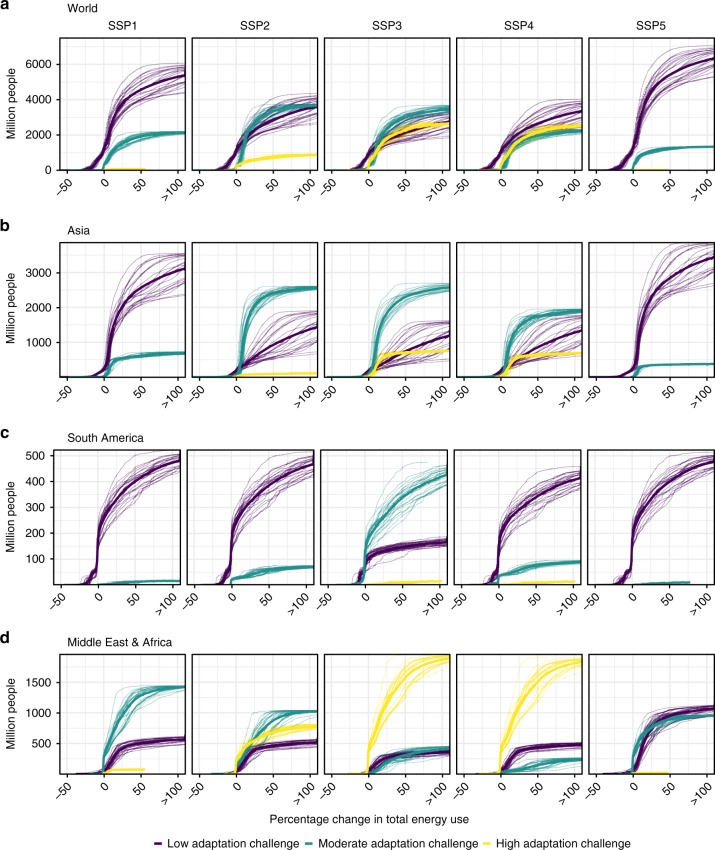
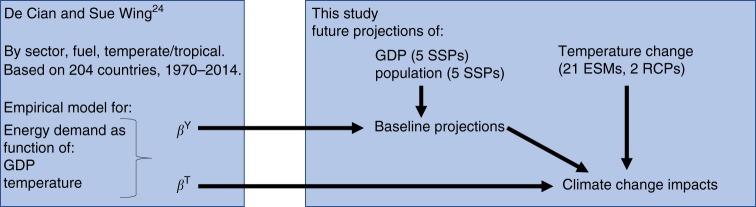
Verification
Claims the paper makes
The claims and statistics of this paper haven’t been checked yet.
Run the check — free, no account needed. It reads the open-access text and checks the sources it cites.
Claims other papers make about this one
Each is checked against this paper’s own text: does it say what the citing paper says it does?
In the citing paper
“Overall, global energy demand is projected to increase nearly 50% by 2050 compared to 2020, with developing nations driving almost half of this growth (Fig. 3) as rising populations and GDP improve living standards and energy access [26, 164].”
From Biofuel production: exploring renewable energy solutions for a greener future (2024) · cites this paper as [164]
Self-check
Percentages, sums and reported differences re-computed from the paper’s own numbers.
The self-check needs the paper’s full text.
Citations
Cites
An Overview of CMIP5 and the Experiment Design
Taylor, K. E., Stouffer, R. J., & Meehl, G. A. (2012) · Bulletin of the American Meteorological Society · doi:10.1175/bams-d-11-00094.1 · Cited by 14,052
The representative concentration pathways: an overview
van Vuuren, D. P., Edmonds, J., Kainuma, M., Riahi, K., Thomson, A., Hibbard, K., Hurtt, G. C., Kram, T., Krey, V., Lamarque, J.-F., et al. (2011) · Climatic Change · doi:10.1007/s10584-011-0148-z · Cited by 7,741
Riahi, K., van Vuuren, D. P., Kriegler, E., Edmonds, J., O’Neill, B. C., Fujimori, S., Bauer, N., Calvin, K., Dellink, R., Fricko, O., et al. (2017) · Global Environmental Change · doi:10.1016/j.gloenvcha.2016.05.009 · Cited by 6,607
O’Neill, B. C., Kriegler, E., Ebi, K. L., Kemp-Benedict, E., Riahi, K., Rothman, D. S., van Ruijven, B. J., van Vuuren, D. P., Birkmann, J., Kok, K., et al. (2017) · Global Environmental Change · doi:10.1016/j.gloenvcha.2015.01.004 · Cited by 3,359
Global non-linear effect of temperature on economic production
Burke, M., Hsiang, S. M., & Miguel, E. (2015) · Nature · doi:10.1038/nature15725 · Cited by 2,913
RCP 8.5—A scenario of comparatively high greenhouse gas emissions
Riahi, K., Rao, S., Krey, V., Cho, C., Chirkov, V., Fischer, G., Kindermann, G., Nakicenovic, N., & Rafaj, P. (2011) · Climatic Change · doi:10.1007/s10584-011-0149-y · Cited by 2,791
A new scenario framework for climate change research: the concept of shared socioeconomic pathways
O’Neill, B. C., Kriegler, E., Riahi, K., Ebi, K. L., Hallegatte, S., Carter, T. R., Mathur, R., & van Vuuren, D. P. (2014) · Climatic Change · doi:10.1007/s10584-013-0905-2 · Cited by 2,716
What Do We Learn from the Weather? The New Climate-Economy Literature
Dell, M., Jones, B. F., & Olken, B. A. (2014) · Journal of Economic Literature · doi:10.1257/jel.52.3.740 · Cited by 2,300
Modeling of end-use energy consumption in the residential sector: A review of modeling techniques
Swan, L. G., & Ugursal, V. I. (2009) · Renewable and Sustainable Energy Reviews · doi:10.1016/j.rser.2008.09.033 · Cited by 2,084
RCP4.5: a pathway for stabilization of radiative forcing by 2100
Thomson, A. M., Calvin, K. V., Smith, S. J., Kyle, G. P., Volke, A., Patel, P., Delgado-Arias, S., Bond-Lamberty, B., Wise, M. A., Clarke, L. E., et al. (2011) · Climatic Change · doi:10.1007/s10584-011-0151-4 · Cited by 1,631
Research works printed but not linked: 3
- van Benthem, A. A. Energy Leapfrogging. J. Assoc. Environ. Resour. Econ. 2, 93–132 (2015).
- Kc, S. & Lutz, W. The human core of the shared socioeconomic pathways: population scenarios by age, sex and level of education for all countries to 2100. Glob. Environ. Change 42, 181–192 (2017). · DOI · Paper page
- Dellink, R., Chateau, J., Lanzi, E. & Magné, B. Long-term economic growth projections in the Shared Socioeconomic Pathways. Glob. Environ. Change 42, 200–214 (2017). · DOI · Paper page
Cited by
Sorted by citations
Items 301–400 of 654
Quantifying the global climate feedback from energy-based adaptation
Abajian, A., Carleton, T. A., Meng, K. C., & Deschênes, O. (2025) · Nature Communications · doi:10.1038/s41467-025-59201-7 · Cited by 9
Montoya, O. D., Trujillo, E. R., & Hernández, J. C. (2022) · Electronics · doi:10.3390/electronics11060961 · Cited by 9
Temporal Understanding of the Water–Energy Nexus: A Literature Review
Fontenelle, A. L., Nilsson, E., Hidalgo, I. G., Uvo, C. B., & Peyerl, D. (2022) · Energies · doi:10.3390/en15082851 · Cited by 9
Can climate change attention predict energy stock returns?
Jia, S., Liu, Y., & Jin, J. (2023) · Environmental Science and Pollution Research · doi:10.1007/s11356-023-28731-2 · Cited by 9
Zheng, X., Xie, L., Lee, K., Fu, D., & Wu, J. (2023) · iEnergy · doi:10.23919/ien.2023.0014 · Cited by 9
How climate change may shift power demand in Japan: Insights from data-driven analysis
Gurriaran, L., Tanaka, K., Takahashi, K., & Ciais, P. (2022) · Journal of Environmental Management · doi:10.1016/j.jenvman.2023.118799 · Cited by 9
Bouteska, A., Seranto, M. L., Hájek, P., & Abedin, M. Z. (2023) · Annals of Operations Research · doi:10.1007/s10479-023-05722-7 · Cited by 9
Assessment of climate damage in China based on integrated assessment framework
Liu, J., Shi, X.-Z., Yang, L., Liu, C.-Y., Wang, J., Zhu, R.-M., Shi, X., & Liu, Q.-F. (2024) · Advances in Climate Change Research · doi:10.1016/j.accre.2024.01.012 · Cited by 9
Experimental investigation of a thermal response behavior of d-mannitol as phase change material
Agrawal, A., Ashagre, T. B., & Rakshit, D. (2023) · International Communications in Heat and Mass Transfer · doi:10.1016/j.icheatmasstransfer.2023.106804 · Cited by 8
Hossain, A., Gopika, T., Anil, A., Bijimol, B. I., Meera, M. S., Jana, P. P., Sameera, S. F., Soldatov, A. V., & Shibli, S. M. A. (2024) · International Journal of Hydrogen Energy · doi:10.1016/j.ijhydene.2024.07.173 · Cited by 8
Du, M., Guo, P., Zio, E., & Zhao, J. (2025) · Reliability Engineering & System Safety · doi:10.1016/j.ress.2025.111058 · Cited by 8
Hdidar, M., Chaari, M., Haddar, N., Megdiche, M., & Arous, M. (2025) · Ionics · doi:10.1007/s11581-025-06303-3 · Cited by 8
Gaidhani, A., Min, G., Xu, W. Z., Briens, L. A., & Charpentier, P. A. (2025) · Polymer Engineering and Science · doi:10.1002/pen.27283 · Cited by 8
Yadav, A., Kumar, A., & Giripunje, S. M. (2025) · Micro and Nanostructures · doi:10.1016/j.micrna.2025.208267 · Cited by 8
Wang, Q., Li, H., Su, H., Yang, L., & Diao, M. (2026) · Sustainable Cities and Society · doi:10.1016/j.scs.2026.107223 · Cited by 8
Implications of overshoot for climate mitigation strategies
Tavoni, M., Bauer, N., Drouet, L., Fujimori, S., Paltsev, S., Pirani, A., Riahi, K., Rogelj, J., Schaeffer, R., van Vuuren, D. P., et al. (2026) · Nature Climate Change · doi:10.1038/s41558-026-02563-7 · Cited by 8
Industrial fisheries have reversed the carbon sequestration by tuna carcasses into emissions
Mouillot, D., Derminon, S., Mariani, G., Senina, I. N., Fromentin, J., Lehodey, P., & Troussellier, M. (2023) · Global Change Biology · doi:10.1111/gcb.16823 · Cited by 10
Walsh, M., Tan, J. Z. Y., Nagarajan, S., Macgregor, K., Andrésen, J. M., Maroto‐Valer, M. M., & Pitchaimuthu, S. (2023) · Sustainable Energy & Fuels · doi:10.1039/d3se01445b · Cited by 8
Tao, Q., Naveau, M., Tantet, A., Badosa, J., & Drobinski, P. (2023) · Climate Services · doi:10.1016/j.cliser.2023.100426 · Cited by 8
Photosynthesis and hydrogen energy for sustainability: harnessing the sun for a greener future
Kossalbayev, B. D., YILMAZ, G., Özcan, H. G., SOYKAN, G., YALCIN, S., & Allakhverdiev, S. I. (2024) · Photosynthetica · doi:10.32615/ps.2024.013 · Cited by 8
Filahi, H., Omrani, H., Claudel, S., & Drobinski, P. (2024) · Climate Services · doi:10.1016/j.cliser.2024.100469 · Cited by 8
Inspiring Sustainability in Undergraduate Engineering Programs
Griesinger, T. M., Reid, K., Knight, D. B., Katz, A., & Somers, J. (2024) · Sustainability · doi:10.3390/su16125026 · Cited by 8
AlShafeey, M., & Rashdan, O. (2024) · Energy and AI · doi:10.1016/j.egyai.2024.100417 · Cited by 8
Assessing property value impacts near utility-scale solar in the Midwestern United States
Hao, S., & Michaud, G. (2024) · Solar Compass · doi:10.1016/j.solcom.2024.100090 · Cited by 8
Mi, Z., Cheng, C.-H., & Ma, H. (2020) · Advances in Climate Change Research · doi:10.1016/j.accre.2020.06.005 · Cited by 8
Aktij, S. A., Firouzjaei, M. D., Pilevar, M., Asad, A., Rahimpour, A., Ellıott, M., Soares, J. B. P., & Sadrzadeh, M. (2024) · Green Chemistry · doi:10.1039/d4gc03963g · Cited by 7
Wei, Y., Wu, D., Ronsse, F., & Ghysels, S. (2025) · Journal of Analytical and Applied Pyrolysis · doi:10.1016/j.jaap.2025.106981 · Cited by 7
Battini, F., Menapace, A., Stradiotti, G., Zanfei, A., Nicolosi, F. F., Torre, D. D., Renzi, M., Pernigotto, G., Ravazzolo, F., Righetti, M., et al. (2025) · Smart Energy · doi:10.1016/j.segy.2025.100180 · Cited by 7
Liang, J., & Wu, D. (2025) · Energy Economics · doi:10.1016/j.eneco.2025.108677 · Cited by 7
Gogiyev, T., Condon, S. K., Cherubini, F., & Watanabe, M. D. B. (2025) · Energy Reports · doi:10.1016/j.egyr.2025.06.044 · Cited by 7
Investigation of Electrochemical Properties of Nano-Structured NdFeO3 Orthoferrite
Chougala, N., Patil, A. S., Hegde, B. G., Patake, V. D., Manjunatha, T., Kulkarni, S., & Matteppanavar, S. (2025) · Journal of Electronic Materials · doi:10.1007/s11664-025-12385-6 · Cited by 7
Martin, M., & Sovacool, B. K. (2025) · Applied Energy · doi:10.1016/j.apenergy.2025.126852 · Cited by 7
Khan, Y., Yousafzai, H., & Xiang-dong, L. (2025) · SN Business & Economics · doi:10.1007/s43546-025-00935-3 · Cited by 7
Ali, B. M., Zhang, H., Wang, L., Yu, Z., He, C., Zhang, T., Jiang, K., Liu, W., Wang, J., Zhu, L., et al. (2025) · Fuel · doi:10.1016/j.fuel.2025.137255 · Cited by 7
Sustainable cooling in the tropics with mixed-mode ventilation and thermal adaptation
Lei, Y., Zhan, S., & Chong, A. (2025) · Building and Environment · doi:10.1016/j.buildenv.2025.113339 · Cited by 12
Soaring residential energy consumption due to rising heat indexes in the eastern Arabian Peninsula
Hzami, A., Heggy, E., Kumar, K., Juaidi, A., Al-Ansari, A., & Abu-Rayash, A. (2026) · Results in Engineering · doi:10.1016/j.rineng.2026.109165 · Cited by 7
Farooq, A., & Wu, X. S. (2022) · Energy Strategy Reviews · doi:10.1016/j.esr.2022.101000 · Cited by 7
Eker, S., Mastrucci, A., Pachauri, S., & van Ruijven, B. J. (2023) · One Earth · doi:10.1016/j.oneear.2023.03.011 · Cited by 7
Global air quality and climate change
Hadei, M., & Yousefian, F. (2024) · Elsevier eBooks · doi:10.1016/b978-0-443-23816-1.00008-2 · Cited by 7
Indirect economic benefits of energy consumption changes under China's carbon neutrality goal
Huang, C.-F., Guo, J., Zhang, Z., Li, N., Zhu, A., Liu, Y., Chen, X., & Sun, B. (2025) · Energy · doi:10.1016/j.energy.2025.134692 · Cited by 8
The Exergy Investigation of a Mechanical Vapor Compression Chiller for Cooling Using R410a
Perera, U. A., Takata, N., Miyazaki, T., Higashi, Y., & Thu, K. (2021) · Evergreen · doi:10.5109/4372281 · Cited by 7
Yang, K., Chen, N., Guo, X., Zhang, R., Sheng, X., Ge, H., Zhu, Z., Yang, H., & Lü, H. (2023) · Molecules · doi:10.3390/molecules28134918 · Cited by 7
Sun, T., Zanocco, C. M., Flora, J. A., Johnson, S., Soto, H. J., & Rajagopal, R. (2023) · Energy and Buildings · doi:10.1016/j.enbuild.2023.113301 · Cited by 7
Arcasi, A., Mastrullo, R., Mauro, A. W., Napoli, G., Pantaleo, A. M., & Tariello, F. (2023) · Journal of Physics Conference Series · doi:10.1088/1742-6596/2648/1/012011 · Cited by 7
Modeling maladaptation in the inequality–environment nexus
Antoci, A., Russu, P., & Ticci, E. (2020) · Journal of Economic Interaction and Coordination · doi:10.1007/s11403-020-00301-6 · Cited by 8
On the rules of life and Kleiber's law: the macroscopic relationship between materials and energy
Leiva, B., & Schramski, J. R. (2022) · Heliyon · doi:10.1016/j.heliyon.2022.e09647 · Cited by 6
Najafli, E., Ratso, S., Foroozan, A., Noor, N., Higgins, D. C., & Kruusenberg, I. (2024) · Energy & Fuels · doi:10.1021/acs.energyfuels.4c02407 · Cited by 6
Can extremely high-temperature weather forecast oil prices?
Zha, D., Zhang, S., & Cao, Y. (2025) · Frontiers of Engineering Management · doi:10.1007/s42524-025-4075-5 · Cited by 6
Atmospheric water as alternative and universal resources: From the energy perspective
Ma, R., Han, J., Alrowais, R., Zhou, J., & Li, R. (2025) · Nano Energy · doi:10.1016/j.nanoen.2025.111012 · Cited by 6
Mango, L., Mapolisa, A., Mudzonga, C., Makarichi, L., Okpara, K., Techato, K., Muzvidzani, M., & Magenge, M. M. (2025) · African Journal of Climate Change and Resource Sustainability · doi:10.37284/ajccrs.4.1.2914 · Cited by 6
Resilience of energy market under geopolitical risks: What’s the policy implications?
Cao, J., Zhu, Y., Yin, Z., Li, J., & Chang, C. (2025) · Economic Analysis and Policy · doi:10.1016/j.eap.2025.05.014 · Cited by 6
Saini, R., Wadhwa, P., Pathak, M., Singh, P. B., Jain, K., Srivastava, A., Dhaka, R. K., Kumar, S., & Singh, M. K. (2025) · Diamond and Related Materials · doi:10.1016/j.diamond.2025.112455 · Cited by 6
Defect-engineered CoMn layered double hydroxides for enhanced oxygen evolution reaction
Wang, L., Li, Y., Wang, J., Hu, C., Liu, X., Ma, Y., Sun, J., Bandaru, S., Pei, W., & Zhang, X. (2025) · Journal of Alloys and Compounds · doi:10.1016/j.jallcom.2025.184117 · Cited by 6
Identifying key uncertainties in energy transitions with a Puerto Rico case study
Khayambashi, K., Clarens, A. F., Shobe, W., & Alemazkoor, N. (2025) · Nature Communications · doi:10.1038/s41467-025-64143-1 · Cited by 6
Evaluating simplified building models' sensitivity to climate data for energy retrofit optimization
Dadras, Y., Mostafazadeh, F., Kavgic, M., & Ghobadi, M. (2025) · Building and Environment · doi:10.1016/j.buildenv.2025.113885 · Cited by 6
Pezalla, S., & Obringer, R. (2023) · Socio-Economic Planning Sciences · doi:10.1016/j.seps.2023.101664 · Cited by 6
Renewable Energy Policies in the USA: A Comparative Study of Selected States
Fache, A., Bhat, M. G., & Troxler, T. G. (2025) · Energies · doi:10.3390/en18030607 · Cited by 6
Technological advances in prospecting sites for pumped hydro energy storage
Akpoti, K., Obahoundjé, S., Mortey, E. M., Diawuo, F. A., Antwi, E. O., Gyamfi, S., Domfeh, M. K., & Kabo-bah, A. T. (2022) · Elsevier eBooks · doi:10.1016/b978-0-12-818853-8.00009-1 · Cited by 6
Analysis of rice husk concrete samples observed by scanning electron microscopy
Doumongue, B., Limam, K., Ayite, Y. M. X. D., Mastouri, H., Bahi, H., & Bouazouli, A. E. (2022) · Materials Today Proceedings · doi:10.1016/j.matpr.2022.10.029 · Cited by 6
Analysis of Smart Meter Data With Machine Learning for Implications Targeted Towards Residents
Emrouznejad, A., Panchmatia, V., Gholami, R., Rigsbee, C. M., & Kartal, H. B. (2023) · International Journal of Urban Planning and Smart Cities · doi:10.4018/ijupsc.318337 · Cited by 6
Hafezi, R., Alipour, M., Wood, D. A., & Moghaddam, N. B. (2021) · Elsevier eBooks · doi:10.1016/b978-0-12-824495-1.00002-4 · Cited by 6
Review: The Energy Implications of Averting Climate Change Catastrophe
Moriarty, P., & Honnery, D. (2023) · Energies · doi:10.3390/en16176178 · Cited by 6
16S rRNA Analysis of Electrogenic Bacterial Communities from Soil Microbial Fuel Cells
Rumora, A., Hopkins, L., Yim, K., Baykus, M. F., Martinez, L., & Jiménez, L. (2024) · Applied Microbiology · doi:10.3390/applmicrobiol4020062 · Cited by 5
Zhu, G.-Q., Xu, H., Zhang, J., Xie, G., Fang, Z. Y., & Xu, L. (2025) · Chemical Engineering Journal · doi:10.1016/j.cej.2025.167020 · Cited by 5
Wu, Y., & Zhong, L. (2025) · Energy Conversion and Management · doi:10.1016/j.enconman.2025.120432 · Cited by 5
Effects of P‐doping on CO 2 ‐Derived Porous Carbon for the Cathode of Lithium‐Sulfur Batteries
Park, C. Y., Lee, D., Yun, W. C., Kim, H., Eom, H. H., & Lee, J. W. (2025) · Chemistry - An Asian Journal · doi:10.1002/asia.202500840 · Cited by 5
Perovskite-driven solar reforming of PET waste and concurrent hydrogen production
Zhu, Y., Li, Y., Zhang, A., Chang, Q., Liu, F., Chen, Z., Wang, X., Zhang, R. Q., & Daoud, W. A. (2025) · Nano Energy · doi:10.1016/j.nanoen.2025.111517 · Cited by 5
Niu, Y., Ma, Y., Xiao, X., Zhao, J., Xu, C., & Nadiya, A. (2025) · Applied Thermal Engineering · doi:10.1016/j.applthermaleng.2025.128726 · Cited by 5
Temperature extremes across elevation gradients: evidence from two German mountain observatories
Ionita-Scholz, M., Cai, D., & Nagavciuc, V. (2025) · Frontiers in Earth Science · doi:10.3389/feart.2025.1701260 · Cited by 5
Zhang, G., Li, J., Li, J., Liu, S., Lv, L., Liang, J., Tao, X., & Zou, W. (2026) · Biomass and Bioenergy · doi:10.1016/j.biombioe.2026.109320 · Cited by 5
Ankush, Yadav, K. K., Guchhait, S. K., Wadhwa, R., & Jha, M. (2021) · Materials Research Bulletin · doi:10.1016/j.materresbull.2021.111275 · Cited by 5
The Goldilocks Zone in Cooling Demand: What Can We Do Better?
Kumar, R., Maia‐Silva, D., & Nateghi, R. (2022) · Earth s Future · doi:10.1029/2021ef002476 · Cited by 5
Yi, R., & Chen, A. (2024) · Environment Development and Sustainability · doi:10.1007/s10668-024-05271-4 · Cited by 5
US urban land-use reform: a strategy for energy sufficiency
Subin, Z. M., Lombardi, J., Muralidharan, R., Korn, J., Malik, J., Pullen, T., Wei, M., & Hong, T. (2024) · Buildings and Cities · doi:10.5334/bc.434 · Cited by 5
Cascos, V. A., Chivite-Lacaba, M., Prado‐Gonjal, J., Fernández-Díaz, M. T., & Alonso, J. A. (2025) · Acta Materialia · doi:10.1016/j.actamat.2025.121262 · Cited by 5
Dora, B. K., Bhat, S. S., Mitra, A., Ernst, D., Dai, J., Das, S., & Raphael Fonteneau, D. (2026) · Electrical Engineering · doi:10.1007/s00202-026-03561-w · Cited by 5
Odou, O. D. T., Ursula, H. H., Adamou, R., Godjo, T. G., & Moussa, M. S. (2023) · Environmental Research Letters · doi:10.1088/1748-9326/acbc8f · Cited by 5
Zhang, L., Xu, Y., Zhao, Y., Meng, C., Wang, C.-G., & Lin, Y. (2023) · International Journal of Climatology · doi:10.1002/joc.8146 · Cited by 5
Peplinski, M., Kalmus, P. M., & Sanders, K. T. (2023) · Environmental Research Letters · doi:10.1088/1748-9326/acfb96 · Cited by 5
Al-Adwani, A., Karnib, A., El‐Sadek, A., & Al-Zubari, W. K. (2024) · Computational Water Energy and Environmental Engineering · doi:10.4236/cweee.2024.131003 · Cited by 5
Gurriaran, L., Goude, Y., Tanaka, K., Zhu, B., Deng, Z., Song, X., & Ciais, P. (2024) · Geoscientific model development · doi:10.5194/gmd-17-2663-2024 · Cited by 5
Offshoring insect farms may jeopardize Europe's food sovereignty
Ryba, R. (2024) · Global Sustainability · doi:10.1017/sus.2024.35 · Cited by 5
Arshed, N., Iqbal, M., Hanif, U., & Munir, M. (2025) · Energy and Buildings · doi:10.1016/j.enbuild.2025.116114 · Cited by 5
Differential sensitivities of electricity consumption to global warming across regions of Argentina
Propato, T., de Abelleyra, D., Semmartin, M., & Verón, S. R. (2021) · Climatic Change · doi:10.1007/s10584-021-03129-6 · Cited by 5
The LTER-Greece Environmental Observatory Network: Design and Initial Achievements
Skoulikidis, N., Nikolaidis, Ν. P., Panagopoulos, A., Fischer‐Kowalski, M., Zogaris, S., Petridis, P., Pisinaras, V., Efstathiou, D., Petanidou, T., Maneas, G., et al. (2021) · Water · doi:10.3390/w13212971 · Cited by 5
Water: How Secure Are We Under Climate Change?
Singh, V. P., & Su, Q. (2022) · Water science and technology library · doi:10.1007/978-3-031-13467-8_1 · Cited by 5
Income-dependent expansion of electricity demand for climate change adaptation in Brazil
Colelli, F. P., & Mistry, M. (2022) · Energy and Climate Change · doi:10.1016/j.egycc.2022.100071 · Cited by 5
Investigating energy literacy and its structural model for citizens of Mashhad
Sayarkhalaj, H., & Khesal, M. F. (2022) · Heliyon · doi:10.1016/j.heliyon.2022.e11449 · Cited by 5
Chapter 5 : Energy Supply, Delivery, and Demand. Fifth National Climate Assessment
Zamuda, C. D., Bilello, D. E., Carmack, J., Davis, X. J., Efroymson, R. A., Goff, K. M., Hong, T., Karimjee, A., Loughlin, D. H., Upchurch, S., et al. (2023) · doi:10.7930/nca5.2023.ch5 · Cited by 6
Gallium Nitride in Heterogeneous Photocatalysis: Fundamental Insights and Emerging Trends
Kang, H., & LI, C. ‐. (2025) · ChemistryEurope · doi:10.1002/ceur.202500112 · Cited by 4
Climate-driven compounding effects and historical trends in renewable electricity droughts in Europe
Meng, Y., Schmidt, J., Jakob Zscheischler, A., & Bevacqua, E. (2025) · Applied Energy · doi:10.1016/j.apenergy.2025.126623 · Cited by 4
Hu, R., Zhou, K., & Lu, X. (2026) · Energy · doi:10.1016/j.energy.2026.140171 · Cited by 4
Faurooqi, M. Z. U. R., Mahmood, K., Tariq, M., Hussain, A., Asif, H. M., Khan, M. A., Hanif, M., Mughal, M. A., Arshad, A., & Rafiq, M. (2026) · Nanoscale · doi:10.1039/d5nr04911c · Cited by 4
Conceptual design and analysis of a tricycle mounted solar-powered photovoltaic cold room system
Akinsade, A., Eiche, J. F., Akinola, A. O., & Famodun, M. O. (2024) · Nigerian Journal of Technology · doi:10.4314/njt.v42i4.5 · Cited by 4
Remizov, A., & Memon, S. A. (2024) · Journal of Building Engineering · doi:10.1016/j.jobe.2024.111351 · Cited by 4
Singh, A. P., Chopra, M., & Choudhury, N. (2024) · Chemical Physics · doi:10.1016/j.chemphys.2024.112547 · Cited by 4
Moment estimation for uncertain moving average model with application to CO 2 emission
Liu, Z., & Liu, Y. (2025) · Communications in Statistics - Simulation and Computation · doi:10.1080/03610918.2024.2447448 · Cited by 4
Mendizabal, S. (2025) · Cybergeo · doi:10.4000/14khq · Cited by 4
Zhao, S., Zhou, D., Ding, H., & Wang, Q. (2025) · Energy Economics · doi:10.1016/j.eneco.2025.108943 · Cited by 4
Safari, A., Ismael, D., Safari, M., & Freihaut, J. D. (2025) · Energy Reports · doi:10.1016/j.egyr.2025.12.017 · Cited by 4
Metadata
- Authors
- van Ruijven, B. J., De Cian, E., & Sue Wing, I.
- ORCID
- van Ruijven, Bas J.
- Venue
- Nature Communications
- Published
- 2019-06-24
- Volume
- 10
- Issue
- 1
- Pages
- 2762-2762
- ISSN
- 2041-1723 (ISSN-L)
- PMC
- PMC6591298
- OpenAlex
- W2950990727
- Cited by
- 648
- References
- 57
- Citations by year
- 2026: 114 · 2025: 134 · 2024: 112 · 2023: 103 · 2022: 77 · 2021: 66 · 2020: 40 · 2019: 2
- FWCI
- 57.56
- Type
- journal article
- Language
- en
- Open access
- gold
- doi.org
- Locations
- Nature Communications (publishedVersion, cc-by)
- PubMed Central (publishedVersion, cc-by)
- PubMed (publishedVersion)
- IIASA PURE (International Institute of Applied Systems Analysis) (acceptedVersion)
- OSTI OAI (U.S. Department of Energy Office of Scientific and Technical Information) (submittedVersion)
- RePEc: Research Papers in Economics (submittedVersion)
- DOAJ (DOAJ: Directory of Open Access Journals) (submittedVersion)
- DOAJ (DOAJ: Directory of Open Access Journals) (submittedVersion, cc-by-sa)
- ARCA (Università Ca' Foscari Venezia) (submittedVersion)
- Funders
- National Science Foundation (1240507, 1243095)
- U.S. Department of Energy (DESC0016162, DESC0005171)
- National Aeronautics and Space Administration
- National Center for Atmospheric Research
- European Commission (HORIZON2020)
- Office of Science (DESC0005171, DESC0016162)
- Ames Research Center
- Biological and Environmental Research (DE-SC0016162, DE-SC0005171)
- H2020 European Research Council (756194)
- Topics
- Social Sciences › Economics, Econometrics and Finance › Economics and Econometrics › Climate Change Policy and Economics
- Physical Sciences › Energy › Renewable Energy, Sustainability and the Environment › Energy, Environment, and Transportation Policies
- Social Sciences › Economics, Econometrics and Finance › Economics and Econometrics › Energy, Environment, Economic Growth
- Keywords
- energy demand, climate change, temperature rise, socio-economic scenarios, Earth system models, population projections, income growth, climate change adaptation, low-income countries
About these checks
Registry, retraction, Cites and statistics results are computed, not judged, with one exception: a printed reference that no index lists is read once by a model before it counts as a citation error. Claims are extracted by a model and kept only when their quote appears verbatim in the text; each cited source is then checked, with a model’s help, for whether it says what the claim relies on. Those verdicts can be wrong — read the claim’s quote and the cited source before relying on one.
Statistics and arithmetic are recomputed, not judged.
Confidence bands are shown only for fields calibrated on our annotated test set. None is calibrated yet, so no band is shown.
What counts as a claim ›How we measure confidence ›How we check this ›
Are you an author, or do you see a problem with this page? Request a review
