

The DOI matches its Crossref record; 63 of the 63 references it cites were found in a registry or an index.
P2X7 receptor induces mitochondrial failure in monocytes and compromises NLRP3 inflammasome activation during sepsis
Open accessAbstract
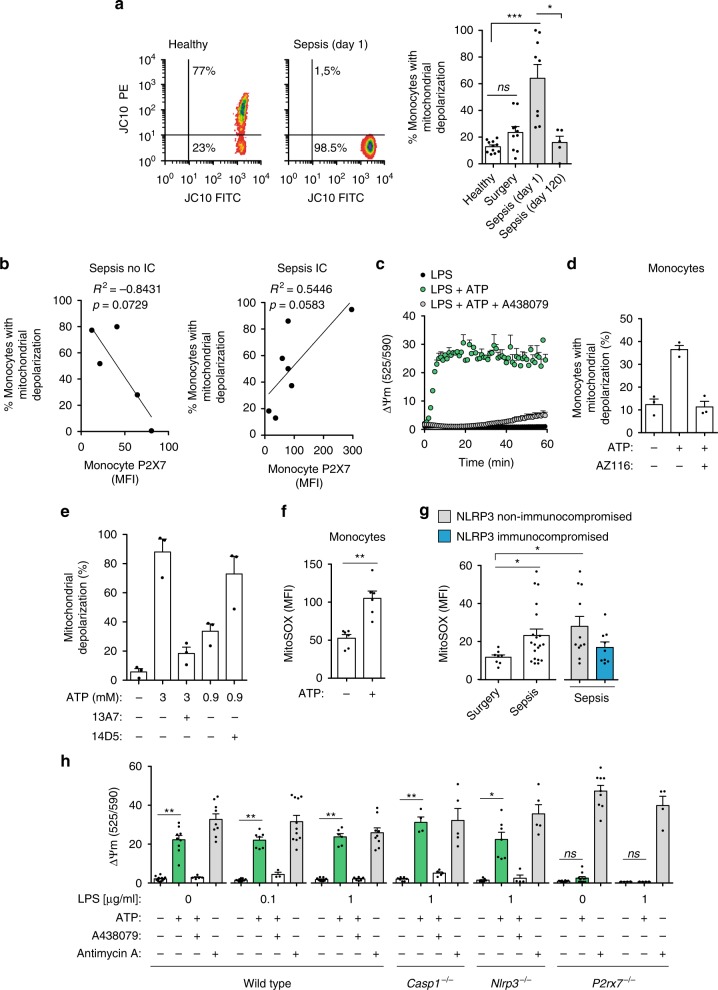
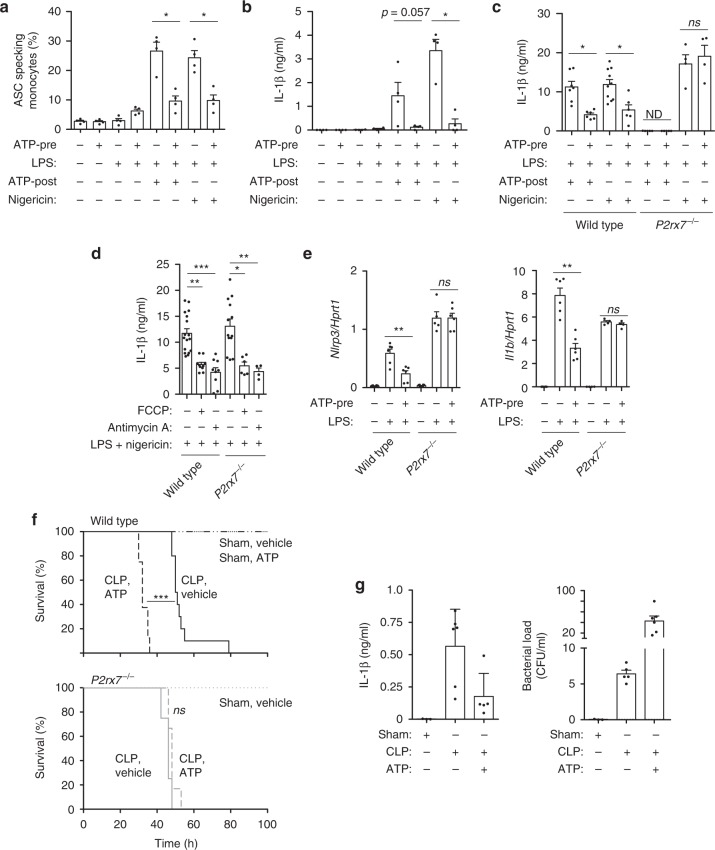
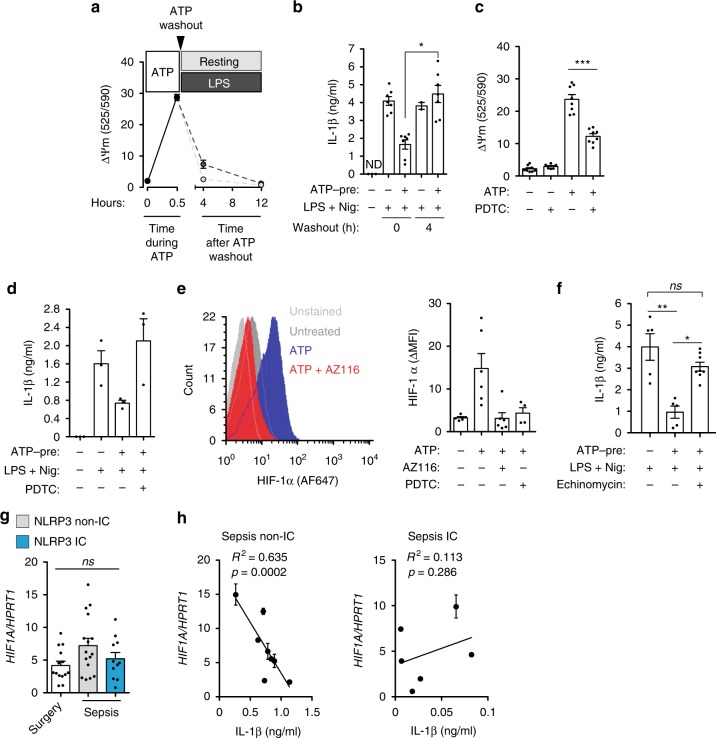
Sepsis is characterized by a systemic inflammatory response followed by immunosuppression of the host. Metabolic defects and mitochondrial failure are common in immunocompromised patients with sepsis. The NLRP3 inflammasome is important for establishing an inflammatory response after activation by the purinergic P2X7 receptor. Here, we study a cohort of individuals with intra-abdominal origin sepsis and show that patient monocytes have impaired NLRP3 activation by the P2X7 receptor. Furthermore, most sepsis-related deaths are among patients whose NLRP3 activation is profoundly altered. In monocytes from sepsis patients, the P2X7 receptor is associated with mitochondrial dysfunction. Furthermore, activation of the P2X7 receptor results in mitochondrial damage, which in turn inhibits NLRP3 activation by HIF-1α. We show that mortality increases in a mouse model of sepsis when the P2X7 receptor is activated in vivo. These data reveal a molecular mechanism initiated by the P2X7 receptor that contributes to NLRP3 impairment during infection.
Overview
The claims and statistics of this paper haven’t been checked yet.
Run the check — free, no account needed. It reads the open-access text and checks the sources it cites.
Integrity signals
Registry
Cites
Statistics
Figures
Verification
Claims the paper makes
The claims and statistics of this paper haven’t been checked yet.
Run the check — free, no account needed. It reads the open-access text and checks the sources it cites.
Claims other papers make about this one
Each is checked against this paper’s own text: does it say what the citing paper says it does?
The cited source says what the claim attributes to it.
In the citing paper
“It was already reported its capacity to modulate acute and chronic infection [81, 82], inflammatory diseases [82], sepsis [83, 84], neuropathic pain [85], and T-cell activation [86].”
From Hyperactivation of P2X7 receptors as a culprit of COVID-19 neuropathology (2021) · cites this paper as [83]
Self-check
Percentages, sums and reported differences re-computed from the paper’s own numbers.
The self-check needs the paper’s full text.
Citations
Cites
Origin and physiological roles of inflammation
Medzhitov, R. (2008) · Nature · doi:10.1038/nature07201 · Cited by 6,618
2001 SCCM/ESICM/ACCP/ATS/SIS International Sepsis Definitions Conference
Levy, M. M., Fink, M. P., Marshall, J. C., Abraham, E. H., Angus, D. C., Cook, D., Cohen, J., Opal, S. M., Vincent, J., & Ramsay, G. (2003) · Critical Care Medicine · doi:10.1097/01.ccm.0000050454.01978.3b · Cited by 5,976
Schroder, K., & Tschopp, J. (2010) · Cell · doi:10.1016/j.cell.2010.01.040 · Cited by 5,475
Severe Sepsis and Septic Shock
Angus, D. C., & van der Poll, T. (2013) · New England Journal of Medicine · doi:10.1056/nejmra1208623 · Cited by 4,119
Activation and regulation of the inflammasomes
Latz, E., Xiao, T. S., & Stutz, A. (2013) · Nature Reviews Immunology · doi:10.1038/nri3452 · Cited by 2,884
Sepsis-induced immunosuppression: from cellular dysfunctions to immunotherapy
Hotchkiss, R. S., Monneret, G., & Payen, D. (2013) · Nature Reviews Immunology · doi:10.1038/nri3552 · Cited by 2,772
Mills, E. L., Kelly, B., Logan, A., Costa, A. S. H., Varma, M., Bryant, C. E., Tourlomousis, P., Däbritz, J. H. M., Gottlieb, E., Latorre, I., et al. (2016) · Cell · doi:10.1016/j.cell.2016.08.064 · Cited by 2,291
mTOR- and HIF-1α–mediated aerobic glycolysis as metabolic basis for trained immunity
Cheng, S.-C., Quintin, J., Cramer, R. A., Shepardson, K. M., Saeed, S., Kumar, V., Giamarellos-Bourboulis, E. J., Martens, J. H. A., Rao, N. A., Aghajanirefah, A., et al. (2014) · Science · doi:10.1126/science.1250684 · Cited by 2,224
Immunosuppression in Patients Who Die of Sepsis and Multiple Organ Failure
Boomer, J. S., To, K. B., Chang, K. C., Takasu, O., Osborne, D. F., Walton, A. H., Bricker, T. L., Jarman, S. D., Kreisel, D., Krupnick, A. S., et al. (2011) · JAMA · doi:10.1001/jama.2011.1829 · Cited by 1,839
Endotoxin tolerance: new mechanisms, molecules and clinical significance
Biswas, S. K., & Lopez-Collazo, E. (2009) · Trends in Immunology · doi:10.1016/j.it.2009.07.009 · Cited by 1,318
Cited by
Sorted by citations
Items 101–200 of 233
Cardiolipin inhibits the non-canonical inflammasome by preventing LPS binding to caspase-4/11
Pizzuto, M., Monteleone, M. M., Burgener, S. S., Began, J., Kurera, M., Chia, J. R., Frampton, E., Crawford, J., Oliveira, M., Kenney, K. M., et al. (2025) · The EMBO Journal · doi:10.1038/s44318-025-00507-z · Cited by 20
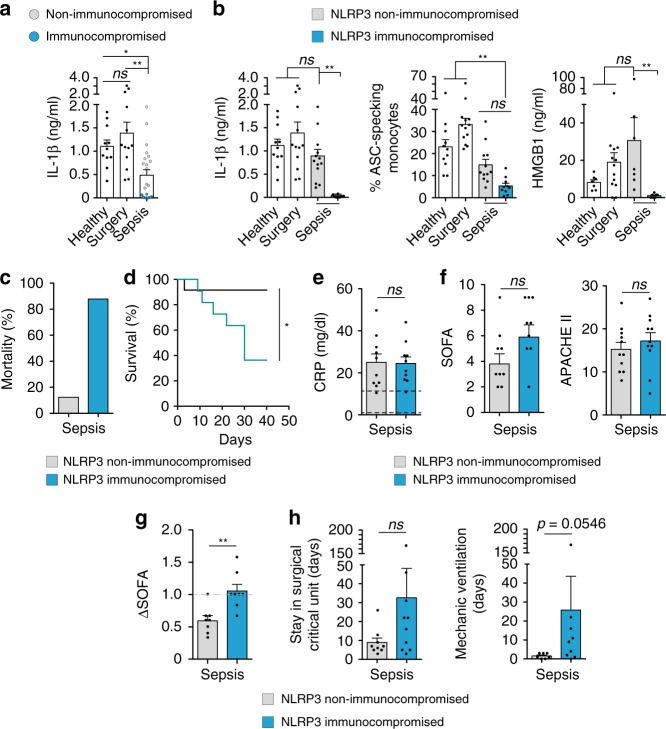
“Indeed, immunosuppressed patients who cannot mount a canonical NLRP3/CASP1 in fl amma-some response have the highest sepsis mortality rates (Martínez-García et al, 2019).”
Exploring the prognostic and diagnostic value of lactylation-related genes in sepsis
Li, S., Shen, Y., Wang, C., Yang, J., Chen, M., & Hu, Y. (2024) · Scientific Reports · doi:10.1038/s41598-024-74040-0 · Cited by 18
“Metabolic enzymes in the glycolytic pathway are lactylated to suppress excessive glycolytic responses, ensuring metabolic homeostasis in the body 26 .”
BackgroundBlocking P2X purinoceptor 4 signalling alleviates cigarette smoke induced pulmonary inflammation
Schneider, S. O., Merfort, I., Idzko, M., & Zech, A. (2022) · Respiratory Research · doi:10.1186/s12931-022-02072-z · Cited by 17
Physiologic roles of P2 receptors in leukocytes
Alberto, A. V. P., Ferreira, N. C. D. S., Bonavita, A. G. C., Nihei, O. K., de Farias, F. P., Bisaggio, R. D. C., Albuquerque, C., Savino, W., Coutinho‐Silva, R., Persechini, P. M., et al. (2022) · Journal of Leukocyte Biology · doi:10.1002/jlb.2ru0421-226rr · Cited by 19
More than a drug target: Purinergic signalling as a source for diagnostic tools in epilepsy
Wong, Z. W., & Engel, T. (2022) · Neuropharmacology · doi:10.1016/j.neuropharm.2022.109303 · Cited by 17
Duan, F., Li, L., Liu, S., Tao, J., Gu, Y., Li, H., Yi, X., Gong, J., You, D., Feng, Z., et al. (2024) · International Immunopharmacology · doi:10.1016/j.intimp.2024.112186 · Cited by 17
ATPergic signaling disruption in human sepsis as a potential source of biomarkers for clinical use
Leite, R. O., de Souza, P. O., Haas, C. B., da Silveira, F., Mohr, K., Bertoni, A. P. S., Soares, M. S. P., Azambuja, J. H., Prá, M. D., da Cruz, L. L. P., et al. (2023) · Clinical and Experimental Medicine · doi:10.1007/s10238-023-01045-w · Cited by 16
“Authors suggest that therapies aiming to decrease extracellular ATP or to block the P2X7R may improve survival rates among septic patients [31].”
BackgroundTNAP and P2X7R: New Plasma Biomarkers for Alzheimer’s Disease
Aivar, P., Bianchi, C., Lauro, C. D., Soria-Tobar, L., Alvarez‐Castelao, B., Calero, M., Medina, M., & Dı́az-Hernández, M. (2023) · International Journal of Molecular Sciences · doi:10.3390/ijms241310897 · Cited by 16
Unraveling the Triad: Hypoxia, Oxidative Stress and Inflammation in Neurodegenerative Disorders
Dakal, T. C., Choudhary, K., Tiwari, I., Yadav, V., Maurya, P. K., & Sharma, N. K. (2024) · Neuroscience · doi:10.1016/j.neuroscience.2024.06.021 · Cited by 16
Targeting Purinergic Signaling in the Dynamics of Disease Progression in Sepsis
Leite-Aguiar, R., Alves, V. S., Savio, L. E. B., & Coutinho‐Silva, R. (2021) · Frontiers in Pharmacology · doi:10.3389/fphar.2020.626484 · Cited by 16
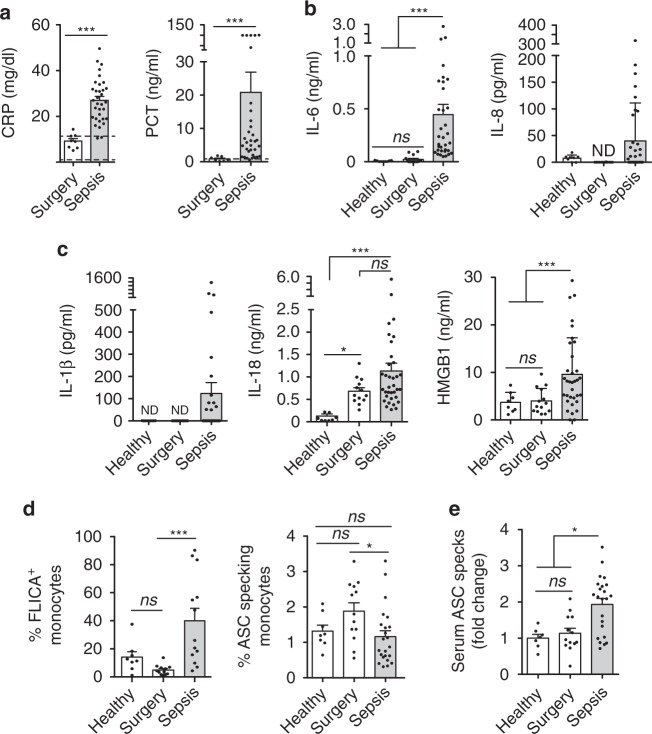
“Moreover, cytokine levels (e.g., those of IL-1β, IL-18), the alarmin HMGB1, and ASC aggregates are increased in the serum of these patients (Martínez-García et al., 2019).”
BackgroundLi, L.-H., Chen, T.-L., Chiu, H., Hsu, C.-H., Wang, C.-C., Tai, T.-T., Ju, T., Chen, G. T. Y., Chernikov, O. V., Tsai, W., et al. (2020) · Frontiers in Immunology · doi:10.3389/fimmu.2020.01115 · Cited by 16
“These results suggest that the P2X7 receptor is a potential therapeutic target for pathogen infection (47, 48) or inflammatory diseases (49).”
BackgroundHua, N., Kong, L., Fan, L., Bai, Y., Zhou, Y., Zhang, Y., Zhao, Q. D., Lu, X., Yang, H., Li, H., et al. (2025) · Advanced Science · doi:10.1002/advs.202500457 · Cited by 16
Tian, T., Heine, M., Evangelakos, I., Jaeckstein, M. Y., Schaltenberg, N., Stähler, T., Koch‐Nolte, F., Kumari, M., & Heeren, J. (2020) · Purinergic Signalling · doi:10.1007/s11302-020-09738-7 · Cited by 14
Self-citationYu, J., Zhu, G., Qiu, C., Lai, J.-M., Shen, Y., Jin, S., Yang, X., Zhu, H., Hu, B., Ye, X., et al. (2024) · Life Sciences · doi:10.1016/j.lfs.2024.122604 · Cited by 14
Regulation of inflammation and immunity in sepsis by E3 ligases
Shao, S., Zhou, D., Feng, J., Liu, Y., Baturuhu, Yin, H., & Zhan, D. (2023) · Frontiers in Endocrinology · doi:10.3389/fendo.2023.1124334 · Cited by 13
Lou, Y., Miao, J., Li, F., Ding, J., & Wang, L. (2021) · Toxicology Letters · doi:10.1016/j.toxlet.2021.04.014 · Cited by 13
Wen, E., Tian, Y., Fang, M., Zhang, Y., Zhao, H., Wang, Z., Zhang, L., & Li, X. (2025) · ACS Applied Materials & Interfaces · doi:10.1021/acsami.4c21010 · Cited by 12
Lu, J., Yang, B., Liao, J., Chen, B., Lu, M.-X., Zhang, W., Zeng, J., Cheng, H., & Liu, Z. (2022) · Brain Sciences · doi:10.3390/brainsci12060706 · Cited by 12
“Furthermore, P2X7R activated caspase–1 and caspase–3–mediated release of inflammatory cytokines through the NLR family pyrin domain-containing 3 signaling pathway [42,43].”
BackgroundSawai, Y., Suzuki, Y., Asagiri, M., Hida, S., Kondo, R., Zamponi, G. W., Giles, W. R., Imaizumi, Y., & Yamamura, H. (2023) · American Journal of Physiology-Cell Physiology · doi:10.1152/ajpcell.00303.2023 · Cited by 13
Beltrán-García, J., Casabó-Vallés, G., Osca-Verdegal, R., Navarrete-López, P., Rodríguez, M. D. P., Nácher-Sendra, E., Ferrando-Sánchez, C., García-López, E., Pallardó, F. V., Carbonell, N., et al. (2024) · Frontiers in Immunology · doi:10.3389/fimmu.2023.1333705 · Cited by 12
Kristóf, Z., Baranyi, M., Tod, P., Mut-Arbona, P., Demeter, K., Bitter, I., & Sperlágh, B. (2022) · The International Journal of Neuropsychopharmacology · doi:10.1093/ijnp/pyac026 · Cited by 13
Üstündağ, H. (2026) · Purinergic Signalling · doi:10.1007/s11302-026-10140-y · Cited by 12
Guggemos, J., Fuller, S. J., Skarratt, K. K., Mayer, B., & Schneider, E. M. (2024) · Frontiers in Immunology · doi:10.3389/fimmu.2024.1352789 · Cited by 11
Wang, Z., Fang, X., Yu, Z., Huo, X., Liu, H., Du, Y., & Shi, B. (2025) · Journal of Animal Science and Biotechnology/Journal of animal science and biotechnology · doi:10.1186/s40104-025-01262-1 · Cited by 13
“Our study also revealed that NLRP3 activation by HIF-1α was inhibited in the presence of mitochondrial damage [100].”
Erbaş, E., Celep, N. A., Tekiner, D., Genç, A., & Gedikli, S. (2023) · Journal of Biochemical and Molecular Toxicology · doi:10.1002/jbt.23536 · Cited by 10
Breaking the barriers: Overcoming cancer resistance by targeting the NLRP3 inflammasome
Far, N. P., Varnousafaderani, M. H., Faghihkhorasani, F., Etemad, S., Abdulwahid, A. R. R., Bakhtiarinia, N., Mousaei, A., Dortaj, E., Karimi, S., Ebrahimi, N., et al. (2024) · British Journal of Pharmacology · doi:10.1111/bph.17352 · Cited by 11
“Conversely, triggering inflammasome activation through targeting membrane proteins like TMEM176B and P2X7 has been shown to potentiate the response to PD-1 blockade in certain contexts (Martínez-García et al., 2019; Segovia et al., 2019).”
Macrophage S1PR2 Drives Sepsis-induced Immunosuppression by Exacerbating Mitochondrial Fragmentation
Yu, X., Hu, X., Wang, D., Cui, P., Zeng, M., Li, M., Gong, C., Huang, D., Wang, Y., Zhang, K., et al. (2024) · American Journal of Respiratory Cell and Molecular Biology · doi:10.1165/rcmb.2024-0161oc · Cited by 10
Kögel, A., Fikenzer, S., Uhlmann, L., Opitz, L., Kneuer, J. M., Hæusler, K. G., Endres, M., Kratzsch, J., Schwarz, V., Werner, C., et al. (2022) · Frontiers in Physiology · doi:10.3389/fphys.2022.866938 · Cited by 11
Qian, Y., Zhao, N., Wang, M., Zou, Z., & Xie, K. (2024) · Biochemical Pharmacology · doi:10.1016/j.bcp.2024.116369 · Cited by 9
The P2X7 receptor in depression: Novel insights and therapeutic implications
Zhong, Y.-T., Pi, C., Zuo, Y., Yan, W., Li, W., Jiang, Y., Lei, T., Zheng, W., Jiang, J., Yang, Y., et al. (2025) · Neurobiology of Disease · doi:10.1016/j.nbd.2025.107011 · Cited by 11
Nakashima, Y., Gotoh, K., Mizuguchi, S., Setoyama, D., Takata, Y., Kanno, T., & Kang, D. (2021) · Frontiers in Nutrition · doi:10.3389/fnut.2021.763492 · Cited by 10
Wei, Y., Li, W., Yang, S., Zhong, P., Bi, Y., & Tang, Y. (2022) · Bioengineered · doi:10.1080/21655979.2022.2073126 · Cited by 9
Retractedp120-Catenin suppresses NLRP3 inflammasome activation in macrophages
Kanmani, P., Elkafas, H., Ghazal, M., Minshall, R. D., & Hu, G. (2023) · American Journal of Physiology-Lung Cellular and Molecular Physiology · doi:10.1152/ajplung.00328.2022 · Cited by 9
Centrality of Myeloid-Lineage Phagocytes in Particle-Triggered Inflammation and Autoimmunity
Favor, O. K., Pestka, J. J., Bates, M. A., & Lee, K. S. S. (2021) · Frontiers in Toxicology · doi:10.3389/ftox.2021.777768 · Cited by 9
Ye, T., Yang, J., Liu, Z., Yu, Y., Zhang, C., Guo, Y., Yu, F., Zhou, Y., Song, Z., Shi, J., et al. (2024) · International Immunopharmacology · doi:10.1016/j.intimp.2024.111536 · Cited by 8
Garcia, J., Steenvoorden, T. S., Bemelman, F. J., Hilhorst, M. L., Tammaro, A., & Vogt, L. (2025) · Journal of the American Society of Nephrology · doi:10.1681/asn.0000000711 · Cited by 8
Xu, C., Zhu, R., Dai, Q., Xu, G., & Zhang, G. (2025) · Life Sciences · doi:10.1016/j.lfs.2025.123812 · Cited by 8
Szabó, D., Otrokocsi, L., & Sperlágh, B. (2025) · Journal of Neuroinflammation · doi:10.1186/s12974-025-03509-0 · Cited by 10
“Blocking the P2X7 seems to be protective against sepsis pathogenesis [159, 162], and organ dysfunction [163–165].”
Adamik, B., Ambrożek-Latecka, M., Dragan, B., Jeznach, A., Śmiechowicz, J., Goździk, W., & Skirecki, T. (2022) · Shock · doi:10.1097/shk.0000000000001923 · Cited by 8
“As inflammasomes reportedly play a role in the susceptibility to secondary infections (28, 29), we tested for a relation between inflammasome activation markers and co-infections or the development of secondary infections; however, there”
BackgroundMansi, Garg, V., & Sahu, B. D. (2023) · Food Bioscience · doi:10.1016/j.fbio.2023.103444 · Cited by 21
Hanidziar, D., & Robson, S. C. (2021) · American Journal of Physiology-Gastrointestinal and Liver Physiology · doi:10.1152/ajpgi.00406.2020 · Cited by 8
Zou, H.-X., Qiu, B., Zhang, Z., Hu, T., Wan, L., Liu, J., Huang, H., & Lai, S. (2022) · Frontiers in Cardiovascular Medicine · doi:10.3389/fcvm.2022.923066 · Cited by 8
“It is well known that immune and inflammatory responses play a critical role in the pathogenesis of SCM, and the inappropriate regulation of the immune system is inextricably linked to the pathological development of SCM (86, 87).”
BackgroundYang, Y., He, Y., Zhang, Z., Zhang, Y. L., Gao, R., Du, K., Wu, Y., Wu, J., Wei, M., & Liu, M. (2026) · Signal Transduction and Targeted Therapy · doi:10.1038/s41392-026-02757-7 · Cited by 7
ASC nanobodies to counteract the consequences of inflammasome activation
Adriouch, S., & Pelegrín, P. (2022) · EMBO Molecular Medicine · doi:10.15252/emmm.202216087 · Cited by 6
Self-citationMechanical ventilation preserves diaphragm mitochondrial function in a rat sepsis model
Eyenga, P., Roussel, D., Rey, B., Ndille, P., Teulier, L., Eyenga, F., Romestaing, C., Morel, J., Gueguen‐Chaignon, V., & Sheu, S. S. (2021) · Intensive Care Medicine Experimental · doi:10.1186/s40635-021-00384-w · Cited by 7
Jing, D., Liu, J., Qin, D., Lin, J., Li, T., Li, Y., & Duan, M. (2024) · Renal Failure · doi:10.1080/0886022x.2024.2368090 · Cited by 6
“It has been reported that due to infection caused by sepsis, proinflammatory cytokines are rapidly produced and released, which can cause a systemic inflammatory response [37,38].”
BackgroundTian, Y., Li, S., Lu, Q., Zhong, W., Hu, Y., Ling, J., Chen, M., & Hu, Y. (2023) · Shock · doi:10.1097/shk.0000000000002115 · Cited by 6
“Sepsis, a life-threatening organ dysfunction caused by a dysregulated host response to infection, is a biphasic disease whose progression has been shown to be closely related to systemic inflammatory responses and host immunosuppression (1,2).”
BackgroundMethodPurinergic P2X7 receptor expression increases in leukocytes from intra-abdominal septic patients
Martínez‐Banaclocha, H., García-Palenciano, C., Martínez-Alarcón, L., Amores-Iniesta, J., Martín‐Sánchez, F., Ercole, G. A., González-Lisorge, A., Fernández-Pacheco, J., Martínez-Gil, P., Padilla-Rodríguez, J., et al. (2023) · Frontiers in Immunology · doi:10.3389/fimmu.2023.1297249 · Cited by 6
Self-citationLiu, J., Hui, Q., Lu, X., Li, W., Li, N., Chen, Y., & Zhang, Q. (2024) · BMJ Paediatrics Open · doi:10.1136/bmjpo-2023-002329 · Cited by 6
“Future studies may benefit from incorporating scoring systems or other clinical parameters to improve the identification of death from sepsis.”
BackgroundPissarek, M. (2020) · Pharmaceutics · doi:10.3390/pharmaceutics12100925 · Cited by 6
“In mouse models of sepsis with enhanced P2X7 receptor activity increased mortality associated with mitochondrial damage and inhibition of NLRP3 signaling has been shown, suggesting a disturbance of this pathway in such conditions [123].”
BackgroundCoudereau, R., Gossez, M., Py, B. F., Henry, T., Lukaszewicz, A., Monneret, G., & Venet, F. (2022) · Cells · doi:10.3390/cells11203306 · Cited by 6
“Conversely, altered NLRP3 inflammasome activation capacity called NLRP3 inflammasome exhaustion has been described in infectious diseases such as sepsis [6] or severe COVID19 [7] in association with deleterious outcomes.”
BackgroundRole of the regulation of mesenchymal stem cells on macrophages in sepsis
Xing, J., Wang, R., Cui, F.-F., Song, L.-L., Ma, Q.-L., & Xu, H.-Y. (2023) · International Journal of Immunopathology and Pharmacology · doi:10.1177/03946320221150722 · Cited by 8
Zhang, R., Di, C., Gao, H., Zhu, Y., Li, C., Zhu, Z., Wang, Q., Wang, J., Zhou, F., & Wang, S. (2023) · Frontiers in Cardiovascular Medicine · doi:10.3389/fcvm.2023.1018422 · Cited by 6
“When systemic hepcidin concentrations are significantly low, hepcidin produced by the myocardium acts as an autocrine or paracrine regulator of ferroportin and can protect tissues from ferroportin and extreme iron deficiency; however, this does not significantly affect systemic hepcidin (40).”
BackgroundEVALUATION OF COMPONENTS OF THE EXTRACELLULAR PURINERGIC SIGNALING SYSTEM IN HUMAN SEPSIS
Lovászi, M., Nemeth, Z. H., Keleştemur, T., Sánchez, I. V., Antonioli, L., Pacher, P., Wagener, G., & Haskó, G. (2023) · Shock · doi:10.1097/shk.0000000000002230 · Cited by 8
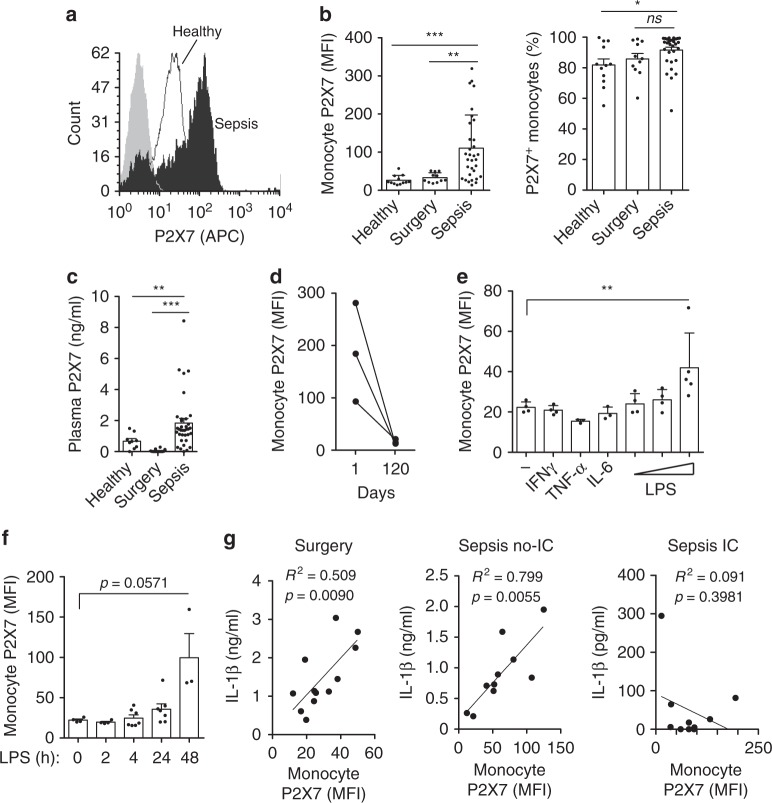
“However, in a study by another group, septic monocytes had increased P2X7 receptor expression (14).”
BackgroundResultSIGLEC5: An immune checkpoint ligand in sepsisPreprint
Lozano‐Rodríguez, R., Ortiz, J. A., Montalbán-Hernández, K. M., Ruiz‐Rodríguez, J. C., Ferrer, R., Martín‐Quirós, A., Maroun‐Eid, C., González‐López, J. J., Fàbrega, A., Terrón, V., et al. (2020) · medRxiv · doi:10.1101/2020.05.30.20117473 · Cited by 6
“We had previously reported the crucial role of HIF1α in the control of several key factors during sepsis, including the negative regulator of inflammation IRAK-M, the NLRP3 inflammasome activation and the IC ligand PD-L1 (10, 11, 28, 29).”
BackgroundInfluentialSelf-citationP2X7 receptor: A receptor closely linked with sepsis-associated encephalopathy
Fan, Z., Wang, K., Zhao, X., & Sun, X. (2024) · Open Life Sciences · doi:10.1515/biol-2022-0775 · Cited by 5
“Under in fl am-matory stimulation, the activation of P2X7R on the surface of microglial cells will lead to the activation of intracellular NF-κ B/NLRP3 signaling, and recruit and activate caspase-1 [65,66].”
BackgroundWei, Y., Wang, K., Zhang, Y., Duan, Y., Tian, Y., Yin, H., Fu, X., Ma, Z., Zhou, J., Yu, M., et al. (2023) · Frontiers in Pharmacology · doi:10.3389/fphar.2023.1138762 · Cited by 5
Characteristics and Risk Factors for Pediatric Sepsis
Zhu, Y., Liu, T.-L., Dai, Q., Liu, S.-F., Xiong, P., Huang, H., Yuan, Y., Zhang, T., & Chen, Y. (2024) · Current Medical Science · doi:10.1007/s11596-024-2870-6 · Cited by 4
Therapeutic targeting of inflammasome signaling by blocking interleukin-1
Coll, R. C. (2022) · Elsevier eBooks · doi:10.1016/b978-0-323-91802-2.00010-4 · Cited by 3
Guo, X., Shen, P., Shao, R., Hong, T., Liu, W., Shen, Y. X., Su, F., Wang, Q., & He, B. (2023) · Biomedical Materials · doi:10.1088/1748-605x/acef9a · Cited by 4
“Immunosuppression is a compensatory response to avoid excessive production of inflammatory factors [4].”
Gong, Z., Mao, W., Zhao, J., Ren, P., Yu, Z., Bai, Y., Wang, C., Liu, Y., Feng, S., & Hasi, S. (2024) · Journal of Innate Immunity · doi:10.1159/000541819 · Cited by 4
“Previous studies have shown that total inhibition of PRRs can be detrimental, as demonstrated by increased mortality in TLR2-and TLR4-de fi cient mice in response to Gram-negative or Gram-positive bacteria, respectively [40, 41].”
Zeng, W., Deng, Z., Li, H., Gao, S., & Ju, R. (2024) · Open Medicine · doi:10.1515/med-2024-1097 · Cited by 5
Sepsis-induced inflammasome impairment facilitates development of secondary A. baumannii pneumonia
Jeznach, A., Sidor, K., Bandyszewska, M., Grzanka, M., Popławski, P., Marszalik, A., Domagala-Kulawik, J. J., Stachowiak, R., Hoser, G., & Skirecki, T. (2025) · Emerging Microbes & Infections · doi:10.1080/22221751.2025.2492206 · Cited by 4
“This stays in line with a report on the altered inflammasome activity regulation in septic patients [27] .”
Xie, W., Wang, X., Cai, J., Bai, H., Shao, Y., Li, Z., Cai, L., Zhang, S., Li, J., Cui, W., et al. (2023) · Foods · doi:10.3390/foods12224068 · Cited by 4
Purinergic signaling in Stroke and Multiple Sclerosis: Prospects for therapies
Cisneros-Mejorado, A., Colom-Casasnovas, A., Pérez‐Samartín, A., & Matute, C. (2025) · Neuropharmacology · doi:10.1016/j.neuropharm.2025.110783 · Cited by 3
RAGE contributes to persistent sepsis-induced muscle and mitochondrial alterations
Romien, R., Pierre, A., Ducastel, S., Dubech, A., Lemaire, J., Grolaux, G., Frimat, M., Brassart, B., Bourel, C., Howsam, M., et al. (2025) · Scientific Reports · doi:10.1038/s41598-025-28645-8 · Cited by 3
Methodological guidelines for P2X receptor assays and data interpretation
Górecki, D. C., Adinolfi, E., Adriouch, S., Coutinho‐Silva, R., Engel, T., Gölöncsér, F., Haag, F., Illés, P., Jacobson, K. A., Koch‐Nolte, F., et al. (2026) · Cell Death and Disease · doi:10.1038/s41419-026-08730-0 · Cited by 3
“This protocol allows for a monocyte-speci fi c assessment of ATP-induced NLRP3 in fl ammasome formation, and this measure could be used as a standardised method to investigate the immunocompetence of myeloid cells in patients [111].”
Self-citationDifferential expression of plasma cytokines in sepsis patients and their clinical implications
Liu, H.-X., Wang, Y., & Yang, X. (2024) · World Journal of Clinical Cases · doi:10.12998/wjcc.v12.i25.5681 · Cited by 3
Biting the hand that feeds: Metabolic determinants of cell fate during infection
Fraschilla, I. R., & Evavold, C. L. (2022) · Frontiers in Immunology · doi:10.3389/fimmu.2022.923024 · Cited by 4
“Calcium (Ca) flux is a known determinant of mitochondrial ROS production (55).”
BackgroundZalpoor, H., Akbari, A., Nabi‐Afjadi, M., Norouzi, A., Seif, F., & Pornour, M. (2023) · Journal of Cellular Signaling · doi:10.33696/signaling.4.087 · Cited by 3
“In severe inflammation, its increased activation may decrease lymphocyte function by impairing mitochondrial function, as has been seen in monocytes in sepsis [26].”
BackgroundSimões, J. L. B., Braga, G. D. C., Eichler, S. W., da Silva, G. B., & Bagatini, M. D. (2024) · Purinergic Signalling · doi:10.1007/s11302-024-09998-7 · Cited by 4
“Finally, as a result of all this mechanism that occurs simultaneously, it culminates in neurodegeneration and neuronal death [83, 104].”
Identification of prognostic biomarkers of sepsis and construction of ceRNA regulatory networks
Chen, G., Zhang, W., Wang, C., Chen, M., Hu, Y., & Wang, Z. (2025) · Scientific Reports · doi:10.1038/s41598-024-78502-3 · Cited by 4
Repositioning linifanib as a potent anti-necroptosis agent for sepsisPreprint
Kai, Y., Li, M., Yu, L., & He, X. (2022) · bioRxiv (Cold Spring Harbor Laboratory) · doi:10.1101/2022.03.24.485557 · Cited by 3
Lu, Y., Meng, J., Yun, M., Hacker, M., Li, X., & Zhang, X. (2023) · EJNMMI Research · doi:10.1186/s13550-023-01035-9 · Cited by 2
“The circulating innate immune cells are recruited to the injured myocardium to help myocardial repair after MI [20].”
BackgroundBiomimetic siRNA therapeutics attenuate mitochondrial DNA damage and cytokine storm in sepsis
Jiang, S., Zhou, Y., Ge, C., Zhou, R., Ren, M., Yin, L., & Zhu, J. (2025) · Journal of Controlled Release · doi:10.1016/j.jconrel.2025.114545 · Cited by 2
Johari, T., & Chicco, D. (2026) · Discover Computing · doi:10.1007/s10791-026-09974-2 · Cited by 2
P2X receptors in immune cells: key regulators of inflammation and immune function
Adinolfi, E., Falzoni, S., Fortuna, F., Ricci, L., Ruo, L., Grignolo, M., Giuliani, A. L., & Pegoraro, A. (2026) · Neuropharmacology · doi:10.1016/j.neuropharm.2026.110976 · Cited by 2
Altered Ex Vivo NLRP3 Inflammasome Activation Is Associated with 28-Day Mortality in Septic Patients
Coudereau, R., Monneret, G., Lukaszewicz, A., Py, B. F., Argaud, L., Cour, M., Bidar, F., Gossez, M., & Venet, F. (2023) · Viruses · doi:10.3390/v15122419 · Cited by 2
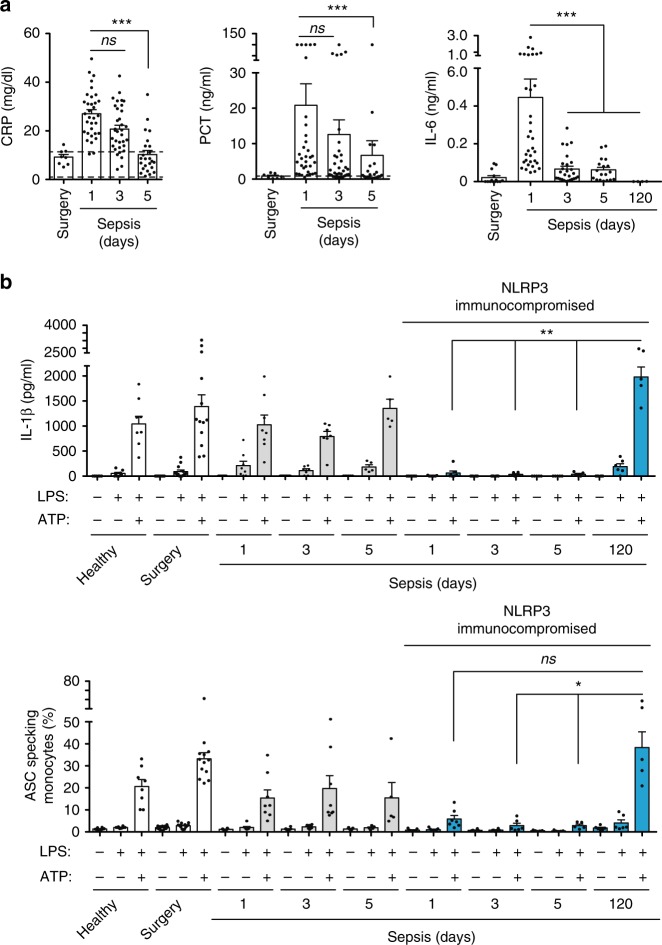
“This aligns with the “NLRP3 immunocompro-mised” proposed by Martinez-Garcia and colleagues who reported a decline in both IL-1 β production and the formation of ASC specks in septic patients [22].”
ResultExploring the role of pyroptosis and immune infiltration in sepsis based on bioinformatic analysis
Li, Z., Wang, Y., & Yu, X. (2024) · Immunobiology · doi:10.1016/j.imbio.2024.152826 · Cited by 2
Could P2X7 receptor be a potencial target in neonatal sepsis?
Fialho, S., Trieu‐Cuot, P., Ferreira, P., & Oliveira, L. (2024) · International Immunopharmacology · doi:10.1016/j.intimp.2024.112969 · Cited by 2
加奈子, 原., 堤, 理., 中西, 信., & Sakaue, H. (2020) · The Japanese Journal of SURGICAL METABOLISM and NUTRITION · doi:10.11638/jssmn.54.3_143 · Cited by 2
A rationale for targeting the P2X7 receptor in Coronavirus disease 19 (Covid-19)Preprint
Virgilio, F. D., Tang, Y., Sarti, A. C., & Rossato, M. (2020) · doi:10.22541/au.158757991.11121908 · Cited by 2
Quantitative assessment of mitochondrial membrane potential in macrophages in sepsis
Ahmad, A., Kanmani, P., & Hu, G. (2024) · Methods in cell biology · doi:10.1016/bs.mcb.2024.01.004 · Cited by 1
Kögel, A., Voßhage, N., Behzadi, A., Laufs, U., & Fikenzer, S. (2024) · Frontiers in Physiology · doi:10.3389/fphys.2024.1394340 · Cited by 1
Ulaş, N., Özkanlar, S., Yıldırım, S., Aydın, Ö., & Özkanlar, Y. (2025) · Current Issues in Molecular Biology · doi:10.3390/cimb47090770 · Cited by 1
“It has also been reported that LPS increases the expression of P2X7R, which is a strong activator of NLRP3 inflammasome, in lung tissue [16,40].”
Ma, X., Wang, J., Han, K. S., & Lu, J. (2025) · PLoS ONE · doi:10.1371/journal.pone.0336982 · Cited by 1
Targeting the purinergic P2X7 receptor in epilepsy: Cell types matter
Engel, T., Salari, V., Sun, M.-J., & Mitra, M. (2026) · Neuropharmacology · doi:10.1016/j.neuropharm.2026.110973 · Cited by 1
Zhang, N., Cai, C., Li, G., Zhang, X., Cui, M., Zhao, C., Zhu, H., Ren, S., & An, H. (2026) · Advanced Composites and Hybrid Materials · doi:10.1007/s42114-026-01844-1 · Cited by 1
Boldeanu, M. V., Boldeanu, L., & Siloşi, I. (2021) · Romanian Archives of Microbiology and Immunology · doi:10.54044/rami.2021.03.05 · Cited by 1
Hurtado‐Navarro, L., García-Palenciano, C., & Pelegrı́n, P. (2022) · Elsevier eBooks · doi:10.1016/b978-0-323-91802-2.00014-1 · Cited by 1
Self-citationLi, S., Chen, W., Zhang, Z., Yuan, L., Hu, Y., & Chen, M. (2024) · Open Life Sciences · doi:10.1515/biol-2022-0999 · Cited by 1
Cell-free fat extract protects septic lethality via restraining NLRP3 inflammasome activation.
Wu, D., Li, X., Wang, X., & Wang, D. (2022) · PubMed Central · Cited by 1
Integrated Bioinformatics Analysis Reveals APEX1 as a Potential Biomarker for Septic CardiomyopathyPreprint
Pu, J., Gao, F., & He, Y. (2023) · bioRxiv (Cold Spring Harbor Laboratory) · doi:10.1101/2023.01.03.522553 · Cited by 1
“Sepsis is a systemic inflammatory response syndrome caused by infection [22], and it is also one of the main causes of death in intensive care unit patients [23].”
BackgroundBai, Y., Liu, Y., & Jiang, S. (2021) · Journal of Biomaterials and Tissue Engineering · doi:10.1166/jbt.2021.2745
Guan, S., Ye, Z., Miao, H., Gong, X., Zhao, J., & Duan, S. (2023) · Research Square · doi:10.21203/rs.3.rs-2473958/v1
Systemic Oncosphere: Host Innate Immune System
Saw, P. E., & Song, E. (2023) · Springer eBooks · doi:10.1007/978-981-99-1183-7_19
Analysis of the Pathogenesis of Gram-Negative Bacterial Sepsis in Rats Under Nano-Body
Li, X., Wang, X., Liu, W., Li, W., & Li, M. (2023) · Journal of Biomedical Nanotechnology · doi:10.1166/jbn.2023.3653
Pizzuto, M., Monteleone, M. M., Burgener, S. S., Began, J., Kurera, M., Chia, J. R., Frampton, E., Crawford, J., de Oliveira, M. A. P., Kenney, K. M., et al. (2024) · bioRxiv (Cold Spring Harbor Laboratory) · doi:10.1101/2024.10.14.618051
Parikh, M., Soni, A., & Gandhi, T. R. (2025) · Elsevier eBooks · doi:10.1016/b978-0-443-22300-6.00019-x
Metadata
- Authors
- Martínez-García, J. J., Martínez-Banaclocha, H., Angosto-Bazarra, D., de Torre-Minguela, C., Baroja-Mazo, A., Alarcón-Vila, C., Martínez-Alarcón, L., Amores-Iniesta, J., Martín-Sánchez, F., Ercole, G. A., Martínez, C. M., González-Lisorge, A., Fernández-Pacheco, J., Martínez-Gil, P., Adriouch, S., Koch-Nolte, F., Luján, J., Acosta-Villegas, F., Parrilla, P., García-Palenciano, C., & Pelegrin, P.
- Affiliations
- Instituto Murciano de Investigación Biosanitaria (ES)
- Hospital Universitario Virgen de la Arrixaca (ES)
- Inserm (FR)
- ORCID
- Venue
- Nature Communications
- Published
- 2019-06-20
- Volume
- 10
- Issue
- 1
- Pages
- 2711-2711
- ISSN
- 2041-1723 (ISSN-L)
- PMC
- PMC6586640
- OpenAlex
- W2952125019
- Cited by
- 233
- References
- 63
- Citations by year
- 2026: 16 · 2025: 16 · 2024: 44 · 2023: 48 · 2022: 39 · 2021: 34 · 2020: 33 · 2019: 3
- FWCI
- 9.01
- Type
- journal article
- Language
- en
- Open access
- gold
- doi.org
- Locations
- Nature Communications (publishedVersion, cc-by)
- PubMed Central (publishedVersion, cc-by)
- PubMed (publishedVersion)
- Hispana (publishedVersion, cc-by)
- HAL (submittedVersion, other-oa)
- RePEc: Research Papers in Economics (submittedVersion)
- DOAJ (DOAJ: Directory of Open Access Journals) (submittedVersion, cc-by-sa)
- DOAJ (DOAJ: Directory of Open Access Journals) (submittedVersion)
- Funders
- Institute for Research in Biomedicine
- Ablynx
- European Cooperation in Science and Technology (BM-1406)
- Ministerio de Economía y Competitividad (FJCI-2014-22041, PI13/00174, CD13/00059)
- Ministerio de Asuntos Económicos y Transformación Digital, Gobierno de España (SAF2017‐88276‐R)
- European Regional Development Fund (PI13/00174)
- Topics
- Life Sciences › Biochemistry, Genetics and Molecular Biology › Molecular Biology › Inflammasome and immune disorders
- Life Sciences › Biochemistry, Genetics and Molecular Biology › Physiology › Adenosine and Purinergic Signaling
- Health Sciences › Medicine › Critical Care and Intensive Care Medicine › Sepsis Diagnosis and Treatment
- Keywords
- P2X7 receptor, NLRP3 inflammasome, mitochondrial dysfunction, monocytes, sepsis, HIF-1α, purinergic signaling, immunosuppression, sepsis mortality, abdominal sepsis, mouse sepsis model
- MeSH terms
- NLR Family, Pyrin Domain-Containing 3 Protein, Adult, Aged, Aged, 80 and over, Animals, Disease Models, Animal, Female, Follow-Up Studies, Humans, Macrophages, Male, Middle Aged, Mitochondria, Monocytes, Up-Regulation, Sepsis, Mice, Hypoxia-Inducible Factor 1, alpha Subunit, Receptors, Purinergic P2X7, Inflammasomes, Mitochondrial Dynamics
About these checks
Registry, retraction, Cites and statistics results are computed, not judged, with one exception: a printed reference that no index lists is read once by a model before it counts as a citation error. Claims are extracted by a model and kept only when their quote appears verbatim in the text; each cited source is then checked, with a model’s help, for whether it says what the claim relies on. Those verdicts can be wrong — read the claim’s quote and the cited source before relying on one.
Statistics and arithmetic are recomputed, not judged.
Confidence bands are shown only for fields calibrated on our annotated test set. None is calibrated yet, so no band is shown.
What counts as a claim ›How we measure confidence ›How we check this ›
Are you an author, or do you see a problem with this page? Request a review
