

The DOI matches its Crossref record; 57 of the 57 references it cites were found in a registry or an index.
Improving the diagnostic yield of exome- sequencing by predicting gene–phenotype associations using large-scale gene expression analysis
Open accessPublished version of a preprint
Abstract
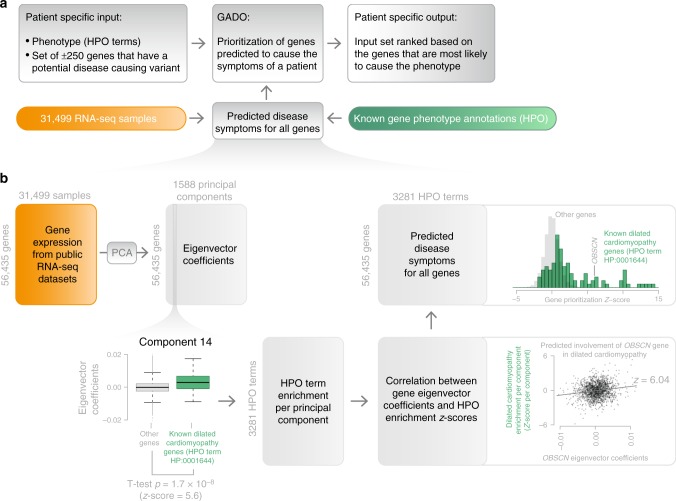
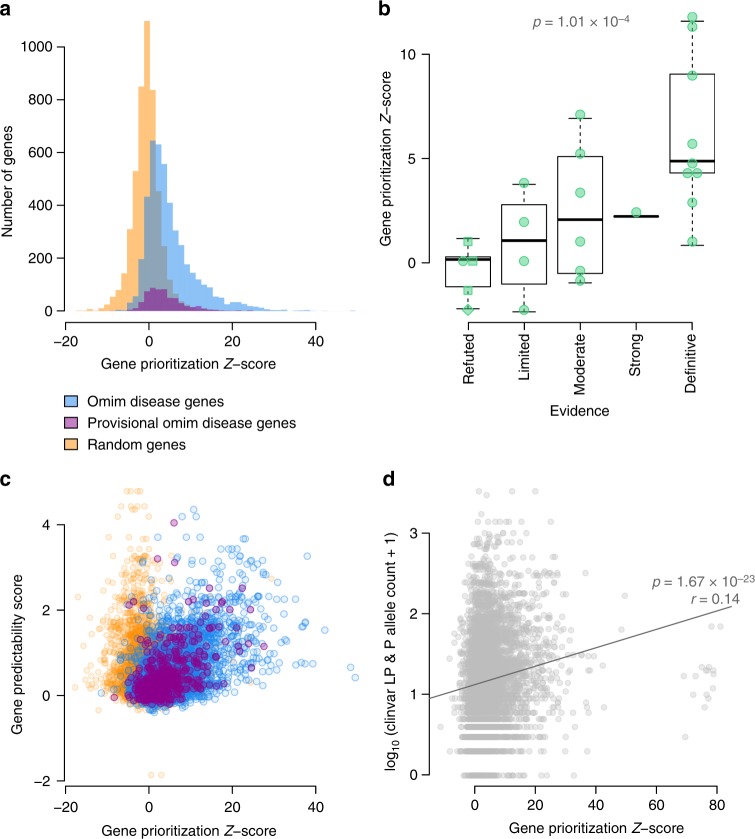
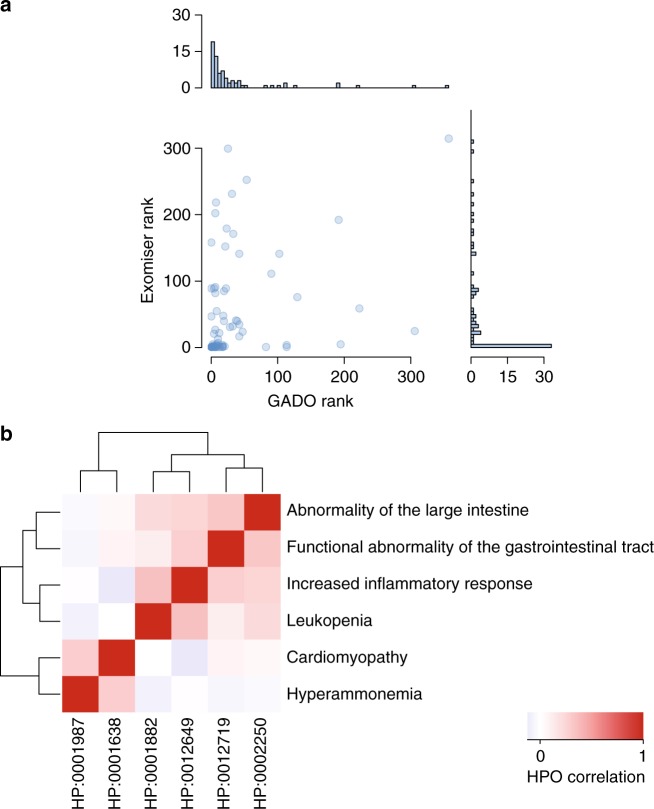
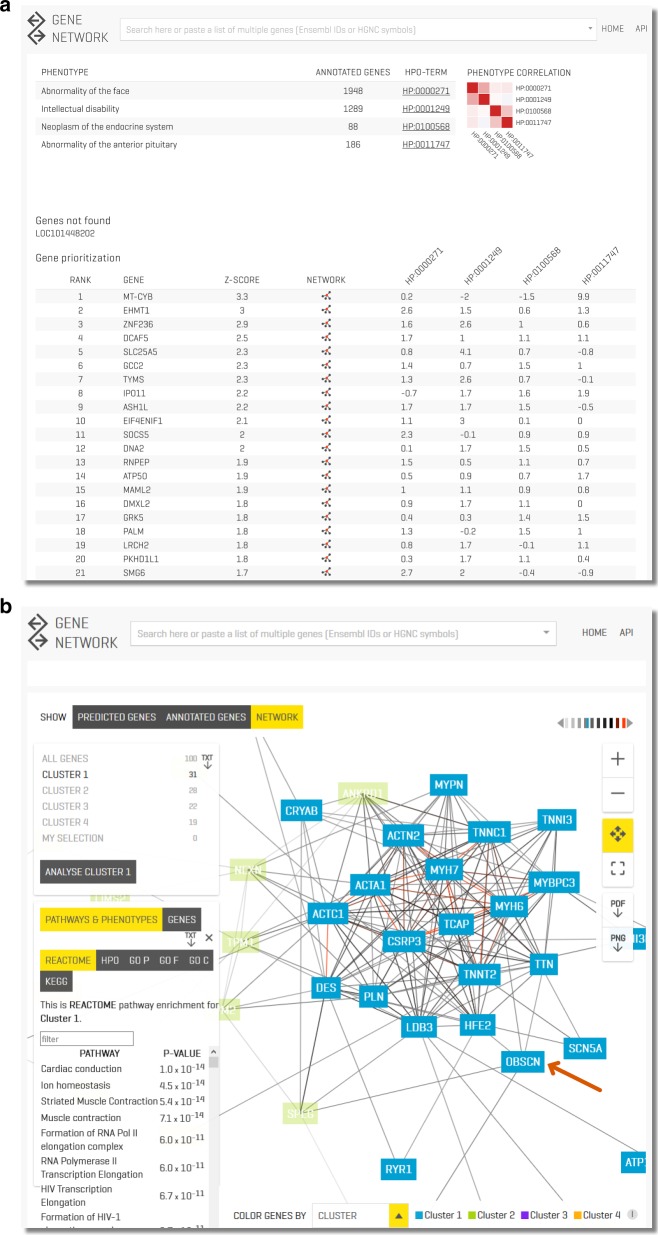
The diagnostic yield of exome and genome sequencing remains low (8–70%), due to incomplete knowledge on the genes that cause disease. To improve this, we use RNA-seq data from 31,499 samples to predict which genes cause specific disease phenotypes, and develop GeneNetwork Assisted Diagnostic Optimization (GADO). We show that this unbiased method, which does not rely upon specific knowledge on individual genes, is effective in both identifying previously unknown disease gene associations, and flagging genes that have previously been incorrectly implicated in disease. GADO can be run on www.genenetwork.nl by supplying HPO-terms and a list of genes that contain candidate variants. Finally, applying GADO to a cohort of 61 patients for whom exome-sequencing analysis had not resulted in a genetic diagnosis, yields likely causative genes for ten cases.
Overview
The claims and statistics of this paper haven’t been checked yet.
Run the check — free, no account needed. It reads the open-access text and checks the sources it cites.
Integrity signals
Registry
Cites
Statistics
Figures
Verification
Claims the paper makes
The claims and statistics of this paper haven’t been checked yet.
Run the check — free, no account needed. It reads the open-access text and checks the sources it cites.
Claims other papers make about this one
Each is checked against this paper’s own text: does it say what the citing paper says it does?
In the citing paper
“Furthermore, novel metrics based on gene co-regulation networks can predict whether genes function within a disease-relevant pathway33.”
From Evidence for 28 genetic disorders discovered by combining healthcare and research data (2020) · cites this paper as [33]
Self-check
Percentages, sums and reported differences re-computed from the paper’s own numbers.
The self-check needs the paper’s full text.
Citations
Cites
Near-optimal probabilistic RNA-seq quantification
Bray, N. L., Pimentel, H., Melsted, P., & Pachter, L. (2016) · Nature Biotechnology · doi:10.1038/nbt.3519 · Cited by 9,723
Analysis of protein-coding genetic variation in 60,706 humans
Exome Aggregation Consortium, Lek, M., Karczewski, K. J., Minikel, E. V., Samocha, K. E., Banks, E., Fennell, T., O’Donnell-Luria, A. H., Ware, J. S., Hill, A. J., et al. (2016) · Nature · doi:10.1038/nature19057 · Cited by 9,587
KEGG: new perspectives on genomes, pathways, diseases and drugs
Kanehisa, M., Furumichi, M., Tanabe, M., Sato, Y., & Morishima, K. (2017) · Nucleic Acids Research · doi:10.1093/nar/gkw1092 · Cited by 8,865
Szklarczyk, D., Morris, J. H., Cook, H., Kuhn, M., Wyder, S., Simonovic, M., Santos, A., Doncheva, N. T., Roth, A., Bork, P., et al. (2017) · Nucleic Acids Research · doi:10.1093/nar/gkw937 · Cited by 6,980
The Reactome pathway Knowledgebase
Fabregat, A., Sidiropoulos, K., Garapati, P., Gillespie, M., Hausmann, K., Haw, R., Jassal, B., Jupe, S., Korninger, F., McKay, S., et al. (2016) · Nucleic Acids Research · doi:10.1093/nar/gkv1351 · Cited by 5,605
ClinVar: public archive of relationships among sequence variation and human phenotype
Landrum, M. J., Lee, J. M., Riley, G. R., Jang, W., Rubinstein, W. S., Church, D. M., & Maglott, D. R. (2014) · Nucleic Acids Research · doi:10.1093/nar/gkt1113 · Cited by 3,516
ToppGene Suite for gene list enrichment analysis and candidate gene prioritization
Chen, J., Bardes, E. E., Aronow, B. J., & Jegga, A. G. (2009) · Nucleic Acids Research · doi:10.1093/nar/gkp427 · Cited by 2,952
The Reactome Pathway Knowledgebase
Fabregat, A., Jupe, S., Matthews, L. R., Sidiropoulos, K., Gillespie, M. E., Garapati, P. V., Haw, R., Jassal, B., Korninger, F., May, B., et al. (2017) · Nucleic Acids Research · doi:10.1093/nar/gkx1132 · Cited by 2,862
Expansion of the Gene Ontology knowledgebase and resources
The Gene Ontology Consortium (2017) · Nucleic Acids Research · doi:10.1093/nar/gkw1108 · Cited by 1,850
GeneMatcher: a matching tool for connecting investigators with an interest in the same gene.
Sobreira, N., Schiettecatte, F., Valle, D., & Hamosh, A. (2015) · Human Mutation · doi:10.1002/humu.22844 · Cited by 1,529
Research works printed but not linked: 1
- Fehrmann, R. S. N. et al. Gene expression analysis identifies global gene dosage sensitivity in cancer. Nat. Genet. 47, 115–125 (2015). · DOI · Paper page
Cited by
Sorted by citations
Items 101–150 of 150
ERICH4 is not involved in the assembly and secretion of intestinal lipoproteins
Visser, A., Zwol, W. H.-V., Kloosterhuis, N., Huijkman, N., Smit, M., Koster, M. H., Bloks, V. W., Hussain, M. M., van de Sluis, B., & Kuivenhoven, J. A. (2024) · Atherosclerosis · doi:10.1016/j.atherosclerosis.2024.118635 · Cited by 2
Unrevealing the shared genetic mechanisms underlying C-reactive protein and schizophrenia
Yang, Z., Li, D., Hé, Y., Chen, X., & Li, Z. (2023) · Progress in Neuro-Psychopharmacology and Biological Psychiatry · doi:10.1016/j.pnpbp.2023.110785 · Cited by 2
Nixon, A., Li, F., Havrilla, J. M., & Wang, K. (2022) · Chemistry & Biodiversity · doi:10.1002/cbdv.202200805 · Cited by 1
Kayabaşı, Ç., & Gündüz, C. (2023) · Nucleosides Nucleotides & Nucleic Acids · doi:10.1080/15257770.2023.2236143 · Cited by 1
Liu, L., Huang, S. H., Jiang, F., Liang, G.-Q., Zhu, X., Zhu, H., & Tian, W. (2025) · Human Reproduction · doi:10.1093/humrep/deaf186 · Cited by 1
Genomic biomarkers of liver toxicity risk from UK Biobank data
Shteto, A., Boulahfa, J., Etcheto, A., Zhong, Y., Kindermans, M., Parmentier, F., & Goodsaid, F. M. (2025) · The Pharmacogenomics Journal · doi:10.1038/s41397-025-00389-8 · Cited by 1
Chen, S., Nguyen, Q. M., Hu, Y., Liu, C., Weng, C., & Wang, K. (2026) · Journal of the American Medical Informatics Association · doi:10.1093/jamia/ocag131 · Cited by 1
Genetic insights into biological mechanisms governing human ovarian ageing
Ruth, K. S., Day, F. R., Hussain, J., Martínez-Marchal, A., Aiken, C. E., Azad, A., & Thompson, D. J. (2022) · Yearbook of pediatric endocrinology · doi:10.1530/ey.19.15.9 · Cited by 1
Godbole, K. (2019) · Elsevier eBooks · doi:10.1016/b978-0-12-809356-6.00006-x · Cited by 1
Liao, C., Sarayloo, F., Rochefort, D. L., Houle, G., Akçimen, F., He, Q., Laporte, A. D., Spiegelman, D., Rajput, A. H., Dion, P. A., et al. (2019) · bioRxiv (Cold Spring Harbor Laboratory) · doi:10.1101/580753 · Cited by 1
Long noncoding RNA VENTHEART is required for cardiomyocyte specification and functionPreprint
Dashi, A., Tan, W. L. W., Anene-Nzelu, C. G., Pan, B., Ilmari, A. M., Tiang, Z., Hartman, R. J. G., Stenzig, J., Wei, H., Bin, C. G., et al. (2021) · bioRxiv (Cold Spring Harbor Laboratory) · doi:10.1101/2021.02.01.429136 · Cited by 1
Li, S., Qi, C., Deelen, P., Boulogne, F., de Klein, N., Koppelman, G. H., van der Velde, K. J., Franke, L., Swertz, M. A., & Westra, H.-J. (2021) · bioRxiv (Cold Spring Harbor Laboratory) · doi:10.1101/2021.12.17.473125 · Cited by 2
Self-citationChazara, O., Dubé, M., Wang, Q., Middleton, L., Vitsios, D., Walentinsson, A., Wang, Q., Hansson, K. M., Granger, C. B., Kjekshus, J., et al. (2023) · medRxiv · doi:10.1101/2023.07.28.23293350 · Cited by 1
Chung, R., Wang, C., Onthoni, D. D., Liao, B., Hsu, T.-S., Martin, E. R., Hsiung, C. A., Sheu, W. H., & Chiou, H. (2024) · medRxiv · doi:10.1101/2024.05.20.24307650 · Cited by 1
Bekkhus, M., Tsotsi, S., Page, C. M., Czajkowski, N. O., Liu, W., Røysamb, E., Bang, N. R., Oftedal, A., Lyle, R., Hannigan, L. J., et al. (2025) · medRxiv · doi:10.1101/2025.05.24.25328240 · Cited by 1
Machine Learning for Multi-Omics Data Integration and Variant Pathogenicity Estimation
Li, S., van der Velde, K. J., & Swertz, M. A. (2018) · 2018 IEEE 14th International Conference on e-Science (e-Science) · doi:10.1109/escience.2018.00062
Self-citationGenetic regulation of gene expression in brain and blood
de Klein, N. (2021) · University of Groningen research database (University of Groningen / Centre for Information Technology) · doi:10.33612/diss.178049845
Castonguay, C.-E., Liao, C., Khayachi, A., Houle, G., Ross, J. P., Dion, P. A., & Rouleau, G. A. (2021) · bioRxiv (Cold Spring Harbor Laboratory) · doi:10.1101/2021.09.13.460137
Dunn, P. J. (2022) · Queensland University of Technology · doi:10.5204/thesis.eprints.229972
Alkuraya, F. S. (2020) · Faculty Opinions – Post-Publication Peer Review of the Biomedical Literature · doi:10.3410/f.738833309.793579409
Association of Alpha 1 Antitrypsin Deficiency with COVID-19 Mortality: Basis for Clinical Trials
Dutta, A. K., & Goswami, K. (2022) · Springer eBooks · doi:10.1007/978-3-031-08045-6_16
de Vries, D. H. (2022) · University of Groningen research database (University of Groningen / Centre for Information Technology) · doi:10.33612/diss.255266474
Li, S., Schmid, K., de Vries, D. H., Korshevniuk, M., Losert, C., Oelen, R., van Blokland, I. V., Groot, H. E., Swertz, M. A., van der Harst, P., et al. (2023) · Figshare · doi:10.6084/m9.figshare.22655429
Self-citationLi, S., Schmid, K., de Vries, D. H., Korshevniuk, M., Losert, C., Oelen, R., van Blokland, I. V., Groot, H. E., Swertz, M. A., van der Harst, P., et al. (2023) · Figshare · doi:10.6084/m9.figshare.22655408
Self-citationLi, S., Schmid, K., de Vries, D. H., Korshevniuk, M., Losert, C., Oelen, R., van Blokland, I. V., Groot, H. E., Swertz, M. A., van der Harst, P., et al. (2023) · Figshare · doi:10.6084/m9.figshare.22655426
Self-citationLi, S., Schmid, K., de Vries, D. H., Korshevniuk, M., Losert, C., Oelen, R., van Blokland, I. V., Groot, H. E., Swertz, M. A., van der Harst, P., et al. (2023) · Figshare · doi:10.6084/m9.figshare.22655441
Self-citationLi, S., Schmid, K., de Vries, D. H., Korshevniuk, M., Losert, C., Oelen, R., van Blokland, I. V., Groot, H. E., Swertz, M. A., van der Harst, P., et al. (2023) · Figshare · doi:10.6084/m9.figshare.22655435
Self-citationLi, S., Schmid, K., de Vries, D. H., Korshevniuk, M., Losert, C., Oelen, R., van Blokland, I. V., Groot, H. E., Swertz, M. A., van der Harst, P., et al. (2023) · Figshare · doi:10.6084/m9.figshare.22655405
Self-citationLi, S., Schmid, K., de Vries, D. H., Korshevniuk, M., Losert, C., Oelen, R., van Blokland, I. V., Groot, H. E., Swertz, M. A., van der Harst, P., et al. (2023) · Figshare · doi:10.6084/m9.figshare.22655438
Self-citationLi, S., Schmid, K., de Vries, D. H., Korshevniuk, M., Losert, C., Oelen, R., van Blokland, I. V., Groot, H. E., Swertz, M. A., van der Harst, P., et al. (2023) · Figshare · doi:10.6084/m9.figshare.22655432
Self-citationLi, S., Schmid, K., de Vries, D. H., Korshevniuk, M., Losert, C., Oelen, R., van Blokland, I. V., Groot, H. E., Swertz, M. A., van der Harst, P., et al. (2023) · Figshare · doi:10.6084/m9.figshare.22655423
Self-citationLi, S., Schmid, K., de Vries, D. H., Korshevniuk, M., Losert, C., Oelen, R., van Blokland, I. V., Groot, H. E., Swertz, M. A., van der Harst, P., et al. (2023) · Figshare · doi:10.6084/m9.figshare.22655417
Self-citationLi, S., Schmid, K., de Vries, D. H., Korshevniuk, M., Losert, C., Oelen, R., van Blokland, I. V., Groot, H. E., Swertz, M. A., van der Harst, P., et al. (2023) · Figshare · doi:10.6084/m9.figshare.22655414
Self-citationLi, S., Schmid, K., de Vries, D. H., Korshevniuk, M., Losert, C., Oelen, R., van Blokland, I. V., Groot, H. E., Swertz, M. A., van der Harst, P., et al. (2023) · Figshare · doi:10.6084/m9.figshare.22655420
Self-citationLi, S., Schmid, K., de Vries, D. H., Korshevniuk, M., Losert, C., Oelen, R., van Blokland, I. V., Groot, H. E., Swertz, M. A., van der Harst, P., et al. (2023) · Figshare · doi:10.6084/m9.figshare.22655396
Self-citationTissue-aware interpretation of genetic variants advances the etiology of rare diseases
Argov, C. M., Shneyour, A., Jubran, J., Sabag, E., Mansbach, A., Sepunaru, Y., Filtzer, E., Gruber, G., Volozhinsky, M., Yogev, Y., et al. (2024) · Molecular Systems Biology · doi:10.1038/s44320-024-00061-6 · Cited by 1
Computational genomics and bioinformatics
Vestito, L., Cipriani, V., & Smedley, D. P. (2024) · Elsevier eBooks · doi:10.1016/b978-0-323-91799-5.00001-2
Attention-aware Rare Disease Diagnosis via Graph Attention Neural Network
Yang, X., He, D., Zhan, B., Zhang, Q., & Yan, S. (2024) · International Conference on Computational Biology and Bioinformatics (ICCBB) · doi:10.1145/3715020.3715060
Zhang, Z., Trypsteen, W., Blaauw, M., Chu, X., Rutsaert, S., Vandekerckhove, L., van der Heijden, W., dos Santos, J. C., Xu, C.-J., Swertz, M. A., et al. (2021) · Figshare · doi:10.6084/m9.figshare.17020836
Self-citationLi, S., Schmid, K., de Vries, D. H., Korshevniuk, M., Losert, C., Oelen, R., van Blokland, I. V., Groot, H. E., Swertz, M. A., van der Harst, P., et al. (2023) · Figshare · doi:10.6084/m9.figshare.22655402
Self-citationLi, S., van der Velde, K. J., de Ridder, D., van Dijk, A. D. J., Soudis, D., Zwerwer, L. R., Deelen, P., Hendriksen, D., Charbon, B., van Gijn, M. E., et al. (2020) · Figshare · doi:10.6084/m9.figshare.12858326
Self-citationZhang, Z., Trypsteen, W., Blaauw, M., Chu, X., Rutsaert, S., Vandekerckhove, L., van der Heijden, W., dos Santos, J. C., Xu, C.-J., Swertz, M. A., et al. (2021) · Figshare · doi:10.6084/m9.figshare.17020842
Self-citationLi, S., Schmid, K., de Vries, D. H., Korshevniuk, M., Losert, C., Oelen, R., van Blokland, I. V., Groot, H. E., Swertz, M. A., van der Harst, P., et al. (2023) · Figshare · doi:10.6084/m9.figshare.22655444
Self-citationGarza-Hernandez, D., Sepúlveda-Villegas, M., Garcia‐Pelaez, J., Aguirre-Gamboa, R., Lakatos, P. L., Estrada, K., Martinez-Vazquez, M., & Trevino, V. (2022) · Figshare · doi:10.6084/m9.figshare.19593927
Additional file 1 of nanotatoR: a tool for enhanced annotation of genomic structural variants
Bhattacharya, S., Barseghyan, H., Délot, E. C., & Vilain, E. J. N. (2021) · Figshare · doi:10.6084/m9.figshare.13533115
Li, S., Schmid, K., de Vries, D. H., Korshevniuk, M., Losert, C., Oelen, R., van Blokland, I. V., Groot, H. E., Swertz, M. A., van der Harst, P., et al. (2023) · Figshare · doi:10.6084/m9.figshare.22655399
Self-citationHet2Gene: a phenotype-driven model for gene prioritization by heterogeneous graph embedding
Zhan, B., Yang, X., He, D., Zhang, Z., Cui, F., Zhang, Q., & Yan, S. (2026) · Computers in Biology and Medicine · doi:10.1016/j.compbiomed.2026.111543
Maassen, W., Pape, L. C. E. T., Niemeijer, T., Heijink, A. M., Meems-Veldhuis, M. T., Boerrigter, D. J., Vries, G. K.-D., Westers, H., Johansson, L. F., van der Velde, K., et al. (2026) · Frontiers in Immunology · doi:10.3389/fimmu.2026.1829883
Self-citationLorenzo, B. D., Tavares, L. C., Díaz-Muñoz, C., Heredia-Fernández, F., Bozzarelli, I., Blanco, C. E., Wang, Z., Smit, R. A. J., Loos, R. J. F., Hirbo, J. B., et al. (2026) · Gut · doi:10.1136/gutjnl-2026-338800
Chen, J., Sun, X., Wu, S., Hu, J., Zou, Y., Hong, K., & Shen, Y. (2026) · Journal of Cardiovascular Development and Disease · doi:10.3390/jcdd13100530
Metadata
- Authors
- Deelen, P., van Dam, S., Herkert, J. C., Karjalainen, J. M., Brugge, H., Abbott, K. M., van Diemen, C. C., van der Zwaag, P. A., Gerkes, E. H., Zonneveld-Huijssoon, E., Boer-Bergsma, J. J., Folkertsma, P., Gillett, T., van der Velde, K. J., Kanninga, R., van den Akker, P. C., Jan, S. Z., Hoorntje, E. T., te Rijdt, W. P., Vos, Y. J., Jongbloed, J. D. H., van Ravenswaaij-Arts, C. M. A., Sinke, R., Sikkema-Raddatz, B., Kerstjens-Frederikse, W. S., Swertz, M. A., & Franke, L.
- Affiliations
- University Medical Center Groningen (NL)
- Corresponding author
- Franke, Lude
- ORCID
- Deelen, Patrick
- Herkert, Johanna C.
- Karjalainen, Juha M.
- Abbott, Kristin M.
- Zonneveld-Huijssoon, Evelien
- Boer-Bergsma, Jelkje J.
- Folkertsma, Pytrik
- Gillett, Tessa
- Jan, Sabrina Z.
- Hoorntje, Edgar T.
- te Rijdt, Wouter P.
- Jongbloed, Jan D. H.
- Sinke, Richard
- Kerstjens-Frederikse, Wilhelmina S.
- Swertz, Morris A.
- Franke, Lude
- Venue
- Nature Communications
- Published
- 2019-06-28
- Volume
- 10
- Issue
- 1
- Pages
- 2837-2837
- ISSN
- 2041-1723 (ISSN-L)
- PMC
- PMC6599066
- OpenAlex
- W2953983664
- Cited by
- 138
- References
- 57
- Citations by year
- 2026: 6 · 2025: 7 · 2024: 15 · 2023: 17 · 2022: 26 · 2021: 38 · 2020: 18 · 2019: 9
- FWCI
- 13.67
- Type
- journal article
- Language
- en
- Open access
- gold
- doi.org
- Locations
- Nature Communications (publishedVersion, cc-by)
- bioRxiv (Cold Spring Harbor Laboratory) (acceptedVersion, cc-by-nc-nd)
- PubMed Central (publishedVersion, cc-by)
- PubMed (publishedVersion)
- University of Groningen research database (University of Groningen / Centre for Information Technology) (acceptedVersion, cc-by)
- DOAJ (DOAJ: Directory of Open Access Journals) (submittedVersion, cc-by-sa)
- DOAJ (DOAJ: Directory of Open Access Journals) (submittedVersion)
- University of Groningen research database (University of Groningen / Centre for Information Technology) (submittedVersion, cc-by)
- University of Groningen research database (University of Groningen / Centre for Information Technology) (submittedVersion)
- Funders
- University of Groningen
- Topics
- Life Sciences › Biochemistry, Genetics and Molecular Biology › Genetics › Genomics and Rare Diseases
- Life Sciences › Biochemistry, Genetics and Molecular Biology › Molecular Biology › Bioinformatics and Genomic Networks
- Health Sciences › Medicine › Health Informatics › Biomedical Text Mining and Ontologies
- Keywords
- exome sequencing, diagnostic yield, genotype-phenotype correlation, RNA-seq, gene expression, disease gene discovery, Human Phenotype Ontology, candidate variants, genetic diagnosis
- MeSH terms
- Gene Expression Regulation, Humans, Models, Genetic, Software, User-Computer Interface, Sequence Analysis, RNA, Genetic Predisposition to Disease, Principal Component Analysis, Databases, Nucleic Acid, Transcriptome
About these checks
Registry, retraction, Cites and statistics results are computed, not judged, with one exception: a printed reference that no index lists is read once by a model before it counts as a citation error. Claims are extracted by a model and kept only when their quote appears verbatim in the text; each cited source is then checked, with a model’s help, for whether it says what the claim relies on. Those verdicts can be wrong — read the claim’s quote and the cited source before relying on one.
Statistics and arithmetic are recomputed, not judged.
Confidence bands are shown only for fields calibrated on our annotated test set. None is calibrated yet, so no band is shown.
What counts as a claim ›How we measure confidence ›How we check this ›
Are you an author, or do you see a problem with this page? Request a review
