

The DOI matches its Crossref record; 58 of the 58 references it cites were found in a registry or an index.
Establishing microbial composition measurement standards with reference frames
Open accessAbstract
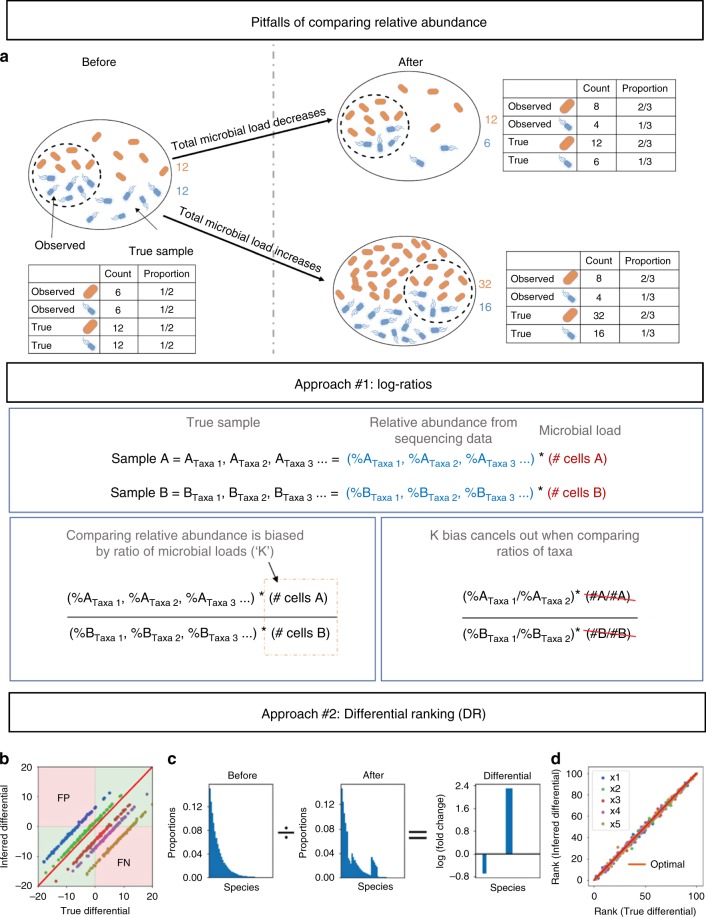
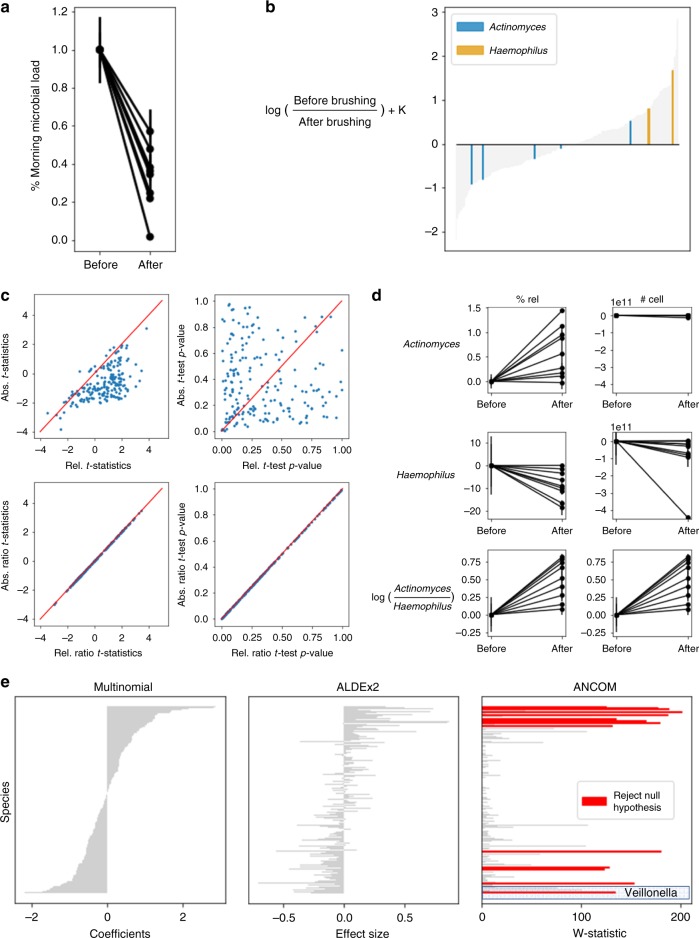
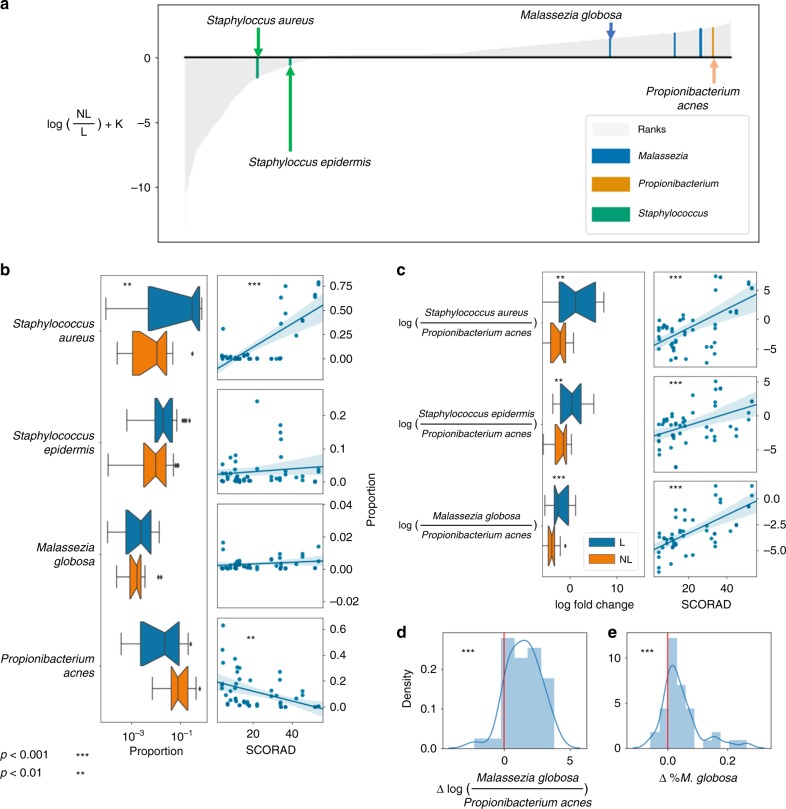
Differential abundance analysis is controversial throughout microbiome research. Gold standard approaches require laborious measurements of total microbial load, or absolute number of microorganisms, to accurately determine taxonomic shifts. Therefore, most studies rely on relative abundance data. Here, we demonstrate common pitfalls in comparing relative abundance across samples and identify two solutions that reveal microbial changes without the need to estimate total microbial load. We define the notion of “reference frames”, which provide deep intuition about the compositional nature of microbiome data. In an oral time series experiment, reference frames alleviate false positives and produce consistent results on both raw and cell-count normalized data. Furthermore, reference frames identify consistent, differentially abundant microbes previously undetected in two independent published datasets from subjects with atopic dermatitis. These methods allow reassessment of published relative abundance data to reveal reproducible microbial changes from standard sequencing output without the need for new assays.
Overview
The claims and statistics of this paper haven’t been checked yet.
Free: it reads the open-access text and checks the first 5 claims that cite a source we can check. Create a free account to check every claim.
Integrity signals
Registry
Cites
Statistics
Figures
Verification
Claims the paper makes
The claims and statistics of this paper haven’t been checked yet.
Free: it reads the open-access text and checks the first 5 claims that cite a source we can check. Create a free account to check every claim.
Claims other papers make about this one
Each is checked against this paper’s own text: does it say what the citing paper says it does?
In the citing paper
“A recent approach called differential ranking is robust to the choice of the alr reference feature, and ranks produced from relative abundances are identical to the ranks of absolute abundances66,67.”
From Longitudinal gut microbiome changes in immune checkpoint blockade-treated advanced melanoma (2024) · cites this paper as [67]
Self-check
Percentages, sums and reported differences re-computed from the paper’s own numbers.
The self-check needs the paper’s full text.
Citations
Cites
Moderated estimation of fold change and dispersion for RNA-seq data with DESeq2
Love, M. I., Huber, W., & Anders, S. (2014) · Genome Biology · doi:10.1186/s13059-014-0550-8 · Cited by 95,106
QIIME allows analysis of high-throughput community sequencing data
Caporaso, J. G., Kuczynski, J., Stombaugh, J., Bittinger, K., Bushman, F. D., Costello, E. K., Fierer, N., Peña, A. G., Goodrich, J. K., Gordon, J. I., et al. (2010) · Nature Methods · doi:10.1038/nmeth.f.303 · Cited by 34,887
Self-citationNaïve Bayesian Classifier for Rapid Assignment of rRNA Sequences into the New Bacterial Taxonomy
Wang, Q., Garrity, G. M., Tiedje, J. M., & Cole, J. R. (2007) · Applied and Environmental Microbiology · doi:10.1128/aem.00062-07 · Cited by 19,885
TensorFlow: A system for large-scale machine learning
Abadi, M., Barham, P., Chen, J., Chen, Z., Davis, A., Dean, J., Devin, M., Ghemawat, S., Irving, G., Isard, M., et al. (2016) · arXiv (Cornell University) · doi:10.48550/arxiv.1605.08695 · Cited by 11,822
Ecological Diversity and Its Measurement
Magurran, A. E. (1988) · Springer eBooks · doi:10.1007/978-94-015-7358-0 · Cited by 10,879
The Statistical Analysis of Compositional Data
Aitchison, J. (1982) · Journal of the Royal Statistical Society Series B: Statistical Methodology · doi:10.1111/j.2517-6161.1982.tb01195.x · Cited by 3,405
Microbiome Datasets Are Compositional: And This Is Not Optional
Gloor, G. B., Macklaim, J. M., Pawlowsky-Glahn, V., & Egozcue, J. J. (2017) · Frontiers in Microbiology · doi:10.3389/fmicb.2017.02224 · Cited by 3,044
Inferring Correlation Networks from Genomic Survey Data
Friedman, J., & Alm, E. J. (2012) · PLoS Computational Biology · doi:10.1371/journal.pcbi.1002687 · Cited by 2,706
Differential abundance analysis for microbial marker-gene surveys
Paulson, J. N., Stine, O. C., Bravo, H. C., & Pop, M. (2013) · Nature Methods · doi:10.1038/nmeth.2658 · Cited by 2,428
Analysis of composition of microbiomes: a novel method for studying microbial composition
Mandal, S., Van Treuren, W., White, R. A., Eggesbø, M., Knight, R., & Peddada, S. D. (2015) · Microbial Ecology in Health & Disease · doi:10.3402/mehd.v26.27663 · Cited by 1,942
Self-citation
Research works printed but not linked: 2
- Lovell, D., Taylor, J., Zwart, A. & Helliwell, C. Caution! compositions! can constraints on omics data lead analyses astray. CSIRO 1, 44 (2010).
- Gonzalez, A. et al. Qiita: rapid, web-enabled microbiome meta-analysis. Nat. Methods 15, 796–798 (2018). · DOI · Paper page
Cited by
Estimated transmissibility and impact of SARS-CoV-2 lineage B.1.1.7 in England
Davies, N. G., Abbott, S., Barnard, R. C., Jarvis, C. I., Kucharski, A. J., Munday, J. D., Pearson, C. A. B., Russell, T. W., Tully, D. C., Washburne, A. D., et al. (2021) · Science · doi:10.1126/science.abg3055 · Cited by 2,581
“126) 51 (44-57) 87 (75-100) 2b UK sequence separate-slopes binomial GLMM (1|LTLA/OBS) + REGION * DATE UK avg.”
BackgroundInfluentialSelf-citationClimate warming enhances microbial network complexity and stability
Yuan, M. M., Guo, X., Wu, L., Zhang, Y., Xiao, N., Ning, D., Shi, Z., Zhou, X., Wu, L., Yang, Y., et al. (2021) · Nature Climate Change · doi:10.1038/s41558-021-00989-9 · Cited by 2,238
Analysis of compositions of microbiomes with bias correction
Lin, H., & Peddada, S. D. (2020) · Nature Communications · doi:10.1038/s41467-020-17041-7 · Cited by 2,104
Microbiome differential abundance methods produce different results across 38 datasets
Nearing, J. T., Douglas, G. M., Hayes, M. G., MacDonald, J., Desai, D. K., Allward, N., Jones, C. M. A., Wright, R. J., Dhanani, A. S., Comeau, A. M., et al. (2022) · Nature Communications · doi:10.1038/s41467-022-28034-z · Cited by 992
Estaki, M., Jiang, L., Bokulich, N. A., McDonald, D., González, A., Kosciolek, T., Martino, C., Zhu, Q., Birmingham, A., Vázquez‐Baeza, Y., et al. (2020) · Current Protocols in Bioinformatics · doi:10.1002/cpbi.100 · Cited by 565
“Two QIIME 2 plugins that can be used for this are q2-songbird (Morton et al., 2019) and q2-composition .”
BackgroundMethodSelf-citation
Metadata
- Authors
- Morton, J. T., Marotz, C., Washburne, A., Silverman, J., Zaramela, L. S., Edlund, A., Zengler, K., & Knight, R.
- Affiliations
- University of California San Diego (US)
- Montana State University (US)
- Duke University (US)
- J. Craig Venter Institute (US)
- Corresponding author
- Zengler, Karsten
- Knight, Rob
- ORCID
- Venue
- Nature Communications
- Published
- 2019-06-20
- Volume
- 10
- Issue
- 1
- Pages
- 2719-2719
- ISSN
- 2041-1723 (ISSN-L)
- PMC
- PMC6586903
- OpenAlex
- W2951061751
- Cited by
- 613
- References
- 56
- Citations by year
- 2026: 31 · 2025: 60 · 2024: 83 · 2023: 87 · 2022: 124 · 2021: 122 · 2020: 96 · 2019: 10
- FWCI
- 29.77
- Type
- journal article
- Language
- en
- Open access
- gold
- doi.org
- Licence
- cc-by
- creativecommons.org/licenses/by/4.0 (tdm)
- creativecommons.org/licenses/by/4.0 (vor)
- Locations
- Nature Communications (publishedVersion, cc-by)
- PubMed Central (publishedVersion, cc-by)
- PubMed (publishedVersion)
- eScholarship (California Digital Library) (submittedVersion, cc-by)
- RePEc: Research Papers in Economics (submittedVersion)
- DOAJ (DOAJ: Directory of Open Access Journals) (submittedVersion)
- DOAJ (DOAJ: Directory of Open Access Journals) (submittedVersion, cc-by-sa)
- eScholarship (California Digital Library) (submittedVersion)
- Funders
- National Science Foundation (GRFP DGE-1144086, DBI-1565057)
- U.S. Department of Health & Human Services | NIH | National Institute of Dental and Craniofacial Research (1F31DE028478)
- Alfred P. Sloan Foundation (G-2017-9838)
- Janssen Pharmaceuticals (20175015)
- Topics
- Life Sciences › Biochemistry, Genetics and Molecular Biology › Molecular Biology › Gut microbiota and health
- Health Sciences › Dentistry › Periodontics › Oral microbiology and periodontitis research
- Life Sciences › Biochemistry, Genetics and Molecular Biology › Molecular Biology › Genomics and Phylogenetic Studies
- Keywords
- reference frames, relative abundance, differential abundance, microbiota composition, compositional data, oral microbiota, atopic dermatitis, reproducibility, false positives
- MeSH terms
- Data Analysis, Bacteria, Computer Simulation, Dermatitis, Atopic, Feasibility Studies, Humans, Models, Biological, Reference Standards, RNA, Ribosomal, 16S, Saliva, Soil Microbiology, Metagenome, Bacterial Load, High-Throughput Nucleotide Sequencing, Microbiota, Healthy Volunteers, Datasets as Topic
About these checks
Registry, retraction, Cites and statistics results are computed, not judged, with one exception: a printed reference that no index lists is read once by a model before it counts as a citation error. Claims are extracted by a model and kept only when their quote appears verbatim in the text; each cited source is then checked, with a model’s help, for whether it says what the claim relies on. Those verdicts can be wrong — read the claim’s quote and the cited source before relying on one.
Statistics and arithmetic are recomputed, not judged.
Confidence bands are shown only for fields calibrated on our annotated test set. None is calibrated yet, so no band is shown.
What counts as a claim ›How we measure confidence ›How we check this ›
Are you an author, or do you see a problem with this page? Request a review
How to cite
Cite CoChat for the checks on this page, and the paper for its own findings.
- This page
- CoChat. (2026). Citation check: Establishing microbial composition measurement standards with reference frames. https://app.cochat.ai/papers/10.1038/s41467-019-10656-5
- The paper
- Morton, J. T., Marotz, C., Washburne, A., Silverman, J., Zaramela, L. S., Edlund, A., Zengler, K., & Knight, R. (2019). Establishing microbial composition measurement standards with reference frames. Nature Communications. https://doi.org/10.1038/s41467-019-10656-5
Data sources
Bibliographic data: Semantic Scholar, OpenAlex, Crossref.
Contains information from the Semantic Scholar Academic Graph Datasets, made available under the ODC Attribution License (ODC-BY 1.0).
Semantic Scholar’s data is described in: Kinney, R., et al. (2023). The Semantic Scholar Open Data Platform. arXiv:2301.10140.
