

The DOI matches its Crossref record; 83 of the 83 references it cites were found in a registry or an index.
High-throughput targeted long-read single cell sequencing reveals the clonal and transcriptional landscape of lymphocytes
Open accessPublished version of a preprint
Abstract
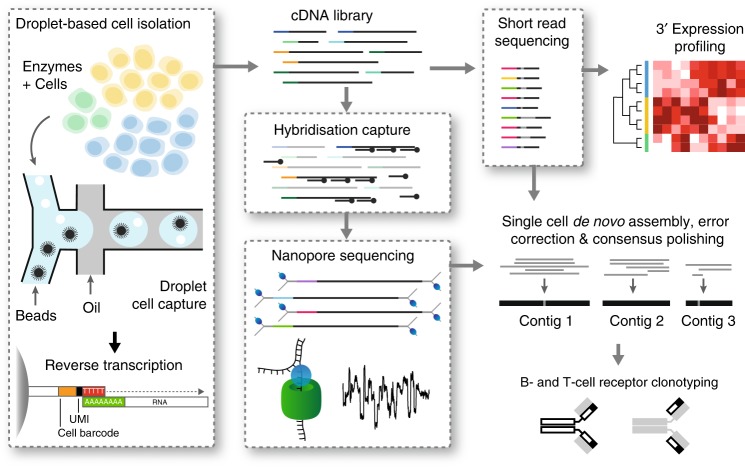
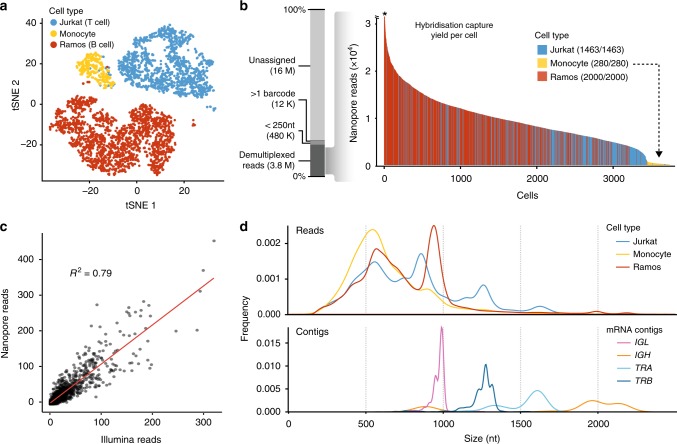
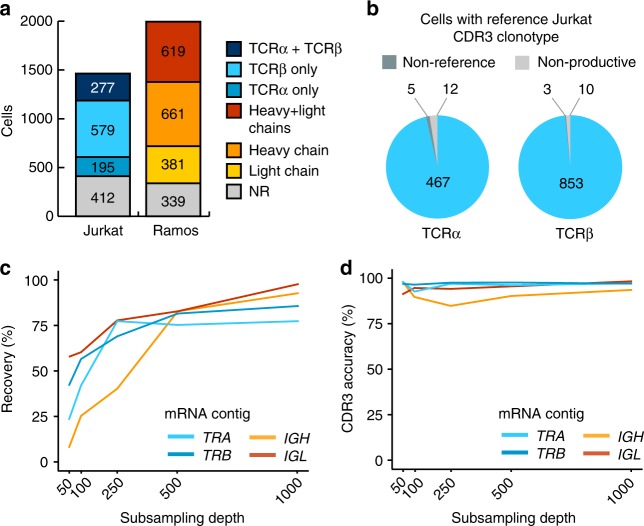
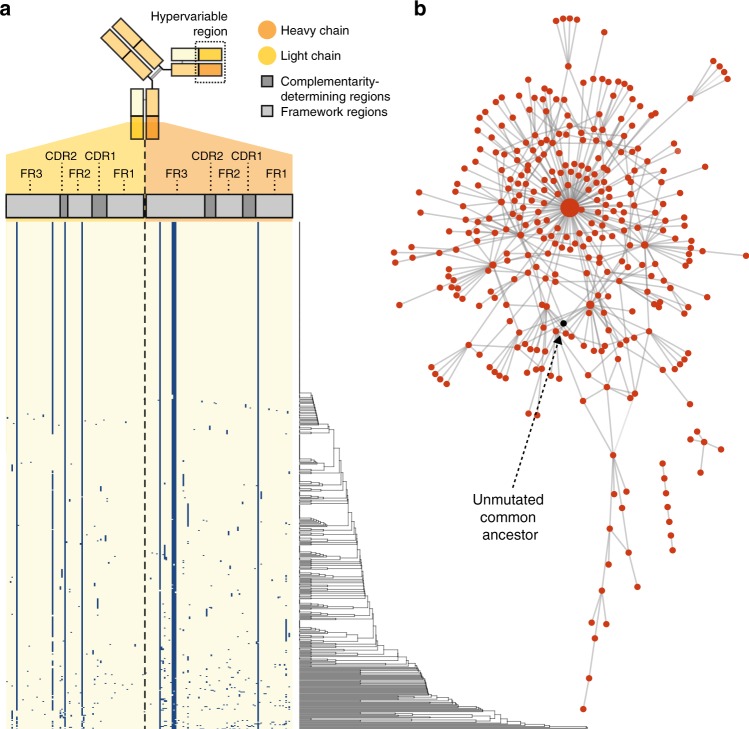
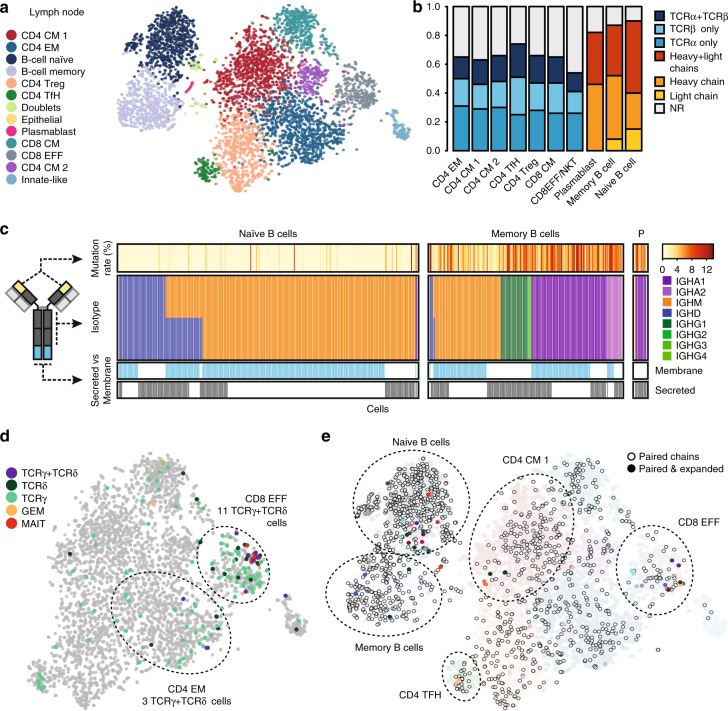
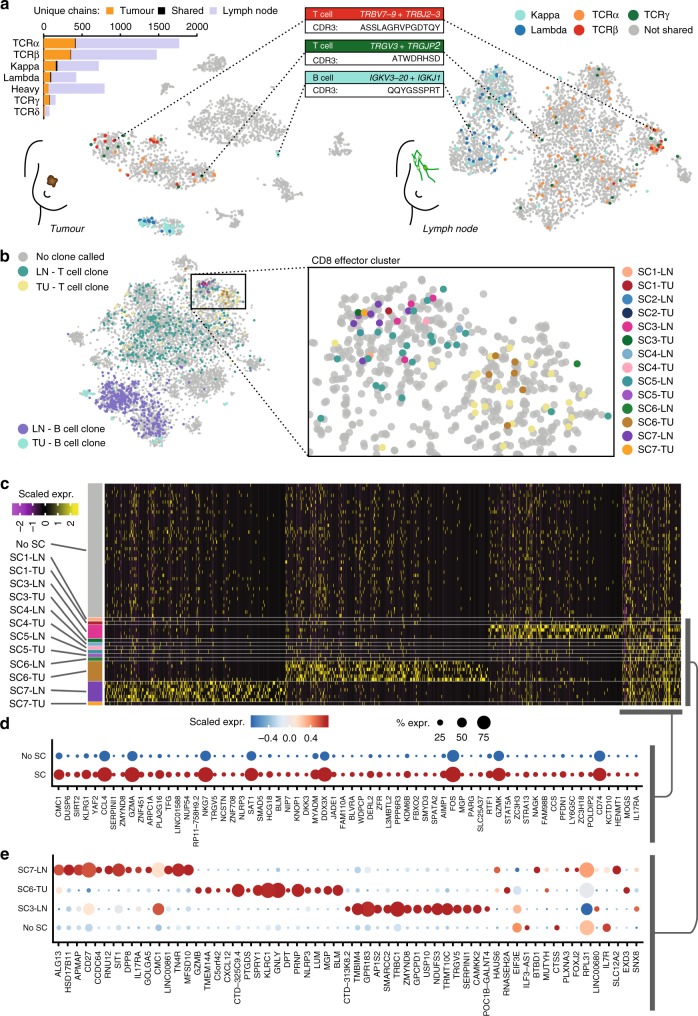
High-throughput single-cell RNA sequencing is a powerful technique but only generates short reads from one end of a cDNA template, limiting the reconstruction of highly diverse sequences such as antigen receptors. To overcome this limitation, we combined targeted capture and long-read sequencing of T-cell-receptor (TCR) and B-cell-receptor (BCR) mRNA transcripts with short-read transcriptome profiling of barcoded single-cell libraries generated by droplet-based partitioning. We show that Repertoire and Gene Expression by Sequencing (RAGE-Seq) can generate accurate full-length antigen receptor sequences at nucleotide resolution, infer B-cell clonal evolution and identify alternatively spliced BCR transcripts. We apply RAGE-Seq to 7138 cells sampled from the primary tumor and draining lymph node of a breast cancer patient to track transcriptome profiles of expanded lymphocyte clones across tissues. Our results demonstrate that RAGE-Seq is a powerful method for tracking the clonal evolution from large numbers of lymphocytes applicable to the study of immunity, autoimmunity and cancer.
Overview
The claims and statistics of this paper haven’t been checked yet.
Run the check — free, no account needed. It reads the open-access text and checks the sources it cites.
Integrity signals
Registry
Cites
Statistics
Figures
Verification
Claims the paper makes
The claims and statistics of this paper haven’t been checked yet.
Run the check — free, no account needed. It reads the open-access text and checks the sources it cites.
Claims other papers make about this one
Each is checked against this paper’s own text: does it say what the citing paper says it does?
In the citing paper
“The V(D)J regions of rearranged TCR and BCR mRNAs are located in the first ~500 nucleotides of the 5′ end of the transcripts”
From The technological landscape and applications of single-cell multi-omics (2023) · cites this paper as [90]
In the citing paper
“Several methods have been published pairing gene expression with TCR sequences in single cells89–92.”
From The technological landscape and applications of single-cell multi-omics (2023) · cites this paper as [90]
In the citing paper
“short-read scRNA-seq is not always sufficient to resolve the genetic complexity of these isoforms while preserving accurate gene expression quantification at the 3′ end of the transcripts90.”
From The technological landscape and applications of single-cell multi-omics (2023) · cites this paper as [90]
Self-check
Percentages, sums and reported differences re-computed from the paper’s own numbers.
The self-check needs the paper’s full text.
Citations
Cites
The Sequence Alignment/Map format and SAMtools
Li, H., Handsaker, B., Wysoker, A., Fennell, T., Ruan, J., Homer, N., Marth, G., Abecasis, G., Durbin, R., & 1000 Genome Project Data Processing Subgroup (2009) · Bioinformatics · doi:10.1093/bioinformatics/btp352 · Cited by 62,041
Cytoscape: A software Environment for integrated models of biomolecular interaction networks
Shannon, P., Markiel, A., Ozier, O., Baliga, N. S., Wang, J. T., Ramage, D., Amin, N., Schwikowski, B., & Ideker, T. (2003) · Genome Research · doi:10.1101/gr.1239303 · Cited by 51,888
BLAST+: architecture and applications
Camacho, C., Coulouris, G., Avagyan, V., Ma, N., Papadopoulos, J., Bealer, K., & Madden, T. L. (2009) · BMC Bioinformatics · doi:10.1186/1471-2105-10-421 · Cited by 22,074
Minimap2: Pairwise alignment for nucleotide sequences
Li, H. (2018) · Bioinformatics · doi:10.1093/bioinformatics/bty191 · Cited by 14,807
Massively parallel digital transcriptional profiling of single cells
Zheng, G. X. Y., Terry, J. M., Belgrader, P., Ryvkin, P., Bent, Z. W., Wilson, R., Ziraldo, S. B., Wheeler, T. D., McDermott, G. P., Zhu, J., et al. (2017) · Nature Communications · doi:10.1038/ncomms14049 · Cited by 7,353
Canu: scalable and accurate long-read assembly via adaptive k -mer weighting and repeat separationPreprint
Koren, S., Walenz, B. P., Berlin, K., Miller, J. R., Bergman, N. H., & Phillippy, A. M. (2017) · Genome Research · doi:10.1101/gr.215087.116 · Cited by 7,260
Highly parallel genome-wide expression profiling of individual cells using nanoliter droplets.
Macosko, E. Z., Basu, A., Satija, R., Nemesh, J., Shekhar, K., Goldman, M., Tirosh, I., Bialas, A. R., Kamitaki, N., Martersteck, E. M., et al. (2015) · Cell · doi:10.1016/j.cell.2015.05.002 · Cited by 7,110
Spatial reconstruction of single-cell gene expression data
Satija, R., Farrell, J. A., Gennert, D., Schier, A. F., & Regev, A. (2015) · Nature Biotechnology · doi:10.1038/nbt.3192 · Cited by 7,055
PD-1 blockade induces responses by inhibiting adaptive immune resistance
Tumeh, P. C., Harview, C. L., Yearley, J. H., Shintaku, I. P., Taylor, E. J. M., Robert, L., Chmielowski, B., Spasic, M., Henry, G., Ciobanu, V., et al. (2014) · Nature · doi:10.1038/nature13954 · Cited by 6,609
Alternative isoform regulation in human tissue transcriptomes
Wang, E. T., Sandberg, R., Luo, S., Khrebtukova, I., Zhang, L., Mayr, C., Kingsmore, S. F., Schroth, G. P., & Burge, C. B. (2008) · Nature · doi:10.1038/nature07509 · Cited by 5,181
Research works printed but not linked: 1
- Cao, J. et al. Comprehensive single-cell transcriptional profiling of a multicellular organism. Science 357, 661–667, https://doi.org/10.1126/science.aam8940 (2017). · DOI · Paper page
Cited by
Sorted by citations
Nanopore sequencing technology, bioinformatics and applications
Wang, Y., Zhao, Y., Bollas, A., Wang, Y., & Au, K. F. (2021) · Nature Biotechnology · doi:10.1038/s41587-021-01108-x · Cited by 1,863
The technological landscape and applications of single-cell multi-omics
Baysoy, A., Bai, Z., Satija, R., & Fan, R. (2023) · Nature Reviews Molecular Cell Biology · doi:10.1038/s41580-023-00615-w · Cited by 1,037
Andersson, A., Larsson, L., Stenbeck, L., Salmén, F., Ehinger, A., Wu, S. Z., Al-Eryani, G., Roden, D., Swarbrick, A., Borg, Å., et al. (2021) · Nature Communications · doi:10.1038/s41467-021-26271-2 · Cited by 404
Self-citationMoragues, T., Mendoza, D. A., Beneyton, T., Modavi, C., Simutis, K., Abate, A. R., Baret, J., deMello, A. J., Densmore, D. M., & Griffiths, A. D. (2023) · Nature Reviews Methods Primers · doi:10.1038/s43586-023-00212-3 · Cited by 355
High-throughput and single-cell T cell receptor sequencing technologies
Pai, J. A., & Satpathy, A. T. (2021) · Nature Methods · doi:10.1038/s41592-021-01201-8 · Cited by 301
Unraveling B cell trajectories at single cell resolution
Morgan, D., & Tergaonkar, V. (2022) · Trends in Immunology · doi:10.1016/j.it.2022.01.003 · Cited by 239
High throughput error corrected Nanopore single cell transcriptome sequencing
Lebrigand, K., Magnone, V., Barbry, P., & Waldmann, R. (2020) · Nature Communications · doi:10.1038/s41467-020-17800-6 · Cited by 236
Tian, L., Jabbari, J. S., Thijssen, R., Gouil, Q. A., Amarasinghe, S. L., Voogd, O., Kariyawasam, H., Du, M. R. M., Schuster, J., Wang, C., et al. (2021) · Genome biology · doi:10.1186/s13059-021-02525-6 · Cited by 215
The Great Immune Escape: Understanding the Divergent Immune Response in Breast Cancer Subtypes
Onkar, S., Carleton, N. M., Lucas, P. C., Bruno, T. C., Lee, A. V., Vignali, D. A. A., & Oesterreich, S. (2022) · Cancer Discovery · doi:10.1158/2159-8290.cd-22-0475 · Cited by 227
Pardo-Palacios, F. J., Arzalluz-Luque, Á., Kondratova, L., Salguero, P., Mestre‐Tomás, J., Amorín, R., Estevan-Morió, E., Liu, T., Nanni, A. V., McIntyre, L. M., et al. (2024) · Nature Methods · doi:10.1038/s41592-024-02229-2 · Cited by 219
Identification of cell barcodes from long-read single-cell RNA-seq with BLAZE
You, Y., Prawer, Y. D. J., Paoli‐Iseppi, R. D., Hunt, C. P. J., Parish, C. L., Shim, H., & Clark, M. B. (2023) · Genome biology · doi:10.1186/s13059-023-02907-y · Cited by 179
Dysregulation and therapeutic targeting of RNA splicing in cancer
Stanley, R. F., & Abdel-Wahab, O. I. (2022) · Nature Cancer · doi:10.1038/s43018-022-00384-z · Cited by 172
Progress and Prospect of Immunotherapy for Triple-Negative Breast Cancer
Luo, C., Wang, P., He, S., Zhu, J., Shi, Y., & Wang, J. (2022) · Frontiers in Oncology · doi:10.3389/fonc.2022.919072 · Cited by 147
Spatial transcriptomics of B cell and T cell receptors reveals lymphocyte clonal dynamics
Engblom, C., Thrane, K., Lin, Q., Andersson, A., Toosi, H., Chen, X., Steiner, E., Lu, C., Mantovani, G., Hagemann-Jensen, M., et al. (2023) · Science · doi:10.1126/science.adf8486 · Cited by 153
Recent advances in single-cell sequencing technologies
Wen, L., & Tang, F. (2022) · Precision Clinical Medicine · doi:10.1093/pcmedi/pbac002 · Cited by 127
Antibody display technologies: selecting the cream of the crop
Valldorf, B., Hinz, S. C., Russo, G., Pekar, L., Mohr, L., Klemm, J., Doerner, A., Krah, S., Hust, M., & Zielonka, S. (2021) · Biological Chemistry · doi:10.1515/hsz-2020-0377 · Cited by 132
TCR sequencing paired with massively parallel 3′ RNA-seq reveals clonotypic T cell signatures
Tu, A. A., Gierahn, T. M., Monian, B., Morgan, D. M., Mehta, N. K., Ruiter, B., Shreffler, W. G., Shalek, A. K., & Love, J. C. (2019) · Nature Immunology · doi:10.1038/s41590-019-0544-5 · Cited by 128
Single-nuclei isoform RNA sequencing unlocks barcoded exon connectivity in frozen brain tissue
Hardwick, S. A., Hu, W., Joglekar, A., Fan, L., Collier, P. G., Foord, C., Balacco, J., Lanjewar, S., Sampson, M. M., Koopmans, F., et al. (2022) · Nature Biotechnology · doi:10.1038/s41587-022-01231-3 · Cited by 119
Methodologies for Transcript Profiling Using Long-Read Technologies
Oikonomopoulos, S., Bayega, A., Fahiminiya, S., Djambazian, H. H. V., Bérubé, P., & Ragoussis, J. (2020) · Frontiers in Genetics · doi:10.3389/fgene.2020.00606 · Cited by 111
Joglekar, A., Hu, W., Zhang, B., Narykov, O., Diekhans, M., Marrocco, J., Balacco, J., Ndhlovu, L. C., Milner, T. A., Fedrigo, O. D., et al. (2024) · Nature Neuroscience · doi:10.1038/s41593-024-01616-4 · Cited by 126
Transcriptomics in the era of long-read sequencing
Monzó, C., Liu, T., & Conesa, A. (2025) · Nature Reviews Genetics · doi:10.1038/s41576-025-00828-z · Cited by 127
A single-cell survey of cellular hierarchy in acute myeloid leukemia
Wu, J., Xiao, Y., Sun, J., Sun, H., Chen, H., Zhu, Y., Fu, H., Yu, C., Weigao, E., Lai, S., et al. (2020) · Journal of Hematology & Oncology · doi:10.1186/s13045-020-00941-y · Cited by 114
Droplet-based single cell RNAseq tools: a practical guide
Salomon, R., Kaczorowski, D., Valdes-Mora, F., Nordon, R. E., Neild, A., Farbehi, N., Bartonicek, N., & Gallego-Ortega, D. (2019) · Lab on a Chip · doi:10.1039/c8lc01239c · Cited by 109
Nanopore sequencing: flourishing in its teenage years
Zhang, T., Li, H., Jiang, M., Hou, H., Gao, Y., Li, Y., Wang, F., Wang, J., Peng, K., & Liu, Y. (2024) · Journal of genetics and genomics/Journal of Genetics and Genomics · doi:10.1016/j.jgg.2024.09.007 · Cited by 117
Single-cell RNA-seq analysis of mouse preimplantation embryos by third-generation sequencing
Fan, X., Tang, D., Liao, Y., Li, P., Zhang, Y., Wang, M., Liang, F., Wang, X., Gao, Y., Wen, L., et al. (2020) · PLoS Biology · doi:10.1371/journal.pbio.3001017 · Cited by 103
Harris, R. J. C., Cheung, A., Ng, J. C.-F., Laddach, R., Chenoweth, A. M., Crescioli, S., Fittall, M. W., Dominguez-Rodriguez, D., Roberts, J., Levi, D., et al. (2021) · Cancer Research · doi:10.1158/0008-5472.can-20-3773 · Cited by 100
Single-cell isoform analysis in human immune cells
Volden, R., & Vollmers, C. (2022) · Genome biology · doi:10.1186/s13059-022-02615-z · Cited by 85
Single-cell immunology: Past, present, and future
Ginhoux, F., Yalin, A., Dutertre, C., & Amit, I. (2022) · Immunity · doi:10.1016/j.immuni.2022.02.006 · Cited by 96
JAFFAL: detecting fusion genes with long-read transcriptome sequencing
Davidson, N., Chen, Y., Sadras, T., Ryland, G. L., Blombery, P. A., Ekert, P. G., Göke, J., & Oshlack, A. (2022) · Genome biology · doi:10.1186/s13059-021-02588-5 · Cited by 90
Immunology Driven by Large-Scale Single-Cell Sequencing
Gomes, T., Teichmann, S. A., & Talavera-López, C. N. (2019) · Trends in Immunology · doi:10.1016/j.it.2019.09.004 · Cited by 72
Wu, C.-Y., Lau, B. T., Kim, H. S., Sathe, A., Grimes, S. M., Ji, H. P., & Zhang, N. R. (2021) · Nature Biotechnology · doi:10.1038/s41587-021-00911-w · Cited by 75
Updates on Immunotherapy and Immune Landscape in Renal Clear Cell Carcinoma
Kim, M., Jin, Z., Kolb, R. H., Borcherding, N. C., Chatzkel, J. A., Falzarano, S. M., & Zhang, W. (2021) · Cancers · doi:10.3390/cancers13225856 · Cited by 80
Computational immunogenomic approaches to predict response to cancer immunotherapies
Addala, V., Newell, F., Pearson, J. V., Redwood, A., Robinson, B. W. S., Creaney, J., & Waddell, N. (2023) · Nature Reviews Clinical Oncology · doi:10.1038/s41571-023-00830-6 · Cited by 79
Single-Cell Techniques and Deep Learning in Predicting Drug Response
Wu, Z., Lawrence, P. J., Ma, A., Zhu, J., Xu, D., & Ma, Q. (2020) · Trends in Pharmacological Sciences · doi:10.1016/j.tips.2020.10.004 · Cited by 72
Masle‐Farquhar, E., Jackson, K., Peters, T. J., Al‐Eryani, G., Singh, M., Payne, K. J., Rao, G., Avery, D. T., Apps, G., Kingham, J., et al. (2022) · Immunity · doi:10.1016/j.immuni.2022.11.001 · Cited by 68
Self-citationJiang, R., Fichtner, M. L., Hoehn, K. B., Pham, M. C., Stathopoulos, P., Nowak, R. J., Kleinstein, S. H., & O’Connor, K. C. (2020) · JCI Insight · doi:10.1172/jci.insight.136471 · Cited by 65
Recent advances in high-throughput single-cell transcriptomics and spatial transcriptomics
Shen, X., Zhao, Y., Wang, Z., & Shi, Q. (2022) · Lab on a Chip · doi:10.1039/d2lc00633b · Cited by 68
High-Throughput Routes to Biomaterials Discovery
Soheilmoghaddam, M., Rumble, M., & Cooper-White, J. J. (2021) · Chemical Reviews · doi:10.1021/acs.chemrev.0c01026 · Cited by 68
Skin colonization by circulating neoplastic clones in cutaneous T-cell lymphoma
Iyer, A., Hennessey, D., O’Keefe, S. L., Patterson, J., Wang, W., Wong, G. K., & Gniadecki, R. (2019) · Blood · doi:10.1182/blood.2019002516 · Cited by 62
The current landscape of single-cell transcriptomics for cancer immunotherapy
Guruprasad, P., Lee, Y. G., Kim, K. H., & Ruella, M. (2020) · The Journal of Experimental Medicine · doi:10.1084/jem.20201574 · Cited by 65
Single-cell genomics in plants: current state, future directions, and hurdles to overcome
Cuperus, J. T. (2021) · PLANT PHYSIOLOGY · doi:10.1093/plphys/kiab478 · Cited by 61
Single‐Cell Sequencing Methodologies: From Transcriptome to Multi‐Dimensional Measurement
Chen, Y., Song, J. T., Ruan, Q., Zeng, X., Wu, L., Cai, L., Wang, X., & Yang, C. J. (2021) · Small Methods · doi:10.1002/smtd.202100111 · Cited by 61
Isoform Age - Splice Isoform Profiling Using Long-Read Technologies
Paoli‐Iseppi, R. D., Gleeson, J., & Clark, M. B. (2021) · Frontiers in Molecular Biosciences · doi:10.3389/fmolb.2021.711733 · Cited by 65
Vries, N. L. D., Mahfouz, A. E., Koning, F., & de Miranda, N. F. C. C. (2020) · Frontiers in Oncology · doi:10.3389/fonc.2020.01254 · Cited by 58
Hu, X., Yang, P., Chen, S., Wei, G., Yuan, L., Yang, Z., Gong, L., He, L., Yang, L., Peng, S., et al. (2023) · Breast Cancer Research · doi:10.1186/s13058-023-01639-y · Cited by 61
The Application of Single‐Cell RNA Sequencing in Vaccinology
Noé, A., Cargill, T. N., Nielsen, C. M., Russell, A. J. C., & Barnes, E. J. (2020) · Journal of Immunology Research · doi:10.1155/2020/8624963 · Cited by 61
Adaptive immune receptor repertoire analysis
Mhanna, V., Bashour, H., Quý, K. L., Barennes, P., Rawat, P., Greiff, V., & Mariotti‐Ferrandiz, E. (2024) · Nature Reviews Methods Primers · doi:10.1038/s43586-023-00284-1 · Cited by 66
Kim, H. S., Kweon, J., & Kim, Y. (2024) · Experimental & Molecular Medicine · doi:10.1038/s12276-024-01212-3 · Cited by 68
DENDRO: genetic heterogeneity profiling and subclone detection by single-cell RNA sequencing
Zhou, Z., Xu, B., Minn, A. J., & Zhang, N. R. (2020) · Genome biology · doi:10.1186/s13059-019-1922-x · Cited by 58
ORF Capture-Seq as a versatile method for targeted identification of full-length isoforms
Sheynkman, G., Tuttle, K. S., Laval, F., Tseng, E., Underwood, J. G., Yu, L., Dong, D., Smith, M. L., Sebra, R., Willems, L., et al. (2020) · Nature Communications · doi:10.1038/s41467-020-16174-z · Cited by 55
Self-citationValkiers, S., de Vrij, N., Gielis, S., Verbandt, S., Ogunjimi, B., Laukens, K., & Meysman, P. (2022) · ImmunoInformatics · doi:10.1016/j.immuno.2022.100009 · Cited by 56
High-sensitive spatially resolved T cell receptor sequencing with SPTCR-seq
Benotmane, J. K., Kueckelhaus, J., Will, P., Zhang, J., Ravi, V. M., Joseph, K., Sankowski, R., Beck, J., Lee-Chang, C., Schnell, O., et al. (2023) · Nature Communications · doi:10.1038/s41467-023-43201-6 · Cited by 59
Hegenbarth, J.-C., Lezzoche, G., Windt, L. J. D., & Stoll, M. (2022) · Frontiers in Molecular Medicine · doi:10.3389/fmmed.2022.839338 · Cited by 60
Single-cell RNA-seq methods to interrogate virus-host interactions
Ratnasiri, K., Wilk, A. J., Lee, M. J., Khatri, P., & Blish, C. A. (2022) · Seminars in Immunopathology · doi:10.1007/s00281-022-00972-2 · Cited by 56
RATTLE: reference-free reconstruction and quantification of transcriptomes from Nanopore sequencing
de la Rubia, I., Srivastava, A., Xue, W., Indi, J. A., Sala, S. C., Lagarde, J., Albà, M. M., & Eyras, E. (2022) · Genome biology · doi:10.1186/s13059-022-02715-w · Cited by 50
Li, B., Pei, G., Yao, J., Ding, Q., Jia, P., & Zhao, Z. (2021) · Oncogene · doi:10.1038/s41388-021-01870-x · Cited by 48
Advances in single-cell long-read sequencing technologies
Gupta, P., O’Neill, H., Wolvetang, E. J., Chatterjee, A., & Gupta, I. (2024) · NAR Genomics and Bioinformatics · doi:10.1093/nargab/lqae047 · Cited by 51
Yermanos, A., Agrafiotis, A., Kuhn, R., Robbiani, D., Yates, J., Papadopoulou, C., Han, J., Sandu, I., Weber, C. R., Bieberich, F., et al. (2021) · NAR Genomics and Bioinformatics · doi:10.1093/nargab/lqab023 · Cited by 44
Zeng, L., Yang, K., Zhang, T., Zhu, X., Hao, W., Chen, H., & Ge, J. (2022) · Journal of Autoimmunity · doi:10.1016/j.jaut.2022.102919 · Cited by 47
Diversity in recognition and function of human γδ T cells
Castro, C. D., Boughter, C. T., Broughton, A. E., Ramesh, A., & Adams, E. J. (2020) · Immunological Reviews · doi:10.1111/imr.12930 · Cited by 45
Preneoplastic somatic mutations including MYD88 L265P in lymphoplasmacytic lymphoma
Rodríguez, S., Celay, J., Goicoechea, I., Jiménez, C., Botta, C., Garcia-Barchino, M. J., Garcés, J., Larráyoz, M., Santos, S. A., Alignani, D., et al. (2022) · Science Advances · doi:10.1126/sciadv.abl4644 · Cited by 47
Pokhilko, A. V., Handel, A. E., Curion, F., Volpato, V., Whiteley, E. S., Bøstrand, S. M. K., Newey, S. E., Akerman, C. J., Webber, C., Clark, M. B., et al. (2021) · Genome Research · doi:10.1101/gr.273961.120 · Cited by 43
Challenges and Opportunities in the Clinical Translation of High-Resolution Spatial Transcriptomics
Pentimalli, T. M., Karaiskos, N., & Rajewsky, N. (2024) · Annual Review of Pathology Mechanisms of Disease · doi:10.1146/annurev-pathmechdis-111523-023417 · Cited by 45
Single-cell long-read targeted sequencing reveals transcriptional variation in ovarian cancer
Byrne, A., Le, D., Sereti, K., Menon, H., Vaidya, S., Patel, N., Lund, J. M., Xavier‐Magalhães, A., Shi, M., Liang, Y., et al. (2024) · Nature Communications · doi:10.1038/s41467-024-51252-6 · Cited by 42
Genome annotation: from human genetics to biodiversity genomics
Guigó, R. (2023) · Cell Genomics · doi:10.1016/j.xgen.2023.100375 · Cited by 49
Zhang, Z., Bae, B., Dredge, W. H., & Miura, P. (2023) · Nature Communications · doi:10.1038/s41467-023-41207-8 · Cited by 40
Mikheenko, A., Prjibelski, A. D., Joglekar, A., & Tilgner, H. (2022) · Genome Research · doi:10.1101/gr.276405.121 · Cited by 40
BFF and cellhashR: analysis tools for accurate demultiplexing of cell hashing data
Boggy, G. J., McElfresh, G., Mahyari, E., Ventura, A. B., Hansen, S. G., Picker, L. J., & Bimber, B. N. (2022) · Bioinformatics · doi:10.1093/bioinformatics/btac213 · Cited by 36
Louie, R. H. Y., Cai, C., Samir, J., Singh, M., Deveson, I. W., Ferguson, J. M., Amos, T. G., McGuire, H. M., Gowrishankar, K., Adikari, T. N., et al. (2023) · Nature Communications · doi:10.1038/s41467-023-43656-7 · Cited by 38
Self-citationAdvances in long-read single-cell transcriptomics
Kumari, P., Kaur, M., Dindhoria, K., Ashford, B., Amarasinghe, S. L., & Thind, A. S. (2024) · Human Genetics · doi:10.1007/s00439-024-02678-x · Cited by 37
Long-read sequencing to understand genome biology and cell function
Kraft, F., & Kurth, I. (2020) · The International Journal of Biochemistry & Cell Biology · doi:10.1016/j.biocel.2020.105799 · Cited by 37
Delyon, J., Zuber, J., Dorent, R., Poujol‐Robert, A., Péraldi, M., Anglicheau, D., & Lebbé, C. (2020) · Transplantation · doi:10.1097/tp.0000000000003292 · Cited by 34
Liu, Q., Wang, Z., Jiang, Y., Shao, F., Ma, Y., Zhu, M., Luo, Q., Bi, Y., Cao, L., Peng, L., et al. (2022) · Genes & Diseases · doi:10.1016/j.gendis.2021.12.020 · Cited by 34
Methods for sequence and structural analysis of B and T cell receptor repertoires
Teraguchi, S., Saputri, D. S., Llamas-Covarrubias, M. A., Davila, A., Díez, D., Nazlica, S. A., Rozewicki, J., Ismanto, H. S., Wilamowski, J., Xie, J., et al. (2020) · Computational and Structural Biotechnology Journal · doi:10.1016/j.csbj.2020.07.008 · Cited by 35
Chowdhury, T., Cressiot, B., Parisi, C., Smolyakov, G., Thiébot, B., Trichet, L., Fernandes, F. M., Pelta, J., & Manivet, P. (2023) · ACS Sensors · doi:10.1021/acssensors.2c02308 · Cited by 34
Leveraging the power of long reads for targeted sequencingPreprint
Iyer, S. V., Goodwin, S., & McCombie, W. R. (2024) · Genome Research · doi:10.1101/gr.279168.124 · Cited by 36
Castaldi, P. J., Abood, A., Farber, C. R., & Sheynkman, G. (2022) · Human Molecular Genetics · doi:10.1093/hmg/ddac196 · Cited by 30
Milpied, P., Gandhi, A. K., Cartron, G., Pasqualucci, L., Tarte, K., Nadel, B., & Roulland, S. (2021) · Advances in immunology · doi:10.1016/bs.ai.2021.05.002 · Cited by 31
Heterogeneity of germinal center B cells: New insights from single‐cell studies
Attaf, N., Baaklini, S., Binet, L., & Milpied, P. (2021) · European Journal of Immunology · doi:10.1002/eji.202149235 · Cited by 33
Progress in Plant Genome Sequencing
Henry, R. J. (2022) · Applied Biosciences · doi:10.3390/applbiosci1020008 · Cited by 31
Application of third-generation sequencing in cancer research
Chen, Z., & He, X. (2021) · Medical Review · doi:10.1515/mr-2021-0013 · Cited by 35
Single-cell and long-read sequencing to enhance modelling of splicing and cell-fate determination
Wu, S., & Schmitz, U. (2023) · Computational and Structural Biotechnology Journal · doi:10.1016/j.csbj.2023.03.023 · Cited by 31
Spatial transcriptomics: a new frontier in cancer research
Huang, S., Ouyang, L., Tang, J., Qian, K., Chen, X., Xu, Z., Ming, J., & Xi, R. (2024) · Clinical Cancer Bulletin · doi:10.1007/s44272-024-00018-8 · Cited by 34
Understanding virus–host interactions in tissues
Speranza, E. E. (2023) · Nature Microbiology · doi:10.1038/s41564-023-01434-7 · Cited by 30
Alternative splicing signatures in preimplantation embryo development
Tian, G. G., Li, J., & Wu, J. (2020) · Cell & Bioscience · doi:10.1186/s13578-020-00399-y · Cited by 31
Lyu, M., Wang, S., Gao, K., Wang, L., Zhu, X., Liu, Y., Wang, M., Liu, X., Li, B., & Tian, L. (2021) · Frontiers in Immunology · doi:10.3389/fimmu.2021.779961 · Cited by 33
Quantifying transcriptome diversity: a review
Jones, E. F., Haldar, A., Oza, V. H., & Lasseigne, B. N. (2023) · Briefings in Functional Genomics · doi:10.1093/bfgp/elad019 · Cited by 28
Targeted RNA sequencing enhances gene expression profiling of ultra-low input samples
Curion, F., Handel, A. E., Attar, M., Gallone, G., Bowden, R. J., Cader, M. Z., & Clark, M. B. (2020) · RNA Biology · doi:10.1080/15476286.2020.1777768 · Cited by 29
Rapid Identification and Evaluation of Neoantigen-reactive T-Cell Receptors From Single Cells
Paria, B. C., Levin, N., Lowery, F. J., Pasetto, A., Deniger, D. C., Parkhurst, M. R., Yossef, R., Kim, S. P., Florentin, M., Ngo, L. T., et al. (2020) · Journal of Immunotherapy · doi:10.1097/cji.0000000000000342 · Cited by 26
Arora, J. K., Opasawatchai, A., Poonpanichakul, T., Jiravejchakul, N., Sungnak, W., Sakuntabhai, A., Singhasivanon, P., Suraamornkul, S., Yingtaweesak, T., Manopwisedjaroen, K., et al. (2022) · iScience · doi:10.1016/j.isci.2022.104034 · Cited by 26
Big data-driven precision medicine: Starting the custom-made era of iatrology
Song, C. M., Kong, Y., Huang, L., Luo, H., & Zhu, X. M. (2020) · Biomedicine & Pharmacotherapy · doi:10.1016/j.biopha.2020.110445 · Cited by 27
Single-cell and spatial transcriptomics: Bridging current technologies with long-read sequencing
Yuan, C. U., Quah, F. X., & Hemberg, M. (2024) · Molecular Aspects of Medicine · doi:10.1016/j.mam.2024.101255 · Cited by 30
Revealing the heterogeneity of CD4+ T cells through single-cell transcriptomics
Morgan, D. M., Shreffler, W. G., & Love, J. C. (2022) · Journal of Allergy and Clinical Immunology · doi:10.1016/j.jaci.2022.08.010 · Cited by 26
Belchikov, N., Hsu, J., Li, X. J., Jarroux, J., Hu, W., Joglekar, A., & Tilgner, H. (2024) · Genome Research · doi:10.1101/gr.279640.124 · Cited by 26
Applications of single-cell technologies in drug discovery for tumor treatment
Liu, B., Hu, S., & Wang, X. (2024) · iScience · doi:10.1016/j.isci.2024.110486 · Cited by 24
Young, C., Singh, M., Jackson, K., Field, M. A., Peters, T. J., Angioletti‐Uberti, S., Frenkel, D., Ravishankar, S., Gupta, M., Wang, J. J., et al. (2025) · Immunity · doi:10.1016/j.immuni.2024.12.011 · Cited by 27
Self-citationSingle-Cell RNA Sequencing (scRNA-seq) in Cardiac Tissue: Applications and Limitations
Wang, M., Gu, M., Liu, L., Liu, Y., & Tian, L. (2021) · Vascular Health and Risk Management · doi:10.2147/vhrm.s288090 · Cited by 25
Ebrahimi, G., Orabi, B., Robinson, M., Chauve, C., Flannigan, R. K., & Hach, F. (2022) · iScience · doi:10.1016/j.isci.2022.104530 · Cited by 23
Practical Considerations for Single‐Cell Genomics
Regan, C., & Preall, J. B. (2022) · Current Protocols · doi:10.1002/cpz1.498 · Cited by 27
A current and future perspective on T cell receptor repertoire profiling
Shen, Y., Voigt, A., Leng, X., Rodriguez, A. A., & Nguyen, C. Q. (2023) · Frontiers in Genetics · doi:10.3389/fgene.2023.1159109 · Cited by 24
Metadata
- Authors
- Singh, M., Al-Eryani, G., Carswell, S., Ferguson, J. M., Blackburn, J., Barton, K., Roden, D., Luciani, F., Giang Phan, T., Junankar, S., Jackson, K., Goodnow, C. C., Smith, M. A., & Swarbrick, A.
- Affiliations
- Garvan Institute of Medical Research (AU)
- UNSW Sydney (AU)
- Corresponding author
- Goodnow, Christopher C.
- Smith, Martin A.
- Swarbrick, Alexander
- ORCID
- Venue
- Nature Communications
- Published
- 2019-07-16
- Volume
- 10
- Issue
- 1
- Pages
- 3120-3120
- ISSN
- 2041-1723 (ISSN-L)
- PMC
- PMC6635368
- OpenAlex
- W2958475422
- Cited by
- 308
- References
- 82
- Citations by year
- 2026: 22 · 2025: 30 · 2024: 46 · 2023: 50 · 2022: 60 · 2021: 46 · 2020: 46 · 2019: 7
- FWCI
- 13.73
- Type
- journal article
- Language
- en
- Open access
- gold
- doi.org
- Locations
- Nature Communications (publishedVersion, cc-by)
- bioRxiv (Cold Spring Harbor Laboratory) (acceptedVersion, cc-by-nc-nd)
- Europe PMC (PubMed Central) (publishedVersion, cc-by)
- PubMed Central (publishedVersion, cc-by)
- PubMed (publishedVersion)
- RePEc: Research Papers in Economics (submittedVersion)
- DOAJ (DOAJ: Directory of Open Access Journals) (submittedVersion)
- DOAJ (DOAJ: Directory of Open Access Journals) (submittedVersion, cc-by-sa)
- Funders
- Department of Health | National Health and Medical Research Council
- Topics
- Life Sciences › Biochemistry, Genetics and Molecular Biology › Molecular Biology › Single-cell and spatial transcriptomics
- Life Sciences › Immunology and Microbiology › Immunology › T-cell and B-cell Immunology
- Life Sciences › Biochemistry, Genetics and Molecular Biology › Molecular Biology › Genomics and Phylogenetic Studies
- Keywords
- single-cell RNA sequencing, T cell receptor, B cell receptor, antigen receptor repertoire, alternative splicing, breast cancer, tumor-draining lymph nodes, clonal tracking
- MeSH terms
- Humans, Lymphocytes, Receptors, Antigen, B-Cell, Receptors, Antigen, T-Cell, Sequence Analysis, RNA, Gene Expression Profiling, Single-Cell Analysis, High-Throughput Nucleotide Sequencing, Clonal Evolution, Primary Cell Culture
About these checks
Registry, retraction, Cites and statistics results are computed, not judged, with one exception: a printed reference that no index lists is read once by a model before it counts as a citation error. Claims are extracted by a model and kept only when their quote appears verbatim in the text; each cited source is then checked, with a model’s help, for whether it says what the claim relies on. Those verdicts can be wrong — read the claim’s quote and the cited source before relying on one.
Statistics and arithmetic are recomputed, not judged.
Confidence bands are shown only for fields calibrated on our annotated test set. None is calibrated yet, so no band is shown.
What counts as a claim ›How we measure confidence ›How we check this ›
Are you an author, or do you see a problem with this page? Request a review
