

The DOI matches its Crossref record; 22 of the 22 references it cites were found in a registry or an index.
Mapping histone modifications in low cell number and single cells using antibody-guided chromatin tagmentation (ACT-seq)
Open accessPublished version of a preprint
Abstract
Modern next-generation sequencing-based methods have empowered researchers to assay the epigenetic states of individual cells. Existing techniques for profiling epigenetic marks in single cells often require the use and optimization of time-intensive procedures such as drop fluidics, chromatin fragmentation, and end repair. Here we describe ACT-seq, a streamlined method for mapping genome-wide distributions of histone tail modifications, histone variants, and chromatin-binding proteins in a small number of or single cells. ACT-seq utilizes a fusion of Tn5 transposase to Protein A that is targeted to chromatin by a specific antibody, allowing chromatin fragmentation and sequence tag insertion specifically at genomic sites presenting the relevant antigen. The Tn5 transposase enables the use of an index multiplexing strategy (iACT-seq), which enables construction of thousands of single-cell libraries in one day by a single researcher without the need for drop-based fluidics or visual sorting. We conclude that ACT-seq present an attractive alternative to existing techniques for mapping epigenetic marks in single cells.
Overview
The claims and statistics of this paper haven’t been checked yet.
Run the check — free, no account needed. It reads the open-access text and checks the sources it cites.
Integrity signals
Registry
Cites
Statistics
Figures
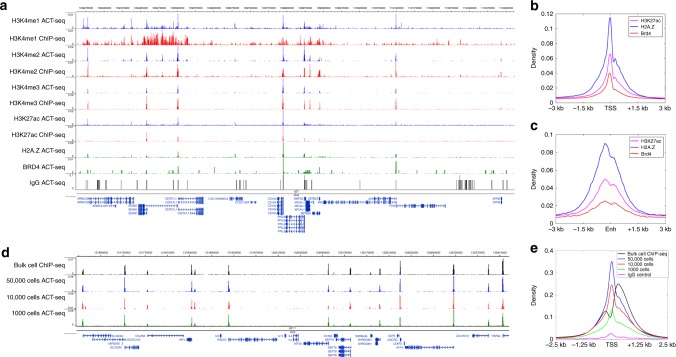
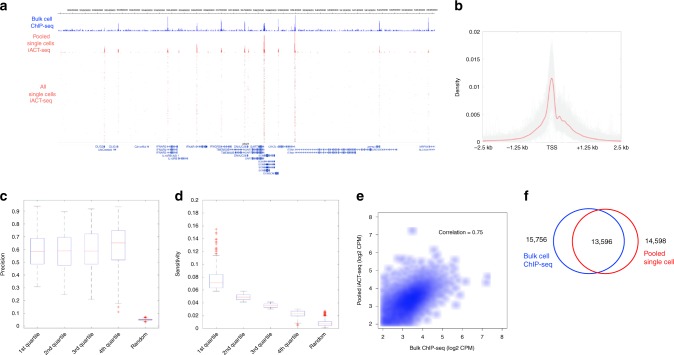
Verification
Claims the paper makes
The claims and statistics of this paper haven’t been checked yet.
Run the check — free, no account needed. It reads the open-access text and checks the sources it cites.
Claims other papers make about this one
Each is checked against this paper’s own text: does it say what the citing paper says it does?
In the citing paper
“However, for highly complex adult organs such as the brain, this single-cell characterization has not been achieved.”
From Single-cell CUT&Tag profiles histone modifications and transcription factors in complex tissues (2021) · cites this paper as [11]
Self-check
Percentages, sums and reported differences re-computed from the paper’s own numbers.
The self-check needs the paper’s full text.
Citations
Cites
Fast gapped-read alignment with Bowtie 2
Langmead, B., & Salzberg, S. L. (2012) · Nature Methods · doi:10.1038/nmeth.1923 · Cited by 56,400
Heinz, S., Benner, C., Spann, N., Bertolino, E., Lin, Y. C., Laslo, P., Cheng, J. X., Murre, C., Singh, H., & Glass, C. K. (2010) · Molecular Cell · doi:10.1016/j.molcel.2010.05.004 · Cited by 13,382
High-Resolution Profiling of Histone Methylations in the Human Genome
Barski, A., Cuddapah, S., Cui, K., Roh, T.-Y., Schones, D. E., Wang, Z., Wei, G., Chepelev, I., & Zhao, K. (2007) · Cell · doi:10.1016/j.cell.2007.05.009 · Cited by 6,845
Self-citationBuenrostro, J. D., Giresi, P. G., Zaba, L. C., Chang, H. Y., & Greenleaf, W. J. (2013) · Nature Methods · doi:10.1038/nmeth.2688 · Cited by 6,422
Software for Computing and Annotating Genomic Ranges
Lawrence, M. F., Huber, W. K., Pagès, H., Aboyoun, P., Carlson, M. R. J., Gentleman, R. C., Morgan, M. T., & Carey, V. J. (2013) · PLoS Computational Biology · doi:10.1371/journal.pcbi.1003118 · Cited by 4,475
Histone H3K27ac separates active from poised enhancers and predicts developmental state
Creyghton, M. P., Cheng, A. W., Welstead, G. G., Kooistra, T., Carey, B. W., Steine, E. J., Hanna, J., Lodato, M. A., Frampton, G. M., Sharp, P. A., et al. (2010) · Proceedings of the National Academy of Sciences · doi:10.1073/pnas.1016071107 · Cited by 4,302
The accessible chromatin landscape of the human genome
Thurman, R. E., Rynes, E., Humbert, R., Vierstra, J., Maurano, M. T., Haugen, E., Sheffield, N. C., Stergachis, A. B., Wang, H., Vernot, B., et al. (2012) · Nature · doi:10.1038/nature11232 · Cited by 2,679
Single-cell chromatin accessibility reveals principles of regulatory variation
Buenrostro, J. D., Wu, B., Litzenburger, U. M., Ruff, D., Gonzales, M. L., Snyder, M. P., Chang, H. Y., & Greenleaf, W. J. (2015) · Nature · doi:10.1038/nature14590 · Cited by 2,308
Single-cell profiling of the developing mouse brain and spinal cord with split-pool barcoding
Rosenberg, A. B., Roco, C. M., Muscat, R. A., Kuchina, A., Sample, P., Yao, Z., Graybuck, L. T., Peeler, D. J., Mukherjee, S., Chen, W., et al. (2018) · Science · doi:10.1126/science.aam8999 · Cited by 1,422
Multiplex single-cell profiling of chromatin accessibility by combinatorial cellular indexing
Cusanovich, D. A., Daza, R., Adey, A., Pliner, H. A., Christiansen, L., Gunderson, K. L., Steemers, F. J., Trapnell, C., & Shendure, J. (2015) · Science · doi:10.1126/science.aab1601 · Cited by 1,248
Cited by
Sorted by citations
Single-cell chromatin state analysis with Signac
Stuart, T., Srivastava, A., Madad, S., Lareau, C. A., & Satija, R. (2021) · Nature Methods · doi:10.1038/s41592-021-01282-5 · Cited by 1,769
Chromatin accessibility profiling by ATAC-seq
Grandi, F. C., Modi, H., Kampman, L., & Corces, M. R. (2022) · Nature Protocols · doi:10.1038/s41596-022-00692-9 · Cited by 557
Single-cell CUT&Tag profiles histone modifications and transcription factors in complex tissues
Bartosovic, M., Kabbe, M., & Castelo-Branco, G. (2021) · Nature Biotechnology · doi:10.1038/s41587-021-00869-9 · Cited by 483
Efficient low-cost chromatin profiling with CUT&Tag
Kaya-Okur, H. S., Janssens, D. H., Henikoff, J. G., Ahmad, K., & Henikoff, S. (2020) · Nature Protocols · doi:10.1038/s41596-020-0373-x · Cited by 425
Epigenetic regulation of T cell exhaustion
Belk, J. A., Dániel, B., & Satpathy, A. T. (2022) · Nature Immunology · doi:10.1038/s41590-022-01224-z · Cited by 346
Metadata
- Authors
- Carter, B., Ku, W. L., Kang, J. Y., Hu, G., Perrie, J., Tang, Q., & Zhao, K.
- Affiliations
- National Institutes of Health (US)
- Corresponding author
- Zhao, Keji
- Venue
- Nature Communications
- Published
- 2019-08-20
- Volume
- 10
- Issue
- 1
- Pages
- 3747-3747
- ISSN
- 2041-1723 (ISSN-L)
- PMC
- PMC6702168
- OpenAlex
- W2969437743
- Cited by
- 148
- References
- 22
- Citations by year
- 2026: 8 · 2025: 16 · 2024: 18 · 2023: 23 · 2022: 29 · 2021: 33 · 2020: 21
- FWCI
- 6.87
- Type
- journal article
- Language
- en
- Update notices
- correction (2020-09-01)
- Open access
- gold
- doi.org
- Locations
- Nature Communications (publishedVersion, cc-by)
- bioRxiv (Cold Spring Harbor Laboratory) (acceptedVersion, cc-by-nc-nd)
- PubMed Central (publishedVersion, cc-by)
- PubMed (publishedVersion)
- RePEc: Research Papers in Economics (submittedVersion)
- DOAJ (DOAJ: Directory of Open Access Journals) (submittedVersion, cc-by-sa)
- DOAJ (DOAJ: Directory of Open Access Journals) (submittedVersion)
- Funders
- National Institutes of Health
- National Heart, Lung, and Blood Institute
- NHLBI Division of Intramural Research
- Topics
- Life Sciences › Biochemistry, Genetics and Molecular Biology › Molecular Biology › Genomics and Chromatin Dynamics
- Life Sciences › Biochemistry, Genetics and Molecular Biology › Molecular Biology › Single-cell and spatial transcriptomics
- Life Sciences › Biochemistry, Genetics and Molecular Biology › Molecular Biology › Epigenetics and DNA Methylation
- Keywords
- histone modifications, single-cell epigenomics, Tn5 transposase, protein A, chromatin fragmentation, histone variants, chromatin-binding proteins
- MeSH terms
- Antibodies, Chromatin, Chromosome Mapping, Histones, Humans, Protein Processing, Post-Translational, Recombinant Fusion Proteins, Staining and Labeling, Staphylococcal Protein A, Sequence Analysis, DNA, Transposases, Histone Code, Chromatin Immunoprecipitation, HEK293 Cells, Epigenomics, Single-Cell Analysis
About these checks
Registry, retraction, Cites and statistics results are computed, not judged, with one exception: a printed reference that no index lists is read once by a model before it counts as a citation error. Claims are extracted by a model and kept only when their quote appears verbatim in the text; each cited source is then checked, with a model’s help, for whether it says what the claim relies on. Those verdicts can be wrong — read the claim’s quote and the cited source before relying on one.
Statistics and arithmetic are recomputed, not judged.
Confidence bands are shown only for fields calibrated on our annotated test set. None is calibrated yet, so no band is shown.
What counts as a claim ›How we measure confidence ›How we check this ›
Are you an author, or do you see a problem with this page? Request a review
