

The DOI matches its Crossref record; 68 of the 68 references it cites were found in a registry or an index.
Meta-analysis of randomised controlled trials testing behavioural interventions to promote household action on climate change
Open accessAbstract
No consensus exists regarding which are the most effective mechanisms to promote household action on climate change. We present a meta-analysis of randomised controlled trials comprising 3,092,678 observations, which estimates the effects of behavioural interventions holding other factors constant. Here we show that behavioural interventions promote climate change mitigation to a very small degree while the intervention lasts ( d = −0.093 95% CI −0.160, −0.055), with no evidence of sustained positive effects once the intervention ends. With the exception of recycling, most household mitigation behaviours show a low behavioural plasticity. The intervention with the highest average effect size is choice architecture (nudges) but this strategy has been tested in a limited number of behaviours. Our results do not imply behavioural interventions are less effective than alternative strategies such as financial incentives or regulations, nor exclude the possibility that behavioural interventions could have stronger effects when used in combination with alternative strategies.
Overview
The claims and statistics of this paper haven’t been checked yet.
Run the check — free, no account needed. It reads the open-access text and checks the sources it cites.
Integrity signals
Registry
Cites
Statistics
Figures
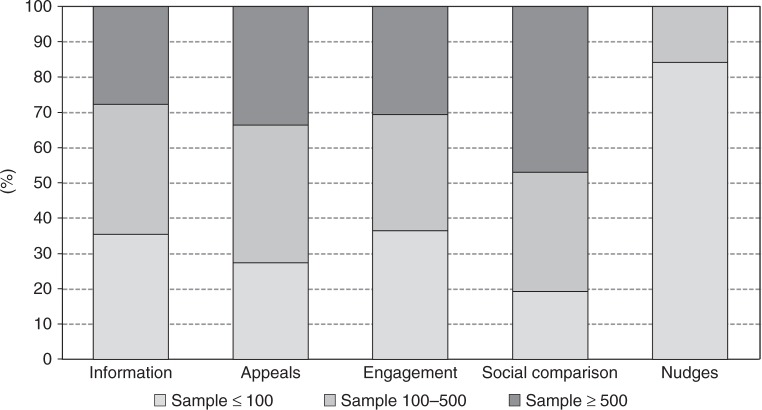
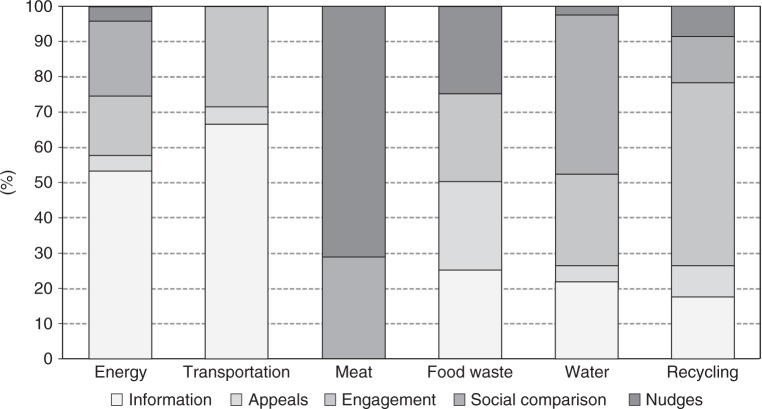
Verification
Claims the paper makes
The claims and statistics of this paper haven’t been checked yet.
Run the check — free, no account needed. It reads the open-access text and checks the sources it cites.
Claims other papers make about this one
Each is checked against this paper’s own text: does it say what the citing paper says it does?
In the citing paper
“Improve options, such as energy-efficient appliances, insulation and prosumer renewables on rooftops, may similarly reduce GHG emissions, combined, by 50% (30-70%) 42,46,47 .”
From Demand-side solutions to climate change mitigation consistent with high levels of well-being (2022) · cites this paper as [46]
Self-check
Percentages, sums and reported differences re-computed from the paper’s own numbers.
The self-check needs the paper’s full text.
Citations
Cites
Preferred Reporting Items for Systematic Reviews and Meta-Analyses: the PRISMA statement
Moher, D., Liberati, A., Tetzlaff, J., Altman, D. G., & for the PRISMA Group (2009) · BMJ · doi:10.1136/bmj.b2535 · Cited by 83,823
Faul, F., Erdfelder, E., Lang, A.-G., & Buchner, A. (2007) · Behavior Research Methods · doi:10.3758/bf03193146 · Cited by 65,971
Preferred reporting items for systematic reviews and meta-analyses: the PRISMA Statement.
(2009) · PubMed Central · Cited by 44,859
Preferred reporting items for systematic reviews and meta-analyses: The PRISMA statement
Moher, D., Liberati, A., Tetzlaff, J., Altman, D. G., & the PRISMA Group* (2009) · Annals of Internal Medicine · doi:10.7326/0003-4819-151-4-200908180-00135 · Cited by 37,554
Quantifying heterogeneity in a meta‐analysis
Higgins, J. P. T., & Thompson, S. G. (2002) · Statistics in Medicine · doi:10.1002/sim.1186 · Cited by 36,763
Cochrane Handbook for Systematic Reviews of Interventions: Cochrane Book Series
(2008) · doi:10.1002/9780470712184 · Cited by 25,048
Nudge: improving decisions about health, wealth, and happiness
(2008) · Choice Reviews Online · doi:10.5860/choice.46-0977 · Cited by 11,624
Developing and evaluating complex interventions: the new Medical Research Council guidance
Craig, P., Dieppe, P., Macintyre, S., Michie, S., Nazareth, I., & Petticrew, M. (2008) · BMJ · doi:10.1136/bmj.a1655 · Cited by 10,995
The United States Department of Agriculture
True, A. C. (1912) · The Annals of the American Academy of Political and Social Science · doi:10.1177/000271621204000113 · Cited by 5,104
Webb, T. L., & Sheeran, P. (2006) · Psychological Bulletin · doi:10.1037/0033-2909.132.2.249 · Cited by 3,732
Research works printed but not linked: 3
- US Department of Energy. Saving Water Saves Energy. Technical Report. https://www.osti.gov/servlets/purl/927020 (2006).
- Steichen, T. J., Egger, M. & Sterne, J. Modification of the metabias program. Stata Tech. Bull. 44, 3 (1998).
- Higgins, J. P. T. & Green, S. Cochrane Handbook for Systematic Reviews of Interventions, Vol. 4. Version 5.1.0 updated March 2011 (The Cochrane Collaboration, 2011).
Cited by
Sorted by citations
Items 301–349 of 349
Surret, F. L., Besomi, S., Chehab, M., Świątkowski, W., Buchs, C., Visintin, E. P., & Butera, F. (2024) · Current Research in Ecological and Social Psychology · doi:10.1016/j.cresp.2024.100207 · Cited by 1
Kesselring, A., Seebauer, S., Skardelly, S., Svetec, E., Nađ, L., Pelka, S., & Preuß, S. (2024) · Energy Efficiency · doi:10.1007/s12053-024-10279-w
Mezzacapo, U., Voltolina, D., Gencarelli, C. N., Esposito, G., Mondini, A. C., Salvati, P., Tondini, S., Carlone, T., Sarretta, A., Galizia, A., et al. (2025) · SSRN Electronic Journal · doi:10.2139/ssrn.5088307
Promoting Sustainable Choices: A Large Scale Randomized Field Experiment *Preprint
Li, L., Tucker, C. E., Yan, R., & wang, R. (2025) · SSRN Electronic Journal · doi:10.2139/ssrn.5127815 · Cited by 1
Freeing the Collective Mind: Making Decisions With or Without Group Biases
Charles, A. (2024) · SpringerBriefs in economics · doi:10.1007/978-3-031-67573-7_3
Gender and Environmental Behavior: Evidence from a Digital Green Initiative *Preprint
Huang, S., Jiang, S., & Liu, Q. (2025) · SSRN Electronic Journal · doi:10.2139/ssrn.5160854
Nisa, C. F., Gu, M., & Bélanger, J. J. (2025) · Communications Earth & Environment · doi:10.1038/s43247-025-02296-z
Self-citationDoes lobbying discourage individuals from fighting climate change?
Epperson, R. (2025) · Journal of Behavioral and Experimental Economics · doi:10.1016/j.socec.2025.102372
Reply to: Individualized cost–benefit analysis does not fit for demand-side mitigation
Tan‐Soo, J., Qin, P., Quan, Y., & Li, J. (2025) · Nature Climate Change · doi:10.1038/s41558-025-02331-z
Brandt, M., & Bamberg, S. (2025) · Frontiers in Psychology · doi:10.3389/fpsyg.2025.1534014
Turning the internet green: A call for environmental psychology to go onlinePreprint
Farrelly, D. (2025) · doi:10.31234/osf.io/k4wvt_v1
Quantifying the value of carbon label information in food choice using drift diffusion modelling
Gan, Y. S., & Hinvest, N. S. (2025) · Journal of Choice Modelling · doi:10.1016/j.jocm.2025.100564
Willing to Act, Failing to Impact: Psychological and Social Drivers of Voluntary Climate ActionPreprint
Kurtis, M., Ockenfels, A., & Rehák, R. (2025) · SSRN Electronic Journal · doi:10.2139/ssrn.5383798
Otten, C. D., States, S. L., & Wong‐Parodi, G. (2025) · Energy Research & Social Science · doi:10.1016/j.erss.2025.104276
Limited Impact of Interventions for Climate Belief: A Systematic Review Assessing Risk of Bias
Cardoso, N. D. O., de Oliveira, T. M., Massarani, L., Tagliapietra, K. D. R., & Machado, W. D. L. (2025) · Trends in Psychology · doi:10.1007/s43076-025-00485-5
Granato, G., & Magnier, L. (2025) · Elsevier eBooks · doi:10.1016/b978-0-443-29139-5.00018-5
Effendy, C., Hampton, S., & Whitmarsh, L. E. (2025) · Journal of Environmental Psychology · doi:10.1016/j.jenvp.2025.102758
Non-technical Aspects of Household Energy Reductions
Moriarty, P., & Honnery, D. (2025) · Springer eBooks · doi:10.1007/978-3-031-84483-6_71
Rethinking the Ocean: Conceptual Engineering for the Next 10,000 Years
Casati, R., Bourgeois‐Gironde, S., Flamme, É., Gallace, A., Hiernaux, Q., Malatesta, S., di Friedberg, M. S., Squarcina, E., de Vargas, C., & Wanek, E. (2025) · Synthese Library/Synthese library · doi:10.1007/978-3-031-98535-5_4
Unpacking the side effects of social norm nudges
Picard, J., & Banerjee, S. (2025) · Ecological Economics · doi:10.1016/j.ecolecon.2025.108844
Tomio, A., & Navajas, J. (2025) · SpringerBriefs in Latin American studies · doi:10.1007/978-3-031-99637-5_5
Yong, M., Xu, Y., von Hagen, A., & Ho, S. S. (2025) · JBI Evidence Synthesis · doi:10.11124/jbies-25-00107
Penn, W. A., & Bauer, A. (2026) · European Journal for Philosophy of Science · doi:10.1007/s13194-025-00708-7
Behavior Change Projects in Zoological Collections: Application of the Behavior Change Wheel
Brinkley, I., Moss, A., Johnson, B., & Counsell, G. (2026) · Zoo Biology · doi:10.1002/zoo.70049
Love thy neighbor – reducing driving through green slot labels in e-commerce
Ytreberg, N. S., & Jordbakke, G. N. (2026) · Transportation Research Part D Transport and Environment · doi:10.1016/j.trd.2026.105252
Seeing animals, choosing plants: Evidence from a cafeteria field study on food choice
Murray, S. C., Meleady, R., & Hodson, G. (2026) · Journal of Environmental Psychology · doi:10.1016/j.jenvp.2026.102988
Wemyss, D. (2026) · Energy Research & Social Science · doi:10.1016/j.erss.2026.104659
Ling, M., Liu, Y., Xu, L., & He, J. (2026) · Journal of Environmental Economics and Management · doi:10.1016/j.jeem.2026.103339
When money is not enough: awareness of future generations drives sustainable development
Testori, M., & Iacono, S. L. (2026) · European Sociological Review · doi:10.1093/esr/jcag014
Hardaker, A., Asanov, I., Bartos̆, F., & Bruns, S. B. (2026) · PNAS Nexus · doi:10.1093/pnasnexus/pgag150
Educational policies can strengthen climate coalitions
Bradley, M., Chazottes, R., Garside, S., & Lopez-Uroz, N. (2026) · Proceedings of the National Academy of Sciences · doi:10.1073/pnas.2533821123
He, B., Peng, S., & Zeng, X. (2026) · Sustainability · doi:10.3390/su18105092
Fresán, U., Bernard, P., Araújo‐Soares, V., Lloyd, S. J., Housni, F., & Chevance, G. (2026) · The Journal of Climate Change and Health · doi:10.1016/j.joclim.2026.100693 · Cited by 5
Xue, Y., Ning, Y., Zhang, Y.-Z., Zhang, S., Zhang, Y.-F., Li, J.-G., Jiang, S.-Q., Sun, D.-J., Tao, L., & Zhang, L. (2026) · Environmental Research Letters · doi:10.1088/1748-9326/ae7815
Rehn, H. J., Sukhov, A., Olsson, L. E., & Friman, M. (2026) · Journal of Environmental Psychology · doi:10.1016/j.jenvp.2026.103093
Baretta, D., Rüttimann, C. L., & Inauen, J. (2026) · Applied Psychology Health and Well-Being · doi:10.1111/aphw.70161
Hudson, J., & Rodrigues, A. (2026) · Oxford Open Climate Change · doi:10.1093/oxfclm/kgag005
Crowther, A., Foulds, C., & Robison, R. (2026) · Futures · doi:10.1016/j.futures.2026.103875
Petre, I. L., Lădaru, R. G., Ion, R. A., Diaconeasa, M. C., & Mocanu, S. (2026) · Agriculture · doi:10.3390/agriculture16121345
Why do recycling interventions fail? A systematic literature review
Heikkinen, S., Isomäki, K., & Salakka-Kontunen, T. (2026) · Sustainable Environment · doi:10.1080/27658511.2026.2679811
Laukka, V., Lehtoranta, V., Kallio, J., & Väisänen, S. (2026) · Journal of Environmental Planning and Management · doi:10.1080/09640568.2026.2701776
Lagomarsino, M., Brosch, T., & Hahnel, U. J. J. (2026) · Energy Research & Social Science · doi:10.1016/j.erss.2026.104854
Lee, J., & Lee, J.-H. (2026) · International Journal of Empirical Economics · doi:10.1142/s2810943026500162
Luo, B., Zhang, T., Bai, Y., & Yan, J. (2026) · Journal of Sustainable Tourism · doi:10.1080/09669582.2026.2733765
The unequal flight: Policy design and public support for carbon taxation of air travel
Pizzo, A., Nielsen, K. R., & Nielsen, K. S. (2026) · Energy Research & Social Science · doi:10.1016/j.erss.2026.104994
Evaluating the role of social capital in land reform: Empirical evidence from rural China
Zhao, S., Arestis, P., & Liu, R. (2026) · Journal of Rural Studies · doi:10.1016/j.jrurstud.2026.104079
Castiglione, A., Brick, C. A., Sach, A. A., Esposito, G., & Bizzego, A. (2026) · Royal Society Open Science · doi:10.1098/rsos.261346
Wise, J., Whitmarsh, L. E., & Hampton, S. (2026) · Transportation Research Part A Policy and Practice · doi:10.1016/j.tra.2026.105196
Metadata
- Authors
- Nisa, C. F., Bélanger, J. J., Schumpe, B. M., & Faller, D. G.
- Affiliations
- New York University Abu Dhabi (AE)
- Corresponding author
- Nisa, Claudia F.
- Venue
- Nature Communications
- Published
- 2019-10-04
- Volume
- 10
- Issue
- 1
- Pages
- 4545-4545
- ISSN
- 2041-1723 (ISSN-L)
- PMC
- PMC6778105
- OpenAlex
- W2978033587
- Cited by
- 349
- References
- 68
- Citations by year
- 2026: 43 · 2025: 63 · 2024: 59 · 2023: 61 · 2022: 53 · 2021: 42 · 2020: 26 · 2019: 1
- FWCI
- 3.93
- Type
- journal article
- Language
- en
- Open access
- gold
- doi.org
- Locations
- Nature Communications (publishedVersion, cc-by)
- PubMed Central (publishedVersion, cc-by)
- PubMed (publishedVersion)
- RePEc: Research Papers in Economics (submittedVersion)
- DOAJ (DOAJ: Directory of Open Access Journals) (submittedVersion, cc-by-sa)
- DOAJ (DOAJ: Directory of Open Access Journals) (submittedVersion)
- Funders
- York University
- Topics
- Physical Sciences › Environmental Science › Management, Monitoring, Policy and Law › Pro-Environmental Behavior and Attitudes
- Social Sciences › Sociology and Political Science › Climate Change Communication and Perception
- Social Sciences › Decision Sciences › General Decision Sciences › Decision-Making and Behavioral Economics
- Keywords
- behavioral interventions, nudging, choice architecture, recycling, behavioral plasticity, intervention effectiveness, sustainable behavior, financial incentives, environmental regulation
- MeSH terms
- Adaptation, Psychological, Family Characteristics, Humans, Motivation, Randomized Controlled Trials as Topic, Behavior Control, Information Dissemination, Climate Change, Recycling
About these checks
Registry, retraction, Cites and statistics results are computed, not judged, with one exception: a printed reference that no index lists is read once by a model before it counts as a citation error. Claims are extracted by a model and kept only when their quote appears verbatim in the text; each cited source is then checked, with a model’s help, for whether it says what the claim relies on. Those verdicts can be wrong — read the claim’s quote and the cited source before relying on one.
Statistics and arithmetic are recomputed, not judged.
Confidence bands are shown only for fields calibrated on our annotated test set. None is calibrated yet, so no band is shown.
What counts as a claim ›How we measure confidence ›How we check this ›
Are you an author, or do you see a problem with this page? Request a review
