

The DOI matches its Crossref record; 79 of the 80 references it cites were found in a registry or an index.
An integrative ENCODE resource for cancer genomics
Open accessPublished version of a preprint
Abstract
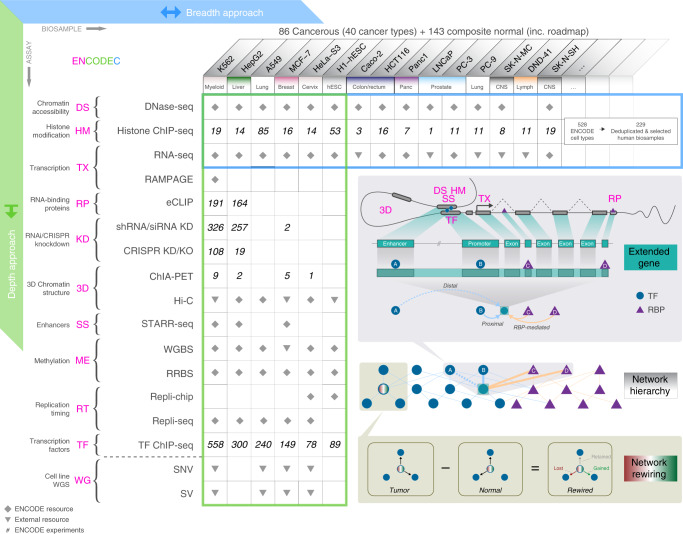
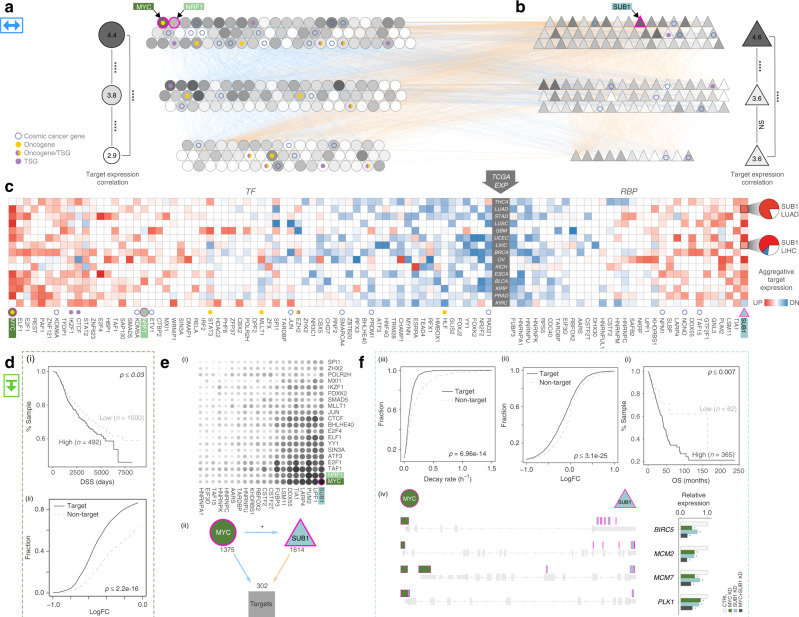
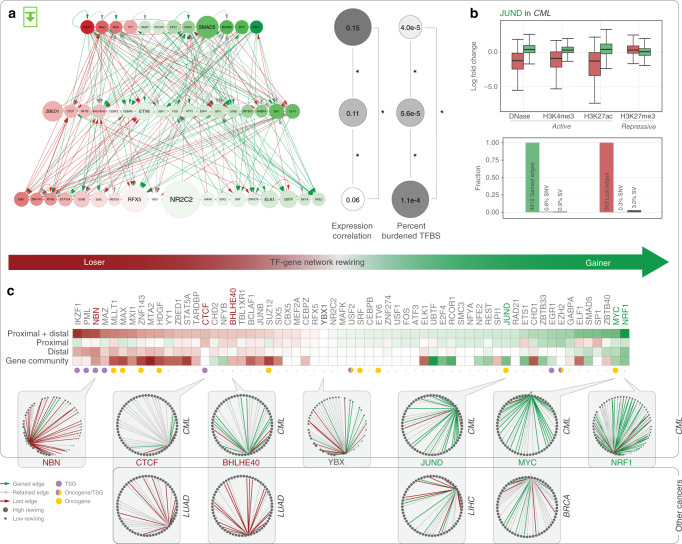
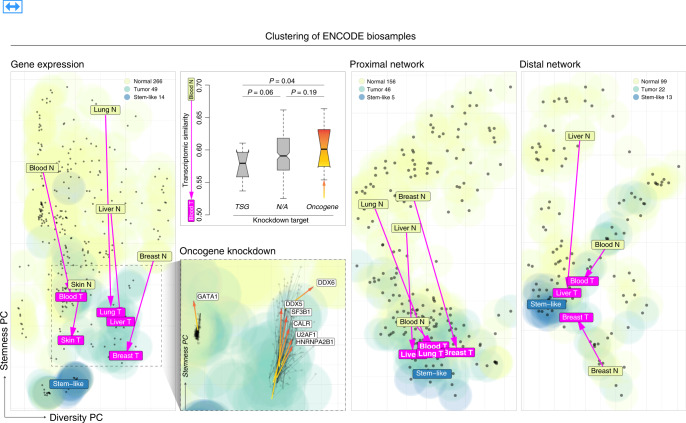
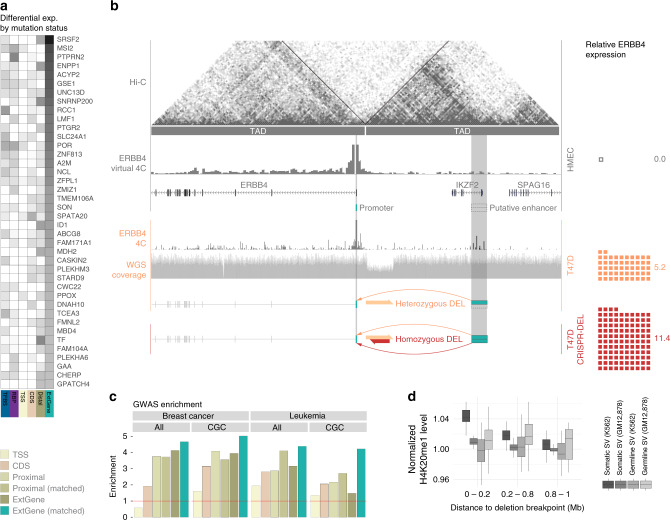
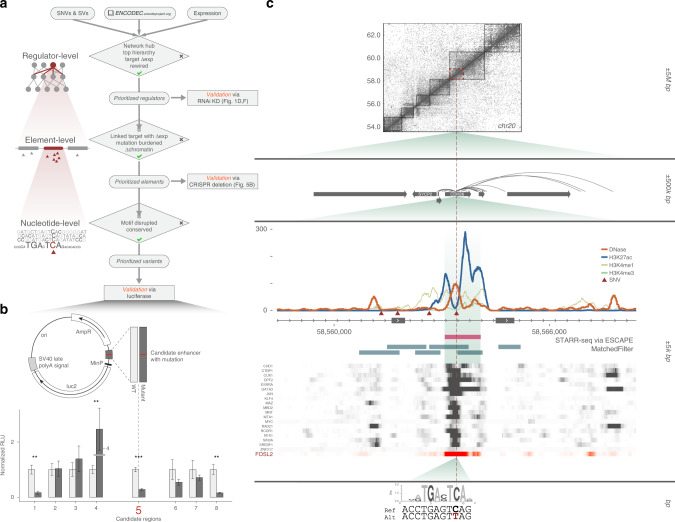
ENCODE comprises thousands of functional genomics datasets, and the encyclopedia covers hundreds of cell types, providing a universal annotation for genome interpretation. However, for particular applications, it may be advantageous to use a customized annotation. Here, we develop such a custom annotation by leveraging advanced assays, such as eCLIP, Hi-C, and whole-genome STARR-seq on a number of data-rich ENCODE cell types. A key aspect of this annotation is comprehensive and experimentally derived networks of both transcription factors and RNA-binding proteins (TFs and RBPs). Cancer, a disease of system-wide dysregulation, is an ideal application for such a network-based annotation. Specifically, for cancer-associated cell types, we put regulators into hierarchies and measure their network change (rewiring) during oncogenesis. We also extensively survey TF-RBP crosstalk, highlighting how SUB1, a previously uncharacterized RBP, drives aberrant tumor expression and amplifies the effect of MYC, a well-known oncogenic TF. Furthermore, we show how our annotation allows us to place oncogenic transformations in the context of a broad cell space; here, many normal-to-tumor transitions move towards a stem-like state, while oncogene knockdowns show an opposing trend. Finally, we organize the resource into a coherent workflow to prioritize key elements and variants, in addition to regulators. We showcase the application of this prioritization to somatic burdening, cancer differential expression and GWAS. Targeted validations of the prioritized regulators, elements and variants using siRNA knockdowns, CRISPR-based editing, and luciferase assays demonstrate the value of the ENCODE resource.
Overview
The claims and statistics of this paper haven’t been checked yet.
Run the check — free, no account needed. It reads the open-access text and checks the sources it cites.
Integrity signals
Registry
Cites
Statistics
Figures
Verification
Claims the paper makes
The claims and statistics of this paper haven’t been checked yet.
Run the check — free, no account needed. It reads the open-access text and checks the sources it cites.
Claims other papers make about this one
Each is checked against this paper’s own text: does it say what the citing paper says it does?
The check wasn’t confident either way, so it gives no verdict — never disputed.
In the citing paper
“STAT3 activation potentiates IL-6 signaling by increasing receptor and ligand levels”
From Dynamic IL-6R/STAT3 signaling leads to heterogeneity of metabolic phenotype in pancreatic ductal adenocarcinoma cells (2024) · cites this paper as [35]
Experimental — accuracy not yet measured
Self-check
Percentages, sums and reported differences re-computed from the paper’s own numbers.
The self-check needs the paper’s full text.
Citations
Cites
Hallmarks of Cancer: The Next Generation
Hanahan, D., & Weinberg, R. A. (2011) · Cell · doi:10.1016/j.cell.2011.02.013 · Cited by 66,590
A global reference for human genetic variation
The 1000 Genomes Project Consortium, authors, C., Auton, A., Abecasis, G. R., Steering committee, Altshuler, D. M., Durbin, R. M., Abecasis, G. R., Bentley, D. R., Chakravarti, A., et al. (2015) · Nature · doi:10.1038/nature15393 · Cited by 18,247
Self-citationAn integrated encyclopedia of DNA elements in the human genome
The ENCODE Project Consortium (2012) · Nature · doi:10.1038/nature11247 · Cited by 18,072
Self-citationVogelstein, B., Papadopoulos, N., Velculescu, V. E., Zhou, S., Diaz, L. A., & Kinzler, K. W. (2013) · Science · doi:10.1126/science.1235122 · Cited by 7,863
Intratumor Heterogeneity and Branched Evolution Revealed by Multiregion Sequencing
Gerlinger, M., Rowan, A. J., Horswell, S., Larkin, J., Endesfelder, D., Gronroos, E., Martinez, P., Matthews, N., Stewart, A., Tarpey, P., et al. (2012) · New England Journal of Medicine · doi:10.1056/nejmoa1113205 · Cited by 7,774
The fundamental role of epigenetic events in cancer
Jones, P. A., & Baylin, S. B. (2002) · Nature Reviews Genetics · doi:10.1038/nrg816 · Cited by 5,648
Mutational heterogeneity in cancer and the search for new cancer-associated genes
Lawrence, M. S., Stojanov, P., Polak, P., Kryukov, G. V., Cibulskis, K., Sivachenko, A., Carter, S. L., Stewart, C., Mermel, C. H., Roberts, S. A., et al. (2013) · Nature · doi:10.1038/nature12213 · Cited by 5,461
Single-cell RNA-seq highlights intratumoral heterogeneity in primary glioblastoma
Patel, A. P., Tirosh, I., Trombetta, J. J., Shalek, A. K., Gillespie, S. M., Wakimoto, H., Cahill, D. P., Nahed, B. V., Curry, W. T., Martuza, R. L., et al. (2014) · Science · doi:10.1126/science.1254257 · Cited by 5,063
Dissecting the multicellular ecosystem of metastatic melanoma by single-cell RNA-seq
Tirosh, I., Izar, B., Prakadan, S. M., Wadsworth, M. H., Treacy, D., Trombetta, J. J., Rotem, A., Rodman, C., Lian, C., Murphy, G., et al. (2016) · Science · doi:10.1126/science.aad0501 · Cited by 4,944
Mutational landscape and significance across 12 major cancer types
Kandoth, C., McLellan, M. D., Vandin, F., Ye, K., Niu, B., Lu, C., Xie, M., Zhang, Q., McMichael, J. F., Wyczalkowski, M. A., et al. (2013) · Nature · doi:10.1038/nature12634 · Cited by 4,419
Cited by
Sorted by citations
Expanded encyclopaedias of DNA elements in the human and mouse genomes
The ENCODE Project Consortium, Abascal, F., Acosta, R., Addleman, N. J., Adrian, J., Afzal, V., Ai, R., Aken, B., Akiyama, J. A., Jammal, O. A., et al. (2020) · Nature · doi:10.1038/s41586-020-2493-4 · Cited by 2,378
Self-citationSystematic evaluation of chromosome conformation capture assays
Oksuz, B. A., Yang, L., Abraham, S., Venev, S. V., Krietenstein, N., Parsi, K. M., Özadam, H., Oomen, M. E., Nand, A., Mao, H. Z., et al. (2021) · Nature Methods · doi:10.1038/s41592-021-01248-7 · Cited by 249
Chromatin alternates between A and B compartments at kilobase scale for subgenic organization
Harris, H. L., Gu, H., Olshansky, M., Wang, A., Farabella, I., Eliaz, Y., Kalluchi, A., Krishna, A., Jacobs, M., Cauer, G., et al. (2023) · Nature Communications · doi:10.1038/s41467-023-38429-1 · Cited by 184
Jin, J., Yu, Y., Wang, R., Zeng, X., Pang, C., Jiang, Y., Li, Z., Dai, Y., Su, R., Zou, Q., et al. (2022) · Genome biology · doi:10.1186/s13059-022-02780-1 · Cited by 154
Efficient chromatin accessibility mapping in situ by nucleosome-tethered tagmentation
Henikoff, S., Henikoff, J. G., Kaya-Okur, H. S., & Ahmad, K. (2020) · eLife · doi:10.7554/elife.63274 · Cited by 155
Machine-guided design of cell-type-targeting cis-regulatory elements
Gosai, S. J., Castro, R. I., Fuentes, N., Butts, J. C., Mouri, K., Alasoadura, M., Kales, S., Nguyen, T. T. L., Noche, R. R., Rao, A. S., et al. (2024) · Nature · doi:10.1038/s41586-024-08070-z · Cited by 142
Co-evolution of tumor and immune cells during progression of multiple myeloma
Liu, R., Gao, Q., Foltz, S. M., Fowles, J. S., Yao, L., Wang, J. T., Cao, S., Sun, H., Wendl, M. C., Sethuraman, S., et al. (2021) · Nature Communications · doi:10.1038/s41467-021-22804-x · Cited by 137
Condensed but liquid-like domain organization of active chromatin regions in living human cells
Nozaki, T., Shinkai, S., Ide, S., Higashi, K., Tamura, S., Shimazoe, M. A., Nakagawa, M., Suzuki, Y., Okada, Y., Sasai, M., et al. (2023) · Science Advances · doi:10.1126/sciadv.adf1488 · Cited by 110
Joglekar, A., Hu, W., Zhang, B., Narykov, O., Diekhans, M., Marrocco, J., Balacco, J., Ndhlovu, L. C., Milner, T. A., Fedrigo, O. D., et al. (2024) · Nature Neuroscience · doi:10.1038/s41593-024-01616-4 · Cited by 126
Radzisheuskaya, A., Shliaha, P. V., Grinev, V. V., Shlyueva, D., Damhofer, H., Koche, R. P., Gorshkov, V., Kovalchuk, S. I., Zhan, Y. A., Rodriguez, K. L., et al. (2021) · Molecular Cell · doi:10.1016/j.molcel.2021.02.012 · Cited by 109
Automated CUT&Tag profiling of chromatin heterogeneity in mixed-lineage leukemia
Janssens, D. H., Meers, M. P., Wu, S. J., Babaeva, E., Meshinchi, S., Sarthy, J. F., Ahmad, K., & Henikoff, S. (2021) · Nature Genetics · doi:10.1038/s41588-021-00941-9 · Cited by 90
Zhang, L., Zhang, J., & Nie, Q. H. (2022) · Science Advances · doi:10.1126/sciadv.abl7393 · Cited by 75
Self-citationThe human pre-replication complex is an open complex.
Li, J. Y., Dong, J., Wang, W., Yu, D.-Q., Fan, X., Hui, Y., Lee, C. S. K., Lam, W.-H., Alary, N., Yang, Y., et al. (2023) · Cell · doi:10.1016/j.cell.2022.12.008 · Cited by 71
Self-citationNetwork-based approaches for modeling disease regulation and progression
Galindez, G., Sadegh, S., Baumbach, J., Kacprowski, T., & List, M. (2022) · Computational and Structural Biotechnology Journal · doi:10.1016/j.csbj.2022.12.022 · Cited by 74
Zhang, L., Nguyen, L. X. T., Chen, Y., Wu, D., Cook, G., Hoang, D. H., Brewer, C., He, X., Dong, H., Li, S., et al. (2021) · Nature Communications · doi:10.1038/s41467-021-26420-7 · Cited by 59
Self-citationNg, N. H. J., Ghosh, S., Bok, C. M., Ching, C., Low, B. S. J., Chen, J. T., Lim, E., Miserendino, M. C., Tan, Y. S., Hoon, S., et al. (2024) · Nature Communications · doi:10.1038/s41467-024-48647-w · Cited by 57
Nakauchi, Y., Azizi, A., Thomas, D., Corces, M. R., Reinisch, A., Sharma, R., Hernandez, D. C., Köhnke, T., Karigane, D., Fan, A. C., et al. (2022) · Blood Cancer Discovery · doi:10.1158/2643-3230.bcd-21-0143 · Cited by 60
Enhancers regulate 3′ end processing activity to control expression of alternative 3′UTR isoforms
Kwon, B., Fansler, M. M., Patel, N. D., Lee, J., Ma, W., & Mayr, C. (2022) · Nature Communications · doi:10.1038/s41467-022-30525-y · Cited by 47
Transcriptionally active enhancers in human cancer cells
Lidschreiber, K., Jung, L. A., von der Emde, H., Dave, K., Taipale, J., Cramer, P., & Lidschreiber, M. (2021) · Molecular Systems Biology · doi:10.15252/msb.20209873 · Cited by 49
Dual-role transcription factors stabilize intermediate expression levels
He, J., Huo, X., Pei, G., Jia, Z., Yan, Y., Yu, J., Qu, H., Xie, Y., Yuan, J., Zheng, Y., et al. (2024) · Cell · doi:10.1016/j.cell.2024.03.023 · Cited by 46
Enhancer reprogramming: critical roles in cancer and promising therapeutic strategies
Yang, J., Zhou, F., Luo, X., Fang, Y., Wang, X., Liu, X., Xiao, R., Jiang, D., Tang, Y., Yang, G., et al. (2025) · Cell Death Discovery · doi:10.1038/s41420-025-02366-3 · Cited by 56
Self-citationSena, L. A., Kumar, R., Sanin, D. E., Thompson, E. A., Rosen, D. M., Dalrymple, S. L., Antony, L., Yang, Y., Gomes‐Alexandre, C., Hicks, J. L., et al. (2022) · Journal of Clinical Investigation · doi:10.1172/jci162396 · Cited by 46
Self-citationPaakinaho, V., Lempiäinen, J. K., Sigismondo, G., Niskanen, E. A., Malinen, M., Jääskeläinen, T. J., Varjosalo, M. T., Krijgsveld, J., & Palvimo, J. J. (2021) · Nucleic Acids Research · doi:10.1093/nar/gkab032 · Cited by 46
Translational remodeling by RNA ‐binding proteins and noncoding RNAs
Ho, J. J. D., Man, J. H. S., Schatz, J. H., & Marsden, P. A. (2021) · Wiley Interdisciplinary Reviews - RNA · doi:10.1002/wrna.1647 · Cited by 45
Increased ACTL6A Occupancy within mSWI/SNF Chromatin Remodelers Drives Human Squamous Cell Carcinoma
Chang, C.-Y., Shipony, Z., Lin, S. G., Kuo, A., Xiong, X., Loh, K. M., Greenleaf, W. J., & Crabtree, G. R. (2021) · Molecular Cell · doi:10.1016/j.molcel.2021.10.005 · Cited by 44
Active enhancers strengthen insulation by RNA-mediated CTCF binding at chromatin domain boundariesPreprint
Islam, Z., Saravanan, B., Walavalkar, K., Farooq, U., Singh, A. K., Sabarinathan, R., Thakur, J., Pandit, A., Henikoff, S., & Notani, D. (2023) · Genome Research · doi:10.1101/gr.276643.122 · Cited by 39
Randomizing the human genome by engineering recombination between repeat elements
Koeppel, J., Ferreira, R., Vanderstichele, T., Riedmayr, L. M., Peets, E. M., Girling, G., Weller, J., Murat, P., Liberante, F. G., Ellis, T., et al. (2025) · Science · doi:10.1126/science.ado3979 · Cited by 40
Targeting Menin disrupts the KMT2A/B and polycomb balance to paradoxically activate bivalent genes
Sparbier, C. E., Gillespie, A., Gomez, J., Kumari, N., Motazedian, A., Chan, K. L., Bell, C. C., Gilan, O., Chan, Y.-C., Popp, S., et al. (2023) · Nature Cell Biology · doi:10.1038/s41556-022-01056-x · Cited by 38
Shi, G., & Thirumalai, D. (2023) · Nature Communications · doi:10.1038/s41467-023-36412-4 · Cited by 34
Hansen, J. L., & Cohen, B. A. (2022) · Genome biology · doi:10.1186/s13059-022-02792-x · Cited by 30
Competition between two HUSH complexes orchestrates the immune response to retroelement invasion
Danac, J. M. C., Matthews, R. E., Gungi, A., Qin, C., Parsons, H. T., Antrobus, R., Timms, R. T., & Tchasovnikarova, I. A. (2024) · Molecular Cell · doi:10.1016/j.molcel.2024.06.020 · Cited by 33
Yousefi, S., Deng, R., Lanko, K., Salsench, E. M., Nikoncuk, A., van der Linde, H. C., Perenthaler, E., van Ham, T. J., Mulugeta, E., & Barakat, T. S. (2021) · Genome Medicine · doi:10.1186/s13073-021-00980-1 · Cited by 25
Non-Coding Variants in Cancer: Mechanistic Insights and Clinical Potential for Personalized Medicine
Lange, M., Begolli, R., & Giakountis, A. (2021) · Non-Coding RNA · doi:10.3390/ncrna7030047 · Cited by 26
Minami, K., Ide, S., Nakazato, K., Kaizu, K., Higashi, K., Tamura, S., Toyoda, A., Takahashi, K., Kurokawa, K., & Maeshima, K. (2025) · Science Advances · doi:10.1126/sciadv.adu8400 · Cited by 28
EZH2 inhibitors promote β-like cell regeneration in young and adult type 1 diabetes donors
Al‐Hasani, K., Marikar, S. N., Kaipananickal, H., Maxwell, S., Okabe, J., Khurana, I., Karagiannis, T., Liang, J. J., Mariana, L., Loudovaris, T., et al. (2023) · Signal Transduction and Targeted Therapy · doi:10.1038/s41392-023-01707-x · Cited by 25
Choi, B., Kang, C. K., Park, S., Lee, D., Lee, A., Ko, Y., Kang, S., Kang, K., Kim, S., Koh, Y., et al. (2022) · Experimental & Molecular Medicine · doi:10.1038/s12276-022-00866-1 · Cited by 27
Self-citationRauner, M., Foessl, I., Formosa, M. M., Kague, É., Prijatelj, V., Alonso, N., Banerjee, B., Bergen, D. J. M., Busse, B., Calado, Â., et al. (2021) · Frontiers in Endocrinology · doi:10.3389/fendo.2021.731217 · Cited by 23
The TRRAP transcription cofactor represses interferon-stimulated genes in colorectal cancer cells
Detilleux, D., Raynaud, P., Pradet‐Balade, B., & Helmlinger, D. (2022) · eLife · doi:10.7554/elife.69705 · Cited by 23
Discovery of novel predisposing coding and noncoding variants in familial Hodgkin lymphoma
Flerlage, J. E., Myers, J. R., Maciaszek, J. L., Oak, N., Rashkin, S. R., Hui, Y., Wang, Y., Chen, W., Wu, G., Chang, T., et al. (2022) · Blood · doi:10.1182/blood.2022016056 · Cited by 23
Self-citationZBTB12 is a molecular barrier to dedifferentiation in human pluripotent stem cells
Han, D., Liu, G., Oh, Y., Oh, S., Yang, S., Mandjikian, L., Rani, N., Almeida, M. C., Kosik, K. S., & Jang, J. (2023) · Nature Communications · doi:10.1038/s41467-023-36178-9 · Cited by 21
Inhibition of pancreatic EZH2 restores progenitor insulin in T1D donor
Al‐Hasani, K., Khurana, I., Mariana, L., Loudovaris, T., Maxwell, S., Kaipananickal, H., Okabe, J., Cooper, M. E., & El‐Osta, A. (2022) · Signal Transduction and Targeted Therapy · doi:10.1038/s41392-022-01034-7 · Cited by 21
CREsted: modeling genomic and synthetic cell-type-specific enhancers across tissues and species
Kempynck, N., Winter, S. D., Blaauw, C. H., Konstantakos, V., Ekşi, E. C., Dieltiens, S., Abaffyová, D., Bercier, V., Taskiran, I. I., Hulselmans, G. J., et al. (2026) · Nature Methods · doi:10.1038/s41592-026-03057-2 · Cited by 29
scSPLAT, a scalable plate-based protocol for single cell WGBS library preparation
Raine, A., Lundmark, A., Annett, A., Wiman, A.-C., Cavalli, M., Wadelius, C., Bergin, C., & Nordlund, J. (2022) · Scientific Reports · doi:10.1038/s41598-022-09798-2 · Cited by 20
Chromatin Mechanisms Driving CancerPreprint
Gryder, B. E., Scacheri, P. C., Ried, T., & Khan, J. I. (2021) · Cold Spring Harbor Perspectives in Biology · doi:10.1101/cshperspect.a040956 · Cited by 20
Zhou, W., Jie, Q., Pan, T., Shi, J., Jiang, T., Zhang, Y., Ding, N., Xu, J., Ma, Y., & Li, Y. (2023) · Communications Biology · doi:10.1038/s42003-023-04457-2 · Cited by 19
Self-citationWray, J. P., Deltcheva, E. M., Böiers, C., Richardson, S. E., Chhetri, J. B., Brown, J., Gagrica, S., Guo, Y., Illendula, A., Martens, J. H. A., et al. (2022) · Nature Communications · doi:10.1038/s41467-022-34653-3 · Cited by 22
Pletenev, I. A., Bazarevich, M., Zagirova, D., Kononkova, A. D., Cherkasov, A. V., Efimova, O., Tiukacheva, E. A., Morozov, K. V., Ulianov, K. A., Komkov, D., et al. (2024) · Nucleic Acids Research · doi:10.1093/nar/gkae271 · Cited by 18
Causes, effects, and clinical implications of perturbed patterns within the cancer epigenome
Oleksiewicz, U., & Machnik, M. (2020) · Seminars in Cancer Biology · doi:10.1016/j.semcancer.2020.12.014 · Cited by 18
Machine-guided design of synthetic cell type-specific cis -regulatory elementsPreprint
Gosai, S. J., Castro, R. I., Fuentes, N., Butts, J. C., Kales, S., Noche, R. R., Mouri, K., Sabeti, P. C., Reilly, S. K., & Tewhey, R. (2023) · bioRxiv (Cold Spring Harbor Laboratory) · doi:10.1101/2023.08.08.552077 · Cited by 18
Machine learning for profile prediction in genomics
Schreiber, J. M., & Singh, R. (2021) · Current Opinion in Chemical Biology · doi:10.1016/j.cbpa.2021.04.008 · Cited by 15
Chen, M., Jia, L., Zheng, X., Han, M., Li, L., & Zhang, L. (2022) · Cancer Research · doi:10.1158/0008-5472.can-22-0290 · Cited by 15
Duan, Z., Dai, Y., Hwang, A., Lee, C.-Y., Xie, K., Xiao, C., Xu, M., Girgenti, M. J., & Zhang, J. (2023) · PLoS Computational Biology · doi:10.1371/journal.pcbi.1011444 · Cited by 15
Self-citationChen, Z., Zhang, J., Liu, J. J., Zhang, Z., Zhu, J., Lee, D., Xu, M., & Gerstein, M. (2021) · Bioinformatics · doi:10.1093/bioinformatics/btaa1039 · Cited by 14
Self-citationSomatic structural variation signatures in pediatric brain tumors
Yang, Y., & Yang, L. (2023) · Cell Reports · doi:10.1016/j.celrep.2023.113276 · Cited by 14
Self-citationCRAMP1 drives linker histone expression to enable Polycomb repression
Matthews, R. E., Danac, J. M. C., Naden, E. L., Smith, L. E. F., Lestari, S., Gungi, A., Appert, A., Buttress, T., Verma, A., Sinclair, O. J., et al. (2025) · Molecular Cell · doi:10.1016/j.molcel.2025.05.031 · Cited by 13
Salviato, E., Djordjilović, V., Hariprakash, J. M., Tagliaferri, I., Pal, K., & Ferrari, F. (2021) · Nucleic Acids Research · doi:10.1093/nar/gkab547 · Cited by 13
Veneti, Z., Fasoulaki, V., Kalavros, N., Vlachos, I. S., Delidakis, C., & Eliopoulos, A. G. (2024) · Nature Communications · doi:10.1038/s41467-024-46119-9 · Cited by 12
Discovery of a MUC3B gene reconstructs the membrane mucin gene cluster on human chromosome 7
Lang, T., & Pelaseyed, T. (2022) · PLoS ONE · doi:10.1371/journal.pone.0275671 · Cited by 11
Poly ADP-ribosylation of SET8 leads to aberrant H4K20 methylation in mammalian nuclear genome
Estève, P., Sen, S., Vishnu, U. S., Ruse, C. I., Chin, H. G., & Pradhan, S. (2022) · Communications Biology · doi:10.1038/s42003-022-04241-8 · Cited by 11
Chen, Z., Zhang, J., Liu, J. J., Dai, Y. Q., Lee, D., Min, M. R., Xu, M., & Gerstein, M. (2021) · Bioinformatics · doi:10.1093/bioinformatics/btab283 · Cited by 12
Self-citationDietzen, M., Zhai, H.-R., Lucas, O., Pich, O., Barrington, C., Lu, W.-T., Ward, S., Guo, Y., Hynds, R. E., Zaccaria, S., et al. (2024) · Nature Communications · doi:10.1038/s41467-024-50107-4 · Cited by 15
The homeodomain of Oct4 is a dimeric binder of methylated CpG elements
Tan, D. S., Cheung, S. L., Gao, Y., Weinbuch, M., Hu, H., Shi, L., Ti, S.-C., Hutchins, A. P., Cojocaru, V., & Jauch, R. (2022) · Nucleic Acids Research · doi:10.1093/nar/gkac1262 · Cited by 11
Matrix stiffness modulates androgen response genes and chromatin state in prostate cancer
Kaarijärvi, R., Kaljunen, H., Niemi, O., Räsänen, M., Paakinaho, V., & Ketola, K. (2025) · NAR Cancer · doi:10.1093/narcan/zcaf010 · Cited by 10
CREATE: cell-type-specific cis-regulatory element identification via discrete embedding
Cui, X., Yin, Q., Gao, Z., Li, Z., Chen, X., Lv, H., Chen, S., Liu, Q., Zeng, W., & Jiang, R. (2025) · Nature Communications · doi:10.1038/s41467-025-59780-5 · Cited by 10
PHF13 epigenetically activates TGFβ driven epithelial to mesenchymal transition
Sun, Y., Li, D., Liu, H., Huang, Y., Meng, F., Tang, J., Li, Z., & Xie, W. (2022) · Cell Death and Disease · doi:10.1038/s41419-022-04940-4 · Cited by 10
Keratin 19 binds and regulates cytoplasmic HNRNPK mRNA targets in triple-negative breast cancer
Fallatah, A., Anastasakis, D. G., Manzourolajdad, A., Sharma, P., Wang, X., Jacob, A., Alsharif, S., Elgerbi, A., Coulombe, P. A., Hafner, M., et al. (2023) · BMC Molecular and Cell Biology · doi:10.1186/s12860-023-00488-z · Cited by 11
Exhaustive identification of genome-wide binding events of transcriptional regulators
Nordin, A., Pagella, P., Zambanini, G., & Cantù, C. (2024) · Nucleic Acids Research · doi:10.1093/nar/gkae180 · Cited by 10
Regulation of Ferroptosis by Transcription Factor E2F1 and RBPreprint
Kuganesan, N., Dlamini, S., Tillekeratne, V. L. M., & Taylor, W. R. (2023) · Research Square · doi:10.21203/rs.3.rs-2493335/v1 · Cited by 10
Liu, Z., & Zheng, Y. (2024) · Discovery Medicine · doi:10.24976/discov.med.202436184.97 · Cited by 10
Blaszczak, W., White, B., Monterisi, S., & Swietach, P. (2024) · Cell Reports · doi:10.1016/j.celrep.2023.113612 · Cited by 9
Albrecht, C., Rajaram, N., Broche, J., Bashtrykov, P., & Jeltsch, A. (2024) · Genes · doi:10.3390/genes15010080 · Cited by 9
Genetic variants affecting RNA stability influence complex traits and disease risk
Huang, E., Fu, T., Zhang, L., Yan, G., Yamamoto, R., Terrazas, S., Nguyen, T. L., Gonzalez‐Figueroa, C., Khanbabaei, A., Bahn, J. H., et al. (2025) · Nature Genetics · doi:10.1038/s41588-025-02326-8 · Cited by 9
Annotating the Insect Regulatory Genome
Asma, H., & Halfon, M. S. (2021) · Insects · doi:10.3390/insects12070591 · Cited by 10
Interplay Between the Histone Variant H2A.Z and the Epigenome in Pancreatic Cancer
Ávila-López, P. A., Núñez-Martínez, H. N., Peralta‐Álvarez, C. A., Martínez‐Calvillo, S., Targa, F. R., & Hernández‐Rivas, R. (2022) · Archives of Medical Research · doi:10.1016/j.arcmed.2022.11.010 · Cited by 10
Cis-regulatory control of transcriptional timing and noise in response to estrogen
Ginley-Hidinger, M., Abewe, H., Osborne, K. S., Richey, A., Kitchen, N., Mortenson, K. L., Wissink, E. M., Lis, J. T., Zhang, X., & Gertz, J. (2024) · Cell Genomics · doi:10.1016/j.xgen.2024.100542 · Cited by 12
DiNeR: a Differential graphical model for analysis of co-regulation Network Rewiring
Zhang, J., Liu, J. J., Lee, D., Lou, S., Chen, Z., Gürsoy, G., & Gerstein, M. (2020) · BMC Bioinformatics · doi:10.1186/s12859-020-03605-3 · Cited by 9
Self-citationDNA-binding affinity and specificity determine the phenotypic diversity in BCL11B-related disorders
Lessel, I., Barešić, A., Chinn, I. K., May, J., Goenka, A., Chandler, K., Posey, J. E., Afenjar, A., Averdunk, L., Bedeschi, M. F., et al. (2025) · The American Journal of Human Genetics · doi:10.1016/j.ajhg.2024.12.012 · Cited by 8
Behaviors of nucleosomes with mutant histone H4s in euchromatic domains of living human cells
Semeigazin, A., Iida, S., Minami, K., Tamura, S., Ide, S., Higashi, K., Toyoda, A., Kurokawa, K., & Maeshima, K. (2024) · Histochemistry and Cell Biology · doi:10.1007/s00418-024-02293-x · Cited by 8
A compendium of genetic variations associated with promoter usage across 49 human tissues
Yuan, J., Tong, Y., Wang, L., Yang, X., Liu, X., Shu, M., Li, Z., Jin, W., Guan, C., Wang, Y., et al. (2024) · Nature Communications · doi:10.1038/s41467-024-53131-6 · Cited by 12
Self-citationZhan, Y., Yıldırım, A., Boninsegna, L., & Alber, F. (2025) · Genome biology · doi:10.1186/s13059-024-03472-8 · Cited by 8
The Glucocorticoid Receptor Inhibits NRF2-Mediated Expression of SLC7A11
Lacher, S. E., Krznarich, J., Levings, D. C., Pathak, S. S., Pufall, M. A., Yang, Y., & Slattery, M. G. (2025) · Free Radical Biology and Medicine · doi:10.1016/j.freeradbiomed.2025.09.008 · Cited by 7
Self-citationAnalyses of Genes Critical to Tumor Survival Reveal Potential ‘Supertargets’: Focus on Transcription
Chetverina, D., Vorobyeva, N. E., Győrffy, B., Shtil, A. A., & Erokhin, M. (2023) · Cancers · doi:10.3390/cancers15113042 · Cited by 10
Loss of synergistic transcriptional feedback loops drives diverse B-cell cancers
Andrews, J. M., Pyfrom, S., Schmidt, J. A., Koues, O. I., Kowalewski, R., Grams, N., Sun, J. J., Berman, L. R., Duncavage, E. J., Lee, Y.-S., et al. (2021) · EBioMedicine · doi:10.1016/j.ebiom.2021.103559 · Cited by 7
Meng, D., Zheng, Q. S., Zhang, X., Piao, X., Luo, L., & Jia, Y. (2022) · Protein & Cell · doi:10.1093/procel/pwac008 · Cited by 7
Yuan, M., Gosztyla, M. L., Tan, X., Dozier, L. E., Wilkinson, B., McKetney, J., Lee, J. J. Y., Chen, M., Tsai, D. S., Kopalle, H., et al. (2025) · Cell Systems · doi:10.1016/j.cels.2025.101204 · Cited by 6
Self-citationKar, R., Sinha, S., Khatun, Z., Sharma, A., & Patil, V. S. (2026) · Science Advances · doi:10.1126/sciadv.ady6423 · Cited by 6
Corleone, G., Sorino, C., Caforio, M., Giovenale, S. D., Nicola, F. D., Goeman, F., Bertaina, V., Pitisci, A., Cortile, C., Locatelli, F., et al. (2024) · Journal of Experimental & Clinical Cancer Research · doi:10.1186/s13046-024-03075-y · Cited by 9
Regulation of ferroptosis by transcription factor E2F1
Kuganesan, N., Dlamini, S., Hasan, S., Tillekeratne, L. M. V., & Taylor, W. R. (2025) · Biochimie · doi:10.1016/j.biochi.2025.06.013 · Cited by 6
Genome-wide analysis of primary microRNA expression using H3K36me3 ChIP-seq data
Turunen, T., de Sande, A. H., Pölönen, P., & Heinäniemi, M. (2021) · Computational and Structural Biotechnology Journal · doi:10.1016/j.csbj.2021.03.035 · Cited by 6
Optimized Repli-seq: improved DNA replication timing analysis by next-generation sequencing
Rivera‐Mulia, J. C., Trevilla‐García, C., & Martinez-Cifuentes, S. (2022) · Chromosome Research · doi:10.1007/s10577-022-09703-7 · Cited by 6
Self-citationActive enhancers strengthen insulation by RNA-mediated CTCF binding at TAD boundariesPreprint
Islam, Z., Saravanan, B., Walavalkar, K., Thakur, J., Farooq, U., Singh, A. K., Sabarinathan, R., Pandit, A., Henikoff, S., & Notani, D. (2021) · bioRxiv (Cold Spring Harbor Laboratory) · doi:10.1101/2021.07.13.452118 · Cited by 7
Buonaiuto, G., Desideri, F., Setti, A., Palma, A., D’Angelo, A., Storari, G., Santini, T., Laneve, P., Trisciuoglio, D., & Ballarino, M. (2025) · Nature Communications · doi:10.1038/s41467-025-62754-2 · Cited by 7
Suita, Y., Bright, H., Pu, Y., Toruner, M. D., Idehen, J., Tapinos, N., & Singh, R. (2025) · PLoS Computational Biology · doi:10.1371/journal.pcbi.1012272 · Cited by 5
Lou, S., Cotter, K. A., Li, T., Liang, J. H., Mohsen, H., Liu, J. J., Zhang, J., Cohen, S. M., Xu, J., Yu, H., et al. (2019) · PLoS Genetics · doi:10.1371/journal.pgen.1007860 · Cited by 4
Self-citationGong, H., Li, M., Ji, M., Zhang, X., Yuan, Z., Zhang, S., Yang, Y., Li, C., & Chen, Y. (2023) · Cell Reports Methods · doi:10.1016/j.crmeth.2022.100386 · Cited by 5
Self-citationHomeotic and nonhomeotic patterns in the tetrapod vertebral formula
Cerbus, R., Hiratani, I., & Kawaguchi, K. (2024) · Proceedings of the National Academy of Sciences · doi:10.1073/pnas.2411421121 · Cited by 5
Elongin functions as a loading factor for Mediator at ATF6α-regulated ER stress response genes
He, Y., Sato, S., Tomomori‐Sato, C., Chen, S., Goode, Z. H., Conaway, J. W., & Conaway, R. C. (2021) · Proceedings of the National Academy of Sciences · doi:10.1073/pnas.2108751118 · Cited by 5
Proteostasis Deregulation by Metabolism Drives the Hallmarks of Cancer
Venkitaraman, A. R. (2026) · Annual Review of Biochemistry · doi:10.1146/annurev-biochem-051424-052148 · Cited by 4
Guo, J., Zhang, W., Chen, X., Yen, A., Chen, L. L., Shively, C. A., Li, D., Wang, T., Dougherty, J. D., & Mitra, R. D. (2024) · Bioinformatics · doi:10.1093/bioinformatics/btae070 · Cited by 4
Hilman, L., Ondičová, M., Caffrey, A., Clements, M., Conway, C., Ward, M., Pentieva, K. D., Irwin, R. E., McNulty, H., & Walsh, C. P. (2024) · BMC Medicine · doi:10.1186/s12916-024-03804-2 · Cited by 5
Metadata
- Authors
- Zhang, J., Lee, D., Dhiman, V., Jiang, P., Xu, J., McGillivray, P., Yang, H., Liu, J., Meyerson, W., Clarke, D., Gu, M., Li, S., Lou, S., Xu, J., Lochovsky, L., Ung, M., Ma, L., Yu, S., Cao, Q., Harmanci, A., Yan, K.-K., Sethi, A., Gürsoy, G., Schoenberg, M. R., Rozowsky, J., Warrell, J., Emani, P., Yang, Y. T., Galeev, T., Kong, X., Liu, S., Li, X., Krishnan, J., Feng, Y., Rivera-Mulia, J. C., Adrian, J., Broach, J. R., Bolt, M., Moran, J., Fitzgerald, D., Dileep, V., Liu, T., Mei, S., Sasaki, T., Trevilla-Garcia, C., Wang, S., Wang, Y., Zang, C., Wang, D., Klein, R. J., Snyder, M., Gilbert, D. M., Yip, K., Cheng, C., Yue, F., Liu, X. S., White, K. P., & Gerstein, M.
- Affiliations
- Yale University (US)
- University of Chicago (US)
- National Institutes of Health (US)
- Northwestern University (US)
- Dartmouth College (US)
- Westlake University (CN)
- Chinese University of Hong Kong (HK)
- The University of Texas Health Science Center at Houston (US)
- Pennsylvania State University (US)
- Florida State University (US)
- Harvard University (US)
- University of Virginia (US)
- University of Wisconsin–Madison (US)
- Icahn School of Medicine at Mount Sinai (US)
- Stanford University (US)
- Corresponding author
- Yue, Feng
- Liu, X. Shirley
- White, Kevin P.
- Gerstein, Mark
- ORCID
- Zhang, Jing
- Lee, Donghoon
- Dhiman, Vineet
- Jiang, Peng
- Xu, Jie
- McGillivray, Patrick
- Yang, Hongbo
- Liu, Jason
- Meyerson, William
- Clarke, Declan
- Gu, Mengting
- Li, Shantao
- Lou, Shaoke
- Xu, Jinrui
- Lochovsky, Lucas
- Ung, Matthew
- Yu, Shan
- Cao, Qin
- Harmanci, Arif
- Sethi, Anurag
- Gürsoy, Gamze
- Rozowsky, Joel
- Warrell, Jonathan
- Emani, Prashant
- Yang, Yucheng T.
- Galeev, Timur
- Liu, Shuang
- Li, Xiaotong
- Feng, Yanlin
- Rivera-Mulia, Juan Carlos
- Adrian, Jessica
- Broach, James R
- Moran, Jennifer
- Fitzgerald, Dominic
- Dileep, Vishnu
- Liu, Tingting
- Mei, Shenglin
- Sasaki, Takayo
- Wang, Su
- Wang, Yanli
- Zang, Chongzhi
- Wang, Daifeng
- Klein, Robert J.
- Snyder, Michael
- Gilbert, David M.
- Yip, Kevin
- Cheng, Chao
- Yue, Feng
- Liu, X. Shirley
- White, Kevin P.
- Gerstein, Mark
- Venue
- Nature Communications
- Published
- 2020-07-29
- Volume
- 11
- Issue
- 1
- Pages
- 3696-3696
- ISSN
- 2041-1723 (ISSN-L)
- PMC
- PMC7391744
- OpenAlex
- W3045759143
- Cited by
- 172
- References
- 80
- Citations by year
- 2026: 23 · 2025: 37 · 2024: 26 · 2023: 24 · 2022: 28 · 2021: 27 · 2020: 5
- FWCI
- 7.46
- Type
- journal article
- Language
- en
- Open access
- gold
- doi.org
- Locations
- Nature Communications (publishedVersion, cc-by)
- bioRxiv (Cold Spring Harbor Laboratory) (acceptedVersion, cc-by-nc-nd)
- PubMed Central (publishedVersion, cc-by)
- PubMed (publishedVersion)
- RePEc: Research Papers in Economics (submittedVersion)
- DOAJ (DOAJ: Directory of Open Access Journals) (submittedVersion, cc-by-sa)
- eScholarship (California Digital Library) (submittedVersion, cc-by)
- Funders
- U.S. Department of Health & Human Services | NIH | National Human Genome Research Institute (U24HG009446)
- Topics
- Life Sciences › Biochemistry, Genetics and Molecular Biology › Molecular Biology › Genomics and Chromatin Dynamics
- Life Sciences › Biochemistry, Genetics and Molecular Biology › Molecular Biology › Chromatin Remodeling and Cancer
- Life Sciences › Biochemistry, Genetics and Molecular Biology › Cancer Research › Cancer-related molecular mechanisms research
- Keywords
- ENCODE, cancer genomics, transcriptional regulatory networks, RNA-binding proteins, network rewiring, carcinogenesis, c-Myc, SUB1, variant prioritization, genome-wide association study, eCLIP, Hi-C, STARR-seq
- MeSH terms
- Cell Transformation, Neoplastic, Humans, Mutation, Neoplasms, Transcription Factors, Reproducibility of Results, Genomics, Databases, Genetic, Cell Line, Tumor, Gene Regulatory Networks
About these checks
Registry, retraction, Cites and statistics results are computed, not judged, with one exception: a printed reference that no index lists is read once by a model before it counts as a citation error. Claims are extracted by a model and kept only when their quote appears verbatim in the text; each cited source is then checked, with a model’s help, for whether it says what the claim relies on. Those verdicts can be wrong — read the claim’s quote and the cited source before relying on one.
Statistics and arithmetic are recomputed, not judged.
Confidence bands are shown only for fields calibrated on our annotated test set. None is calibrated yet, so no band is shown.
What counts as a claim ›How we measure confidence ›How we check this ›
Are you an author, or do you see a problem with this page? Request a review
