

The DOI matches its Crossref record; 56 of the 56 references it cites were found in a registry or an index.
Nanofabrication for all-soft and high-density electronic devices based on liquid metal
Open accessAbstract
Innovations in soft material synthesis and fabrication technologies have led to the development of integrated soft electronic devices. Such soft devices offer opportunities to interact with biological cells, mimicking their soft environment. However, existing fabrication technologies cannot create the submicron-scale, soft transducers needed for healthcare and medical applications involving single cells. This work presents a nanofabrication strategy to create submicron-scale, all-soft electronic devices based on eutectic gallium-indium alloy (EGaIn) using a hybrid method utilizing electron-beam lithography and soft lithography. The hybrid lithography process is applied to a biphasic structure, comprising a metallic adhesion layer coated with EGaIn, to create soft nano/microstructures embedded in elastomeric materials. Submicron-scale EGaIn thin-film patterning with feature sizes as small as 180 nm and 1 μm line spacing was achieved, resulting in the highest resolution EGaIn patterning technique to date. The resulting soft and stretchable EGaIn patterns offer a currently unrivaled combination of resolution, electrical conductivity, and electronic/wiring density.
Overview
The claims and statistics of this paper haven’t been checked yet.
Run the check — free, no account needed. It reads the open-access text and checks the sources it cites.
Integrity signals
Registry
Cites
Statistics
Figures
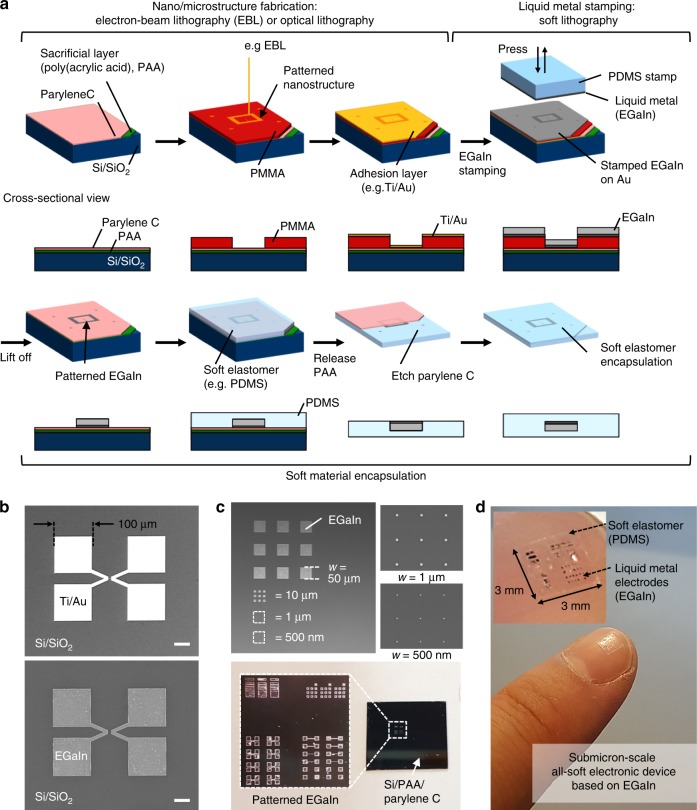
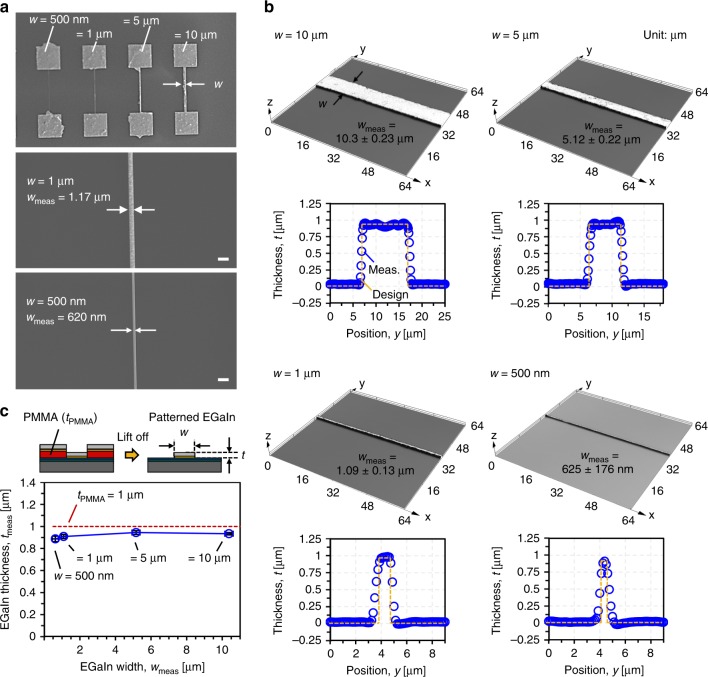
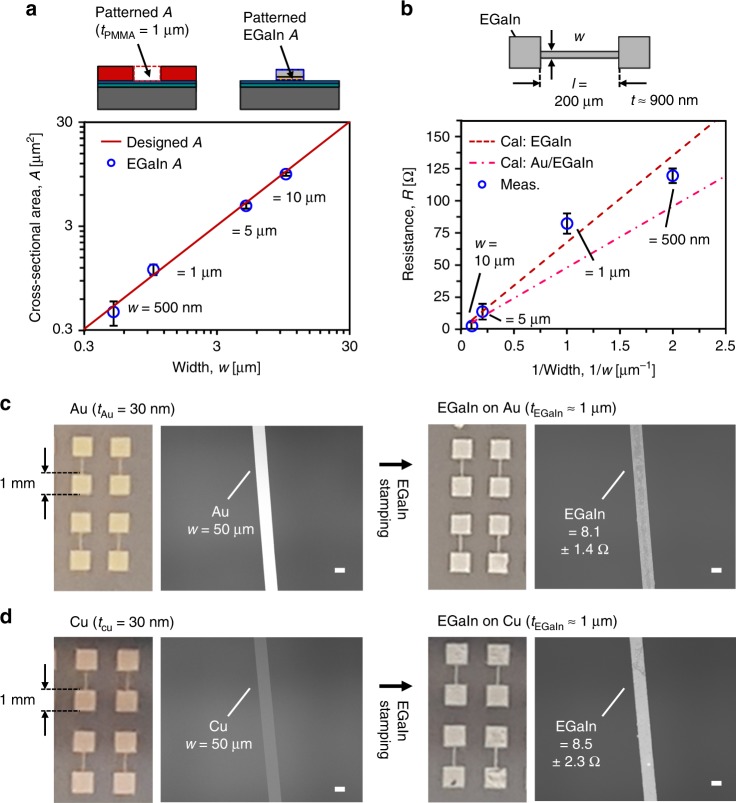
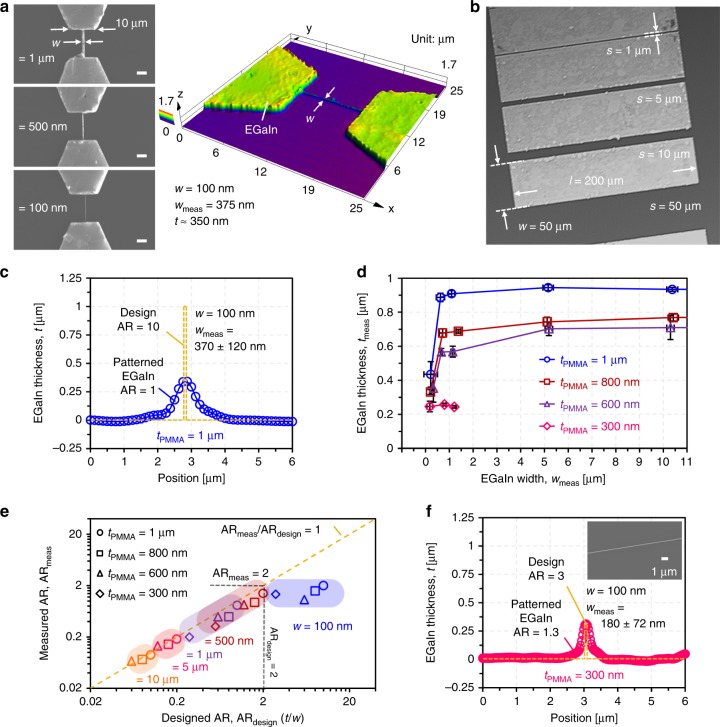
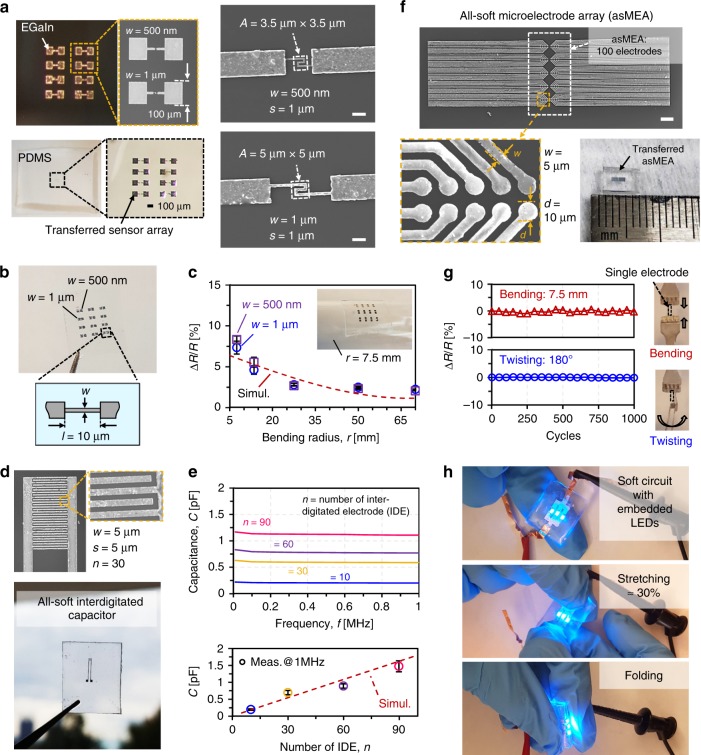
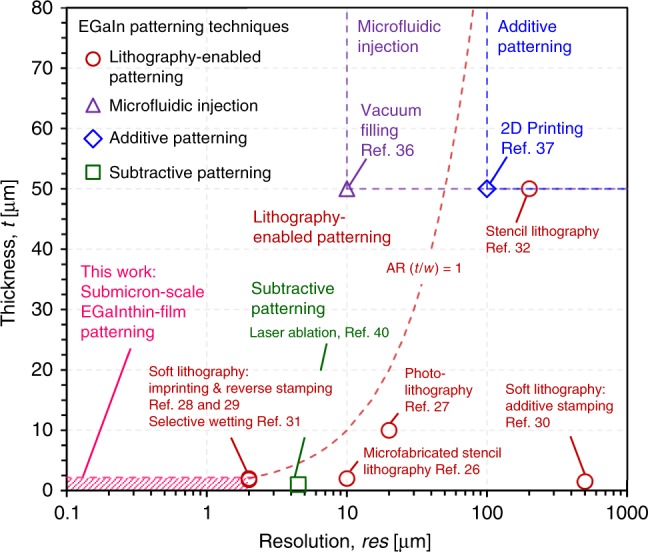
Verification
Claims the paper makes
The claims and statistics of this paper haven’t been checked yet.
Run the check — free, no account needed. It reads the open-access text and checks the sources it cites.
Claims other papers make about this one
Each is checked against this paper’s own text: does it say what the citing paper says it does?
The check wasn’t confident either way, so it gives no verdict — never disputed.
In the citing paper
“We anticipate that the energy consumption can reach 2.64 nJ, outperforming GPU-based inference by more than four orders of magnitude”
From Flexible self-rectifying synapse array for energy-efficient edge multiplication in electrocardiogram diagnosis (2025) · cites this paper as [55]
Experimental — accuracy not yet measured
Self-check
Percentages, sums and reported differences re-computed from the paper’s own numbers.
The self-check needs the paper’s full text.
Citations
Cites
Materials and Mechanics for Stretchable Electronics
Rogers, J. A., Someya, T., & Huang, Y. Y. (2010) · Science · doi:10.1126/science.1182383 · Cited by 5,071
Skin electronics from scalable fabrication of an intrinsically stretchable transistor array
Wang, S., Xu, J., Wang, W., Wang, G. N., Rastak, R., Molina‐Lopez, F., Chung, J. W., Niu, S., Feig, V. R., Lopez, J., et al. (2018) · Nature · doi:10.1038/nature25494 · Cited by 2,216
Stretchable and Soft Electronics using Liquid Metals
Dickey, M. D. (2017) · Advanced Materials · doi:10.1002/adma.201606425 · Cited by 1,807
Stretchable active-matrix organic light-emitting diode display using printable elastic conductors
Sekitani, T., Nakajima, H., Maeda, H., Fukushima, T., Aida, T., Hata, K., & Someya, T. (2009) · Nature Materials · doi:10.1038/nmat2459 · Cited by 1,769
Printing soft matter in three dimensions
Truby, R. L., & Lewis, J. A. (2016) · Nature · doi:10.1038/nature21003 · Cited by 1,635
A Rubberlike Stretchable Active Matrix Using Elastic Conductors
Sekitani, T., Noguchi, Y., Hata, K., Fukushima, T., Aida, T., & Someya, T. (2008) · Science · doi:10.1126/science.1160309 · Cited by 1,369
Bioresorbable silicon electronic sensors for the brain
Kang, S.-K., Murphy, R. K. J., Hwang, S.-W., Lee, S. M., Harburg, D. V., Krueger, N. A., Shin, J., Gamble, P., Cheng, H., Yu, S., et al. (2016) · Nature · doi:10.1038/nature16492 · Cited by 998
Wearable smart sensor systems integrated on soft contact lenses for wireless ocular diagnostics
Kim, J., Kim, M., Lee, M.-S., Kim, K., Ji, S., Kim, Y.-T., Park, J., Na, K., Bae, K.-H., Kyun Kim, H., et al. (2017) · Nature Communications · doi:10.1038/ncomms14997 · Cited by 951
Self-citationTransfer Printing Techniques for Materials Assembly and Micro/Nanodevice Fabrication
Carlson, A., Bowen, A. M., Huang, Y. Y., Nuzzo, R. G., & Rogers, J. A. (2012) · Advanced Materials · doi:10.1002/adma.201201386 · Cited by 927
3D Printing of Free Standing Liquid Metal Microstructures
Ladd, C., So, J., Muth, J. F., & Dickey, M. D. (2013) · Advanced Materials · doi:10.1002/adma.201301400 · Cited by 926
Cited by
Sorted by citations
Items 101–187 of 187
Microchannel pressure sensor for continuous and real-time wearable gait monitoring
Ahn, J., Yoo, B., Pines, D. J., Kuo, C.-Y., Wang, M., Bejjanki, N. S. G., & Kim, S. (2024) · Communications Materials · doi:10.1038/s43246-024-00570-9 · Cited by 16
Hao, C., Chen, J., Chen, Y., Jiang, C., Wang, Z., Pan, T., Cheng, X., & Tian, Y. (2024) · Advanced Composites and Hybrid Materials · doi:10.1007/s42114-024-01160-6 · Cited by 16
Biaxially Stretchable Active‐Matrix Micro‐LED Display with Liquid Metal Interconnects
Park, C., Kim, J., Lee, H., Lee, J., Islam, M. M., Jeong, H., & Jang, J. H. (2023) · Advanced Materials Technologies · doi:10.1002/admt.202301413 · Cited by 15
Materials for flexible and soft brain-computer interfaces, a review
Remy, A., Lin, X., & Jia Liu, B. (2024) · MRS Communications · doi:10.1557/s43579-024-00617-5 · Cited by 15
Zhao, Y., Yang, H., Zhang, Q., Lei, C., Zhou, N., Shi, R., Shi, L., Wu, J., Luo, H., & Mao, H. (2025) · Science China Materials · doi:10.1007/s40843-024-3226-6 · Cited by 15
Liquid‐Metal‐Enabled Materials Design for Soft Electronics
Wang, J., Zhang, C., Zhao, P., Malakooti, M. H., & Pan, C. (2026) · Advanced Functional Materials · doi:10.1002/adfm.202530806 · Cited by 14
Xiang, W., Ye, J., Xing, Z., Zhang, P., Chen, X., Wang, L., & Liu, J. (2023) · ACS Applied Electronic Materials · doi:10.1021/acsaelm.3c00994 · Cited by 14
Liu, Z., Chen, S., Zhang, G., Shi, H., Chen, X., Shi, W., & Liu, L. (2022) · Advanced Materials Interfaces · doi:10.1002/admi.202102121 · Cited by 14
Song, X., Liu, F., Qiu, C., Coy, E. L., Liu, H., Aperador, W. A., Załęski, K., Li, J. J., Song, W., Lu, Z., et al. (2021) · Materials Horizons · doi:10.1039/d0mh01837f · Cited by 14
Kawakami, H., Nagatake, K., Ni, S., Nakamura, F., Takano, T., Murakami, K., Ohara, I., Isano, Y., Matsuda, R., Suwa, H., et al. (2024) · Advanced Materials Technologies · doi:10.1002/admt.202400487 · Cited by 13
DPP‐DTT Nanowire Phototransistors for Optoelectronic Synapses in EMG and ECG Signal Classification
Choi, W., Yoon, J., Lee, W., Hong, G. H., Kim, H., Oh, S., Chun, Y. T., & Yoo, H. (2025) · Small · doi:10.1002/smll.202506440 · Cited by 13
Chambel, A., Sanati, A. L., Lopes, P. A., Nikitin, T., Fausto, R., de Almeida, A. T., & Tavakoli, M. (2021) · Advanced Materials Technologies · doi:10.1002/admt.202101238 · Cited by 12
Avalanche Coalescence of Liquid Metal Particles for Uniform Flexible and Stretchable Electrodes
Park, K., Pyeon, J., Jeong, S. H., Yoon, Y., & Kim, H. (2022) · Advanced Materials Interfaces · doi:10.1002/admi.202201693 · Cited by 12
Corrigan, N. A., Shi, X., & Boyer, C. A. (2023) · ACS Macro Letters · doi:10.1021/acsmacrolett.2c00638 · Cited by 12
Nanocutting mechanism of multi-layered metallic nanowires
Ye, Y., Liu, H., Yan, Y., & Geng, Y. (2026) · International Journal of Machine Tools and Manufacture · doi:10.1016/j.ijmachtools.2026.104376 · Cited by 11
Huang, C., Cheng, T., Wu, C., Chen, K., Wu, T., & Chou, Y. (2024) · Advanced Science · doi:10.1002/advs.202401946 · Cited by 11
Deterministic Fabrication of Liquid Metal Nanopatterns for Nanophotonics Applications
Khan, M. A. K., Zhao, Y., Datta, S., Paul, P., Vasini, S., Thundat, T. G., & Liu, P. Q. (2024) · Small · doi:10.1002/smll.202403722 · Cited by 11
Xie, S.-M., Zhao, X., Peng, L., Yu, P., Zha, X., Ke, K., Bao, R., Yang, M., & Yang, W. M. (2021) · Polymer · doi:10.1016/j.polymer.2021.124482 · Cited by 11
Deposition of Vertically Aligned Ag/Ag2S Nanoflakes on EGaIn Particles for Humidity Sensing
Liu, Y., Yang, L., Chen, Q., Wang, Z., Yang, Z., Cao, J., Wang, X., Li, H., & Huang, X. B. (2022) · Chemistry - A European Journal · doi:10.1002/chem.202200298 · Cited by 11
Fabrication and integration of functional stretchable circuit based on liquid metal
Pan, X., & He, H. (2022) · Journal of Physics D Applied Physics · doi:10.1088/1361-6463/ac7988 · Cited by 10
Progress of biomechanical energy harvesters for wearable electronic applications
Deng, H.-T., Wang, Y.-L., Wen, D.-L., Zhang, X., Huang, P., & Zhang, X. (2022) · Journal of Micromechanics and Microengineering · doi:10.1088/1361-6439/ac7a8f · Cited by 10
Kim, M., Yeon, P., Ruth, S. R. A., Park, J., Lai, J., Zhong, D., Xu, C., Kim, J., Arbabian, A., Fox, P. M., et al. (2026) · Proceedings of the National Academy of Sciences · doi:10.1073/pnas.2528796123 · Cited by 9
Self-citationTuning Surface Morphology of Fluorescent Hydrogels Using a Vortex Fluidic Device
Tavakoli, J., Raston, C. L., & Tang, Y. (2020) · Molecules · doi:10.3390/molecules25153445 · Cited by 8
Lin, Z., Li, J., Lin, S., Zhao, H., Wang, Y., & Bai, H. (2025) · Matter · doi:10.1016/j.matt.2025.102516 · Cited by 7
Liquid metal printed electronics towards ubiquitous electrical engineering
Chen, S., & Liu, J. (2022) · Japanese Journal of Applied Physics · doi:10.35848/1347-4065/ac5761 · Cited by 7
Plasmonic properties of silver coated non-spherical gallium alloy nanoparticles
Bhardwaj, A., Bhatia, P., & Verma, S. S. (2022) · Optical and Quantum Electronics · doi:10.1007/s11082-022-04321-3 · Cited by 7
Crawford, J., Sayeed, M. A., & O'Mullane, A. P. (2021) · Colloids and Surfaces A Physicochemical and Engineering Aspects · doi:10.1016/j.colsurfa.2021.126750 · Cited by 7
Awasthi, S., & Kang, S. (2024) · Materials Today Advances · doi:10.1016/j.mtadv.2024.100544 · Cited by 6
Advances in Microfluidic Cochlea‐On‐A‐Chip
Shen, T., Han, S., He, W., Yang, W., Tang, X., Zhao, X., Liu, X., Shao, Z., Cheng, L., Zhao, Y., et al. (2024) · Advanced Science · doi:10.1002/advs.202406077 · Cited by 7
Patterned microarrays or nanoscale assemblies for optical sensing of biomarkers
Lu, X., & Li, Z. (2024) · TrAC Trends in Analytical Chemistry · doi:10.1016/j.trac.2024.117873 · Cited by 6
A universally adaptable micropatterning method through laser-induced wettability inversion
Zhang, L., Salomons, T. T., Reddy, D. O., Hillen, P., & Oleschuk, R. D. (2023) · Sensors and Actuators B Chemical · doi:10.1016/j.snb.2023.133983 · Cited by 6
Im, S., & Kim, M. (2024) · Proceedings of IEEE Sensors/Proceedings of IEEE Sensors ... · doi:10.1109/sensors60989.2024.10784953 · Cited by 5
Self-citationDeng, L., Zhang, J., Yue, Z., Li, Z., Yuan, Y., & Ding, H. (2024) · IEEE Transactions on Instrumentation and Measurement · doi:10.1109/tim.2024.3449931 · Cited by 6
A Subtractive Method to Chemically Pattern Liquid Metal for Stretchable Circuits
Sumaria, K. J., & Liu, T. “. (2024) · Advanced Materials Technologies · doi:10.1002/admt.202401200 · Cited by 5
Kim, J., So, J., & Koo, H. (2024) · Materials · doi:10.3390/ma17215299 · Cited by 5
Stretchable electronics based on inorganic semiconducting materials
Kang, S., Jo, J., Kim, J., & Park, S. K. (2024) · Journal of Materials Chemistry C · doi:10.1039/d4tc03745f · Cited by 6
Versatile Contact Engineering on β‐Ga2O3 Using EGaIn for Schottky Diodes and MESFET Applications
Kim, G. S., Choi, J. H., Kim, M., Kang, J., & Lee, Y. T. (2025) · Advanced Electronic Materials · doi:10.1002/aelm.202500332 · Cited by 4
Self-citationIntrinsically Soft Printed Electronics for Digitally Augmented Human Sensing and Vision
Zavanelli, N., Carneiro, M. R., Vinciguerra, M. R., Patel, D. K., Sue, G. N., Fu, Y., Tavakoli, M., & Majidi, C. (2025) · Advanced Functional Materials · doi:10.1002/adfm.202519702 · Cited by 4
Convergence of Soft Electronics and Artificial Intelligence: From Materials to Intelligent Systems
Park, H., Choi, G., Yoon, S., Lee, D., & Ko, S. H. (2026) · Nano-Micro Letters · doi:10.1007/s40820-026-02265-x · Cited by 5
A liquid metal-based process for tuning the thermoelectric properties of bismuth indium systems
Widjajana, M. S., Chiu, S., Chi, Y., Baharfar, M., Zheng, J., Ghasemian, M. B., Bhattacharyya, S., Tang, J., Rahim, M. A., & Kalantar‐Zadeh, K. (2023) · Journal of Materials Chemistry C · doi:10.1039/d3tc01922e · Cited by 4
Yu, C., Cho, H., Lee, W.-S., Jo, J., Kim, H., & Chang, W. S. (2024) · ACS Applied Electronic Materials · doi:10.1021/acsaelm.3c01500 · Cited by 4
Rigid and soft microelectrodes for electrophysiology measurement
Gong, H., Weng, W., Zhang, S., Gao, Z., & Hu, N. (2025) · Current Opinion in Biomedical Engineering · doi:10.1016/j.cobme.2025.100591 · Cited by 4
High-Performance Four-Channel Tactile Sensor for Measuring the Magnitude and Orientation of Forces
Zhang, M. Y., Shi, Y., Ge, H., Sun, G., Lian, Z., & Lu, Y. (2024) · Sensors · doi:10.3390/s24092808 · Cited by 3
Shaping Magnetic Liquid Metals Into 3D Leakage‐Free, Shape‐Programmable Structures and Electronics
Lu, Y., Wang, Z., Abdulla, V., Pfund, J. D., Lu, S., Li, Y., Zhang, X., Fennell, G., Zhang, Y., Jain, M., et al. (2025) · Advanced Electronic Materials · doi:10.1002/aelm.202500166 · Cited by 3
Shin, S., Cho, J., Lee, T., Park, J., & Kim, M. (2025) · Bulletin of the Korean Chemical Society · doi:10.1002/bkcs.70070 · Cited by 3
Self-citationPan, R., Liu, D., Cao, A., Zhang, W., Yao, Y., Gong, Y. H., Chen, L., Li, Y., & Tian, X. (2025) · Nano Letters · doi:10.1021/acs.nanolett.5c03578 · Cited by 3
Preparation of array-patterned anisotropic conductive films using magnetic polystyrene microspheres
Hao, C., Jiang, C., Chen, J., Zhang, X., Xiang, Y., Lou, F., Cheng, X., & Tian, Y. (2025) · Progress in Organic Coatings · doi:10.1016/j.porgcoat.2025.109695 · Cited by 3
Liu, M., Shi, J., Zhang, T., Li, M., Zhang, Y., Zhang, R., Zhang, Y., Yang, B., Fan, J., & Yu, K. (2025) · Surfaces and Interfaces · doi:10.1016/j.surfin.2025.107969 · Cited by 3
Park, C., Kim, D. H., You, W., Jang, J., Choi, H., Chang, S., Joo, D., Kim, Y., Ha, J., Lee, D., et al. (2026) · Nature Materials · doi:10.1038/s41563-026-02627-1 · Cited by 3
Performance analysis of coupled thermal-electric current transmission by liquid metal
Liu, C.-K., Li, M., Ma, S., Liu, X.-Y., Cao, L., & He, Z. (2025) · Energy Conversion and Management · doi:10.1016/j.enconman.2025.119539 · Cited by 3
Low-loss liquid metal interconnects for superconducting quantum circuits
Yao, Z., Sandberg, M., Abraham, D. W., & Bishop, D. J. (2024) · Applied Physics Letters · doi:10.1063/5.0211244 · Cited by 3
Flexible multilayered skin health sensing platform for eyewear applications
Park, B., Lee, S., Song, Y.-H., Yeon, P., & Kim, M. (2025) · Micro and Nano Systems Letters · doi:10.1186/s40486-025-00226-4 · Cited by 3
Self-citationChen, K., Qin, Y., Wang, X., Zhao, X., Luo, F., & Huang, W. (2025) · Applied Materials Today · doi:10.1016/j.apmt.2025.102812 · Cited by 2
Eutectic Gallium–Indium in Fabricating and Integrating Molecular Devices
Xie, Y., Cao, Z., Peng, W., & Li, Y. (2025) · Advanced Materials Technologies · doi:10.1002/admt.202500674 · Cited by 2
Jung, Y., Yoon, S., Lee, Y., Do, T., Kim, K., Jung, K., & Choi, J. (2024) · Small · doi:10.1002/smll.202400828 · Cited by 2
Fabrication of Liquid Metal-Based Flexible Electronics
Guo, R. (2024) · Springer eBooks · doi:10.1007/978-981-19-2797-3_19-1 · Cited by 1
Zhang, X., Zhang, X., Jin, G., Liu, B., Yun, J., & Cao, D. (2025) · Materials Chemistry Frontiers · doi:10.1039/d5qm00507h · Cited by 1
Rahman, M. S., & Scheideler, W. J. (2025) · Advanced Electronic Materials · doi:10.1002/aelm.202500367 · Cited by 1
Liquid Metal Micro-Nano Processing and Flexible Electronic Sensors
Ma, X., Guo, J., & Chen, W. (2025) · Springer eBooks · doi:10.1007/978-981-96-4990-7_8 · Cited by 1
Kim, Y., Song, S., Kim, H. H., Choi, J., Yoo, J., Yun, E., Yu, C., Son, H. Y., Cha, C., Kwon, M. S., et al. (2026) · ACS Applied Materials & Interfaces · doi:10.1021/acsami.5c22275 · Cited by 1
Orchestrating the post‑silicon revolution of electronics through material-enabled intelligence
Wang, B., Li, X., Yu, L., & Lu, Y. (2026) · Chemical Engineering Journal · doi:10.1016/j.cej.2026.175242 · Cited by 1
Muller, B. N., Patel, A. J., Traverso, G., & Hashmi, S. M. (2026) · Small · doi:10.1002/smll.73329 · Cited by 1
Hwang, J., KIM, J., Kim, K., Jeong, P., Jo, Y., Kim, D. Y., Kim, T., Jung, S., Jeong, S., Kim, H., et al. (2026) · Chemical Engineering Journal · doi:10.1016/j.cej.2026.176341 · Cited by 1
Kim, G. S., Kim, S. Y., Song, B. J., Lee, H. Y., Kang, J., & Lee, Y. T. (2026) · ACS Applied Electronic Materials · doi:10.1021/acsaelm.6c00302 · Cited by 1
Xiao, Y., Zhu, J., Dutta, A., Song, C., Zhang, Y., Huang, C., Li, G., Zhang, S., Qiu, D., Zhong, J., et al. (2026) · Science Advances · doi:10.1126/sciadv.aed4474 · Cited by 1
EGaIn-based liquid-metal electrodes for electronic interfaces and contact engineering
Kim, G. S., Lee, H. Y., Bang, M., Mun, S., Lee, Y. T., Park, B., & Kang, J. (2026) · iScience · doi:10.1016/j.isci.2026.117626 · Cited by 1
Guo, Q., Zhang, H., Zhao, H., Ding, Y., Hu, Y., Shu, Z., Wen, X., Deng, S., Wang, T., & Du, W. (2024) · Nano Letters · doi:10.1021/acs.nanolett.4c02523 · Cited by 1
Ma, X., Xu, Z., Jin, D., Liu, S., Li, G., Guo, Z., Li, Z., Xiong, C., & Xu, Z. (2024) · Research Square · doi:10.21203/rs.3.rs-3909065/v1 · Cited by 1
Liquid Metal-Filled 3D Structure Wearable Sensor for Finger Bending Monitoring
Li, G., Zhang, M., Wu, J., Yuan, M., Liu, Z., & Ma, X. (2021) · IEEE International Conference on e-Health Networking, Applications and Services (Healthcom) · doi:10.1109/healthcom49281.2021.9399042
Liquid Metal Toward Flexible Electronics
Fu, L., & Zeng, M. (2022) · Wiley eBooks · doi:10.1002/9783527828784.ch7
Constructing Techniques of Liquid Metal‐Based Architectures
Fu, L., & Zeng, M. (2022) · doi:10.1002/9783527828784.ch6
Pyun, S. B., Song, J. E., & Cho, E. C. (2022) · Advanced Materials Interfaces · doi:10.1002/admi.202200228
Using room-temperature liquid metals as a new reaction environment
Crawford, J. F. (2022) · Queensland University of Technology · doi:10.5204/thesis.eprints.232783
Li, Y., Cao, Z., Xie, Y., Lin, J., Zhong, S., Yang, Z., Zhou, Z., Peng, W., & Qiu, S. (2023) · Research Square · doi:10.21203/rs.3.rs-2955772/v1
Chen, S. (2024) · Springer eBooks · doi:10.1007/978-981-19-2797-3_8-1
Fabrication of Liquid Metal-Based Flexible Electronics
Guo, R. (2024) · Springer eBooks · doi:10.1007/978-981-97-1614-2_19
Chen, S. (2024) · Springer eBooks · doi:10.1007/978-981-97-1614-2_8
Design and Application of a Novel Gesture-Sensing Skeleton Integrated With CNF/CB/Ecoflex Sensors
Zhang, M. Y., Shi, Y., Wei, Y., Mao, X., Li, H., & Wang, G. (2025) · IEEE Sensors Journal · doi:10.1109/jsen.2025.3531387
Ze, Y., Sun, H., & Huang, W. (2025) · Chemistry - An Asian Journal · doi:10.1002/asia.202500829
Kim, Y., Kim, M., Kim, G., Jang, J., Yun, G., Song, J. T., Jamal, A., Gereige, I., Jung, W., & Jung, H. (2025) · ACS Nano · doi:10.1021/acsnano.5c08137
Self-citationSeo, D., Jeong, S., & Kim, H. (2025) · Journal of the Korean Society for Precision Engineering · doi:10.7736/jkspe.d.25.00003
Minagawa, M., Sakai, A., & Matsuhisa, N. (2026) · Japanese Journal of Applied Physics · doi:10.35848/1347-4065/ae6c7b
Wang, S., Lee, H.-E., Lin, H.-C., Samoylov, A., Sheth, M. S., Liu, J.-H., Harish, V., & Iyer, S. S. (2026) · IEEE Electronic Components and Technology Conference (ECTC) · doi:10.1109/ectc51846.2026.00031
A review of liquid metal patterning methodologies: principles, structures and applications
Xu, Z., Jin, D., Xu, Z., & Ma, X. (2026) · Progress in Materials Science · doi:10.1016/j.pmatsci.2026.101797
Surface Morphology of Laser-Assisted Nanomachining of Silicon Carbide
Ren, J., Zhang, P., & Zhang, Z. (2026) · Journal of Manufacturing and Materials Processing · doi:10.3390/jmmp10090320
Wu, G., Gan, W., Han, J., Liu, Z., Chen, C., Li, R., Li, C., Li, W., & Gao, L. (2026) · Micromachines · doi:10.3390/mi17091018
Pan, R., Liu, D., Zhang, W., Yao, Y., Li, J., Zhang, J., Yu, J., Gong, Y., Deng, Y., Meng, X., et al. (2026) · Chemical Engineering Journal · doi:10.1016/j.cej.2026.183642
Metadata
- Authors
- Kim, M.-G., Brown, D. K., & Brand, O.
- Affiliations
- Georgia Institute of Technology (US)
- Corresponding author
- Brand, Oliver
- Venue
- Nature Communications
- Published
- 2020-02-21
- Volume
- 11
- Issue
- 1
- Pages
- 1002-1002
- ISSN
- 2041-1723 (ISSN-L)
- PMC
- PMC7035367
- OpenAlex
- W3008821181
- Cited by
- 186
- References
- 56
- Citations by year
- 2026: 17 · 2025: 33 · 2024: 40 · 2023: 33 · 2022: 33 · 2021: 21 · 2020: 9
- FWCI
- 8.24
- Type
- journal article
- Language
- en
- Open access
- gold
- doi.org
- Locations
- Nature Communications (publishedVersion, cc-by)
- Europe PMC (PubMed Central) (publishedVersion, cc-by)
- PubMed Central (publishedVersion, cc-by)
- PubMed (publishedVersion)
- RePEc: Research Papers in Economics (submittedVersion)
- DOAJ (DOAJ: Directory of Open Access Journals) (submittedVersion, cc-by-sa)
- Funders
- National Science Foundation (1711259, 1542174)
- Georgia Institute of Technology (ECCS-1542174)
- Division of Electrical, Communications and Cyber Systems (1542174, ECCS 1542174, 1711259)
- Topics
- Physical Sciences › Engineering › Electrical and Electronic Engineering › Nanomaterials and Printing Technologies
- Physical Sciences › Materials Science › Surfaces, Coatings and Films › Nanofabrication and Lithography Techniques
- Physical Sciences › Engineering › Electrical and Electronic Engineering › Advancements in Photolithography Techniques
- Keywords
- eutectic gallium-indium alloy, liquid metal electronics, soft electronics, nanofabrication, submicron patterning, elastomeric substrates, stretchable electronics, high-density electronics
- MeSH terms
- Alloys, Electric Conductivity, Electronics, Equipment Design, Gallium, Indium, Metals, Printing, Surface Properties, Elastomers, Nanotechnology, Electrical Equipment and Supplies, Manufacturing Industry
About these checks
Registry, retraction, Cites and statistics results are computed, not judged, with one exception: a printed reference that no index lists is read once by a model before it counts as a citation error. Claims are extracted by a model and kept only when their quote appears verbatim in the text; each cited source is then checked, with a model’s help, for whether it says what the claim relies on. Those verdicts can be wrong — read the claim’s quote and the cited source before relying on one.
Statistics and arithmetic are recomputed, not judged.
Confidence bands are shown only for fields calibrated on our annotated test set. None is calibrated yet, so no band is shown.
What counts as a claim ›How we measure confidence ›How we check this ›
Are you an author, or do you see a problem with this page? Request a review
