

The DOI matches its Crossref record; 70 of the 70 references it cites were found in a registry or an index.
Analysis of cardiac magnetic resonance imaging in 36,000 individuals yields genetic insights into dilated cardiomyopathy
Open accessAbstract
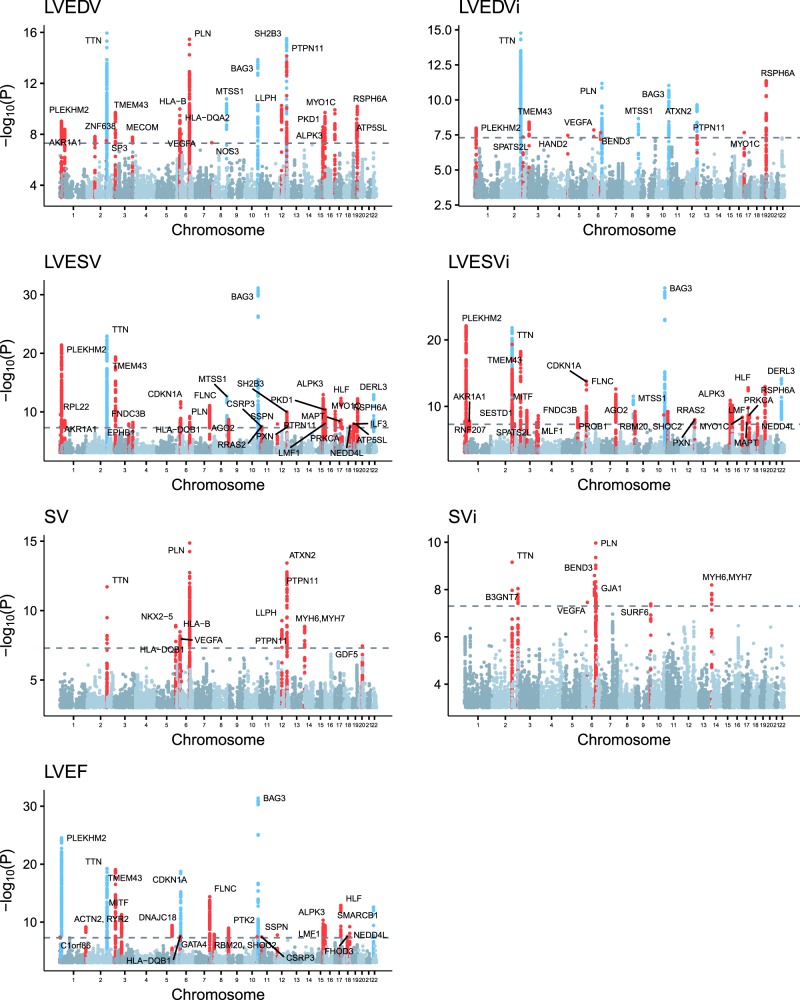
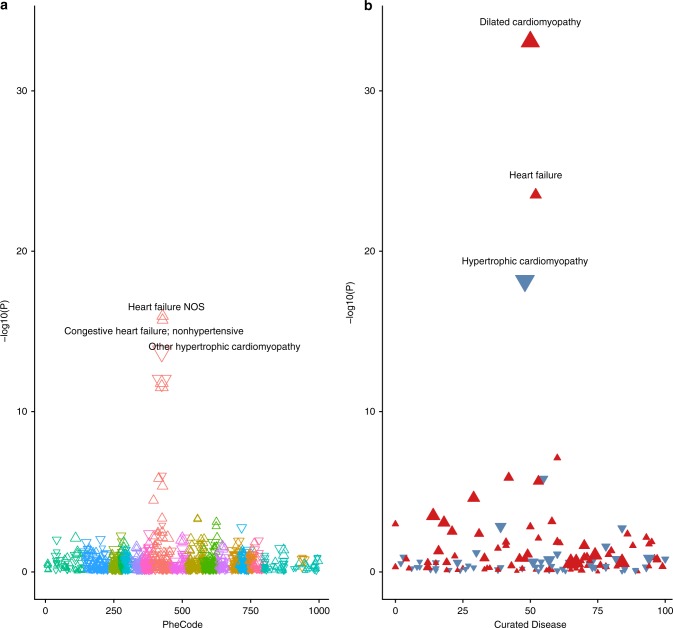
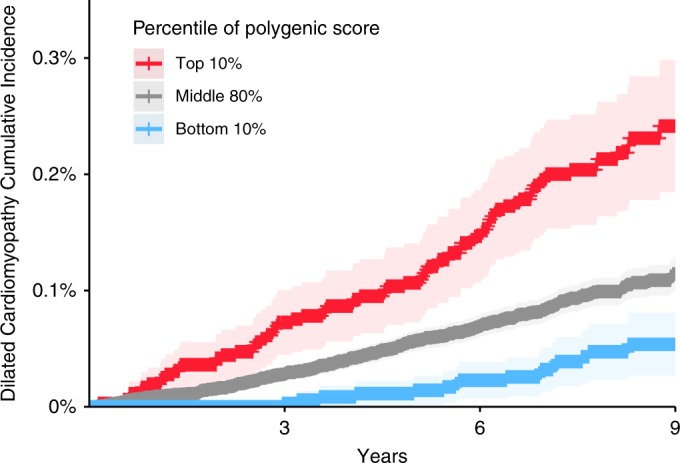
Dilated cardiomyopathy (DCM) is an important cause of heart failure and the leading indication for heart transplantation. Many rare genetic variants have been associated with DCM, but common variant studies of the disease have yielded few associated loci. As structural changes in the heart are a defining feature of DCM, we report a genome-wide association study of cardiac magnetic resonance imaging (MRI)-derived left ventricular measurements in 36,041 UK Biobank participants, with replication in 2184 participants from the Multi-Ethnic Study of Atherosclerosis. We identify 45 previously unreported loci associated with cardiac structure and function, many near well-established genes for Mendelian cardiomyopathies. A polygenic score of MRI-derived left ventricular end systolic volume strongly associates with incident DCM in the general population. Even among carriers of TTN truncating mutations, this polygenic score influences the size and function of the human heart. These results further implicate common genetic polymorphisms in the pathogenesis of DCM.
Overview
The claims and statistics of this paper haven’t been checked yet.
Run the check — free, no account needed. It reads the open-access text and checks the sources it cites.
Integrity signals
Registry
Cites
Statistics
Figures
Verification
Claims the paper makes
The claims and statistics of this paper haven’t been checked yet.
Run the check — free, no account needed. It reads the open-access text and checks the sources it cites.
Claims other papers make about this one
Each is checked against this paper’s own text: does it say what the citing paper says it does?
The cited source says what the claim attributes to it.
In the citing paper
“In silico deletion of genes linked by a prior genome-wide association study24 (GWAS) to cardiac magnetic resonance imaging (MRI) traits relevant to cardiac disease also had a larger effect compared to the control set (Extended Data Fig. 7b).”
From Transfer learning enables predictions in network biology (2023) · cites this paper as [24]
The cited source says what the claim attributes to it.
In the citing paper
“Effect on cardiomyocyte embeddings from in silico deletion of genes linked by prior transcriptome-wide association study (TWAS)-prioritized GWAS24 to cardiac MRI traits relevant to cardiac pathology (left ventricular (LV) end diastolic volume (EDV), LV end systolic volume (LVESV), LV ejection fraction (LVEF), and stroke volume (SV)) compared to in silico deletion of control cardiac disease genes”
From Transfer learning enables predictions in network biology (2023) · cites this paper as [24]
Self-check
Percentages, sums and reported differences re-computed from the paper’s own numbers.
The self-check needs the paper’s full text.
Citations
Cites
The Molecular Signatures Database Hallmark Gene Set Collection
Liberzon, A., Birger, C., Thorvaldsdóttir, H., Ghandi, M., Mesirov, J. P., & Tamayo, P. (2015) · Cell Systems · doi:10.1016/j.cels.2015.12.004 · Cited by 13,807
Sudlow, C., Gallacher, J., Allen, N., Beral, V., Burton, P., Danesh, J., Downey, P., Elliott, P., Green, J., Landray, M., et al. (2015) · PLOS Medicine · doi:10.1371/journal.pmed.1001779 · Cited by 12,728
Second-generation PLINK: rising to the challenge of larger and richer datasets
Chang, C. C., Chow, C. C., Tellier, L. C., Vattikuti, S., Purcell, S. M., & Lee, J. J. (2015) · Gigascience · doi:10.1186/s13742-015-0047-8 · Cited by 12,709
David, F. N., & Tukey, J. W. (1977) · Biometrics · doi:10.2307/2529486 · Cited by 12,707
The UK Biobank resource with deep phenotyping and genomic data
Bycroft, C., Freeman, C., Petkova, D., Band, G., Elliott, L. T., Sharp, K., Motyer, A., Vukcevic, D., Delaneau, O., O’Connell, J., et al. (2018) · Nature · doi:10.1038/s41586-018-0579-z · Cited by 8,876
The Ensembl Variant Effect Predictor
McLaren, W., Gil, L., Hunt, S. E., Riat, H. S., Ritchie, G. R. S., Thormann, A., Flicek, P., & Cunningham, F. (2016) · Genome Biology · doi:10.1186/s13059-016-0974-4 · Cited by 8,099
U1 snRNP regulates cancer cell migration and invasion in vitro
Oh, J.-M., Venters, C. C., Di, C., Pinto, A. M., Wan, L., Younis, I., Cai, Z., Arai, C., So, B. R., Duan, J., et al. (2020) · Nature Communications · doi:10.1038/s41467-019-13993-7 · Cited by 7,157
LD Score regression distinguishes confounding from polygenicity in genome-wide association studies
Schizophrenia Working Group of the Psychiatric Genomics Consortium, Bulik-Sullivan, B. K., Loh, P.-R., Finucane, H. K., Ripke, S., Yang, J., Patterson, N., Daly, M. J., Price, A. L., & Neale, B. M. (2015) · Nature Genetics · doi:10.1038/ng.3211 · Cited by 5,559
Functional mapping and annotation of genetic associations with FUMA
Watanabe, K., Taskesen, E., van Bochoven, A., & Posthuma, D. (2017) · Nature Communications · doi:10.1038/s41467-017-01261-5 · Cited by 4,083
MAGMA: Generalized Gene-Set Analysis of GWAS Data
de Leeuw, C. A., Mooij, J. M., Heskes, T., & Posthuma, D. (2015) · PLOS Computational Biology · doi:10.1371/journal.pcbi.1004219 · Cited by 3,653
Cited by
Sorted by citations
2023 ESC guidelines for the management of cardiomyopathies
Arbelo, E., Protonotarios, A., Gimeno, J. R., Arbustini, E., Barriales-Villa, R., Basso, C., Bezzina, C. R., Biagini, E., Blom, N. A., de Boer, R. A., et al. (2023) · European Heart Journal · doi:10.1093/eurheartj/ehad194 · Cited by 2,844
Transfer learning enables predictions in network biology
Theodoris, C. V., Xiao, L., Chopra, A., Chaffin, M. D., Al Sayed, Z. R., Hill, M. C., Mantineo, H., Brydon, E. M., Zeng, Z., Liu, X. S., et al. (2023) · Nature · doi:10.1038/s41586-023-06139-9 · Cited by 1,193
Self-citationSpatial multi-omic map of human myocardial infarction
Kuppe, C., Ramirez Flores, R. O., Li, Z., Hayat, S., Levinson, R. T., Liao, X., Hannani, M. T., Tanevski, J., Wünnemann, F., Nagai, J. S., et al. (2022) · Nature · doi:10.1038/s41586-022-05060-x · Cited by 772
O’Sullivan, J. W., Raghavan, S., Márquez‐Luna, C., Luzum, J. A., Damrauer, S. M., Ashley, E. A., O’Donnell, C. J., Willer, C. J., & Natarajan, P. (2022) · Circulation · doi:10.1161/cir.0000000000001077 · Cited by 443
Genetic architecture of 11 organ traits derived from abdominal MRI using deep learning
Liu, Y., Basty, N., Whitcher, B. J., Bell, J. D., Sorokin, E. P., van Bruggen, N., Thomas, E. L., & Cule, M. (2021) · eLife · doi:10.7554/elife.65554 · Cited by 270
Metadata
- Authors
- Pirruccello, J. P., Bick, A., Wang, M., Chaffin, M., Friedman, S., Yao, J., Guo, X., Venkatesh, B. A., Taylor, K. D., Post, W. S., Rich, S., Lima, J. A. C., Rotter, J. I., Philippakis, A., Lubitz, S. A., Ellinor, P. T., Khera, A. V., Kathiresan, S., & Aragam, K. G.
- Affiliations
- Broad Institute (US)
- The Lundquist Institute (US)
- Johns Hopkins University (US)
- University of Virginia (US)
- Corresponding author
- Aragam, Krishna G.
- ORCID
- Venue
- Nature Communications
- Published
- 2020-05-07
- Volume
- 11
- Issue
- 1
- Pages
- 2254-2254
- ISSN
- 2041-1723 (ISSN-L)
- PMC
- PMC7206184
- OpenAlex
- W3023537913
- Cited by
- 267
- References
- 70
- Citations by year
- 2026: 33 · 2025: 42 · 2024: 45 · 2023: 58 · 2022: 51 · 2021: 32 · 2020: 6
- FWCI
- 22.74
- Type
- journal article
- Language
- en
- Open access
- gold
- doi.org
- Locations
- Nature Communications (publishedVersion, cc-by)
- PubMed Central (publishedVersion, cc-by)
- PubMed (publishedVersion)
- eScholarship (California Digital Library) (submittedVersion, cc-by)
- RePEc: Research Papers in Economics (submittedVersion)
- DOAJ (DOAJ: Directory of Open Access Journals) (submittedVersion, cc-by-sa)
- Funders
- John S LaDue Memorial Fellowship for Cardiovascular Research
- Foundation for the National Institutes of Health (1R01HL139731, R01HL128914, K24HL105780, HL127564)
- American Heart Association (18SFRN34250007, 18SFRN34110082, 17IFUNP33840012)
- Fondation Leducq (14CVD01)
- Topics
- Health Sciences › Medicine › Cardiology and Cardiovascular Medicine › Cardiomyopathy and Myosin Studies
- Life Sciences › Biochemistry, Genetics and Molecular Biology › Genetics › Genetic Associations and Epidemiology
- Health Sciences › Medicine › Cardiology and Cardiovascular Medicine › Cardiac electrophysiology and arrhythmias
- Keywords
- dilated cardiomyopathy, cardiac magnetic resonance imaging, left ventricular end-systolic volume, genome-wide association study, polygenic risk score, common genetic variants, cardiac structure and function, heart failure, heart transplantation
- MeSH terms
- Cardiomyopathy, Dilated, Heart, Humans, Magnetic Resonance Imaging, Myocardium, Polymorphism, Single Nucleotide, Genome-Wide Association Study
About these checks
Registry, retraction, Cites and statistics results are computed, not judged, with one exception: a printed reference that no index lists is read once by a model before it counts as a citation error. Claims are extracted by a model and kept only when their quote appears verbatim in the text; each cited source is then checked, with a model’s help, for whether it says what the claim relies on. Those verdicts can be wrong — read the claim’s quote and the cited source before relying on one.
Statistics and arithmetic are recomputed, not judged.
Confidence bands are shown only for fields calibrated on our annotated test set. None is calibrated yet, so no band is shown.
What counts as a claim ›How we measure confidence ›How we check this ›
Are you an author, or do you see a problem with this page? Request a review
