

The DOI matches its Crossref record; 61 of the 63 references it cites were found in a registry or an index.
Gut microbiome-related effects of berberine and probiotics on type 2 diabetes (the PREMOTE study)
Open accessAbstract
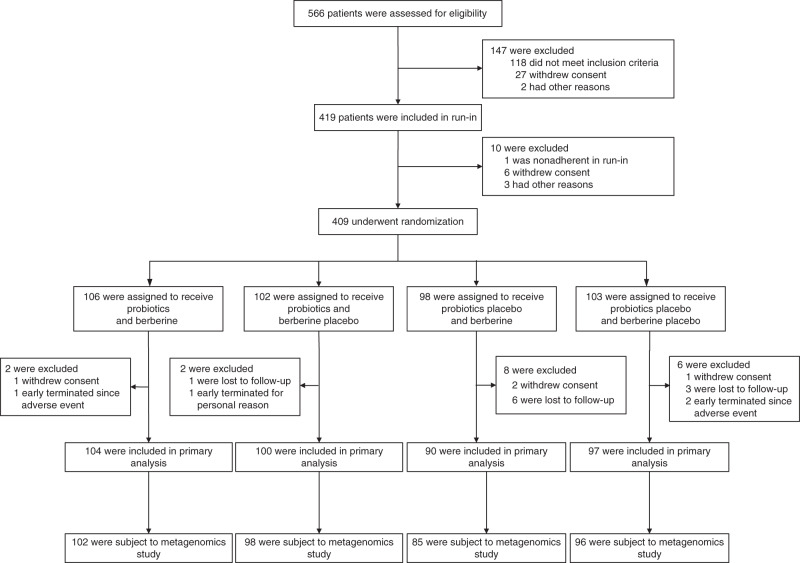
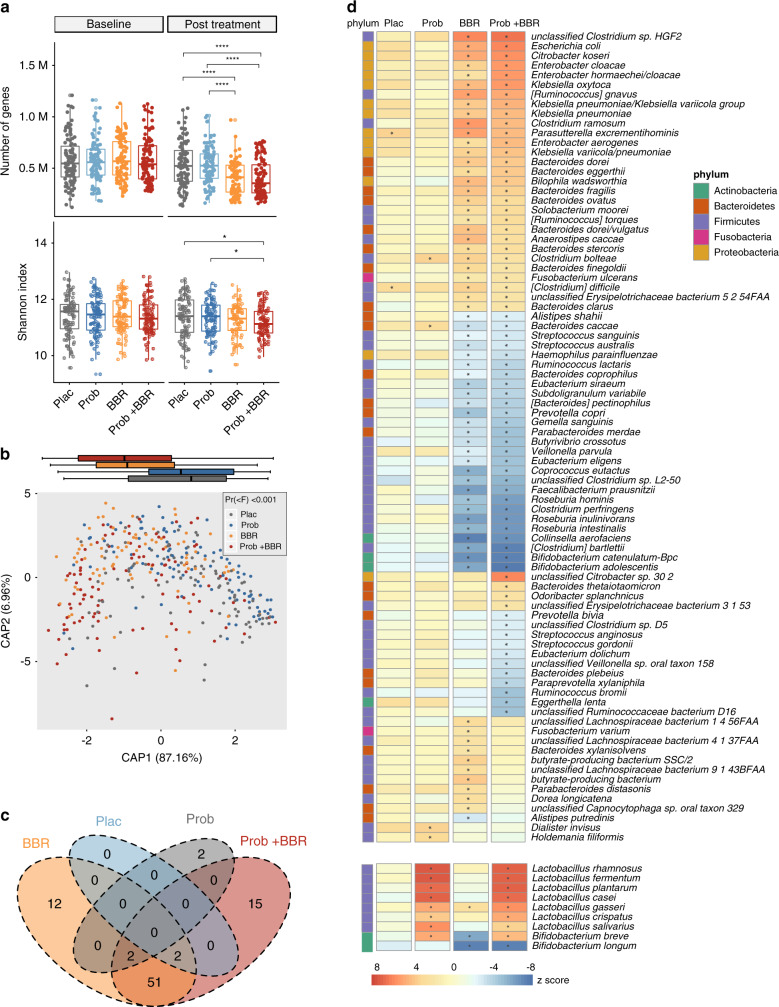
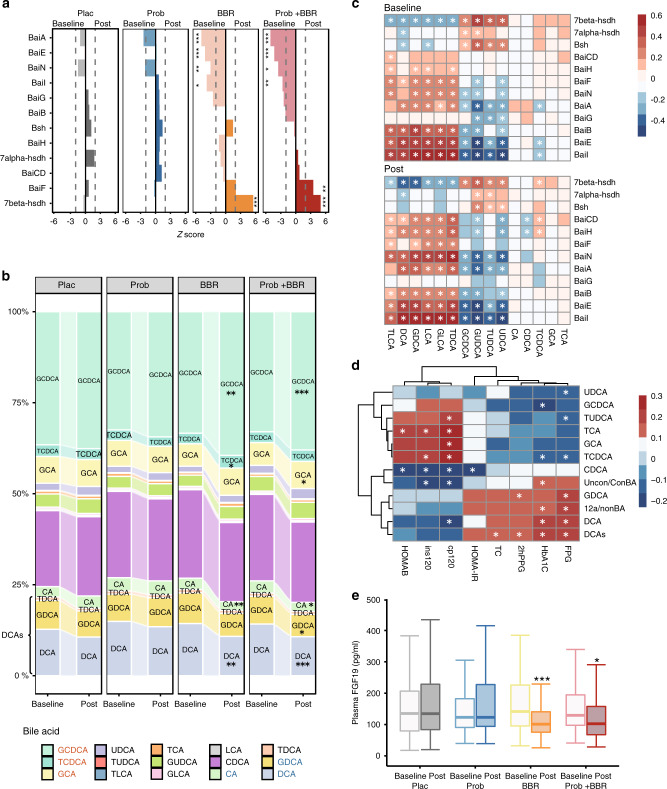
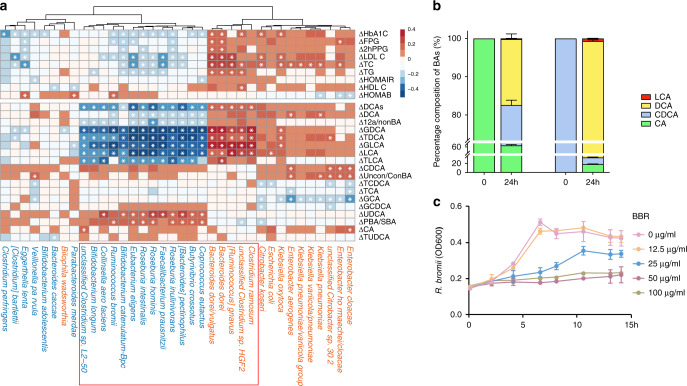
Human gut microbiome is a promising target for managing type 2 diabetes (T2D). Measures altering gut microbiota like oral intake of probiotics or berberine (BBR), a bacteriostatic agent, merit metabolic homoeostasis. We hence conducted a randomized, double-blind, placebo-controlled trial with newly diagnosed T2D patients from 20 centres in China. Four-hundred-nine eligible participants were enroled, randomly assigned (1:1:1:1) and completed a 12-week treatment of either BBR-alone, probiotics+BBR, probiotics-alone, or placebo, after a one-week run-in of gentamycin pretreatment. The changes in glycated haemoglobin, as the primary outcome, in the probiotics+BBR (least-squares mean [95% CI], -1.04[-1.19, -0.89]%) and BBR-alone group (-0.99[-1.16, -0.83]%) were significantly greater than that in the placebo and probiotics-alone groups (-0.59[-0.75, -0.44]%, -0.53[-0.68, -0.37]%, P < 0.001). BBR treatment induced more gastrointestinal side effects. Further metagenomics and metabolomic studies found that the hypoglycaemic effect of BBR is mediated by the inhibition of DCA biotransformation by Ruminococcus bromii. Therefore, our study reports a human microbial related mechanism underlying the antidiabetic effect of BBR on T2D. (Clinicaltrial.gov Identifier: NCT02861261).
Overview
The claims and statistics of this paper haven’t been checked yet.
Run the check — free, no account needed. It reads the open-access text and checks the sources it cites.
Integrity signals
Registry
Cites
Statistics
Figures
Verification
Claims the paper makes
The claims and statistics of this paper haven’t been checked yet.
Run the check — free, no account needed. It reads the open-access text and checks the sources it cites.
Claims other papers make about this one
Each is checked against this paper’s own text: does it say what the citing paper says it does?
The check wasn’t confident either way, so it gives no verdict — never disputed.
In the citing paper
“the microbiome in turn biotransforms it into better-absorbed forms [43,66,102].”
From Berberine-Drug Interactions: Mechanisms, Clinical Relevance and Risk Stratification-A Narrative Review (2026) · cites this paper as [102]
Experimental — accuracy not yet measuredIn the citing paper
“Additionally, evidence has shown that berberine regulates the gut microbiota as well [14, 15], which is closely associated with systematic inflammation that adds to the progression of T2DM.”
From The Effect of Berberine on Metabolic Profiles in Type 2 Diabetic Patients: A Systematic Review and Meta‐Analysis of Randomized Controlled Trials (2021) · cites this paper as [15]
Self-check
Percentages, sums and reported differences re-computed from the paper’s own numbers.
The self-check needs the paper’s full text.
Citations
Cites
An obesity-associated gut microbiome with increased capacity for energy harvest
Turnbaugh, P. J., Ley, R. E., Mahowald, M. A., Magrini, V., Mardis, E. R., & Gordon, J. I. (2006) · Nature · doi:10.1038/nature05414 · Cited by 12,444
A metagenome-wide association study of gut microbiota in type 2 diabetes
Qin, J., Li, Y., Cai, Z., Li, S., Zhu, J., Zhang, F., Liang, S., Zhang, W., Guan, Y., Shen, D., et al. (2012) · Nature · doi:10.1038/nature11450 · Cited by 6,762
Self-citationSkyline: an open source document editor for creating and analyzing targeted proteomics experiments
MacLean, B., Tomazela, D. M., Shulman, N., Chambers, M., Finney, G. L., Frewen, B., Kern, R., Tabb, D. L., Liebler, D. C., & MacCoss, M. J. (2010) · Bioinformatics · doi:10.1093/bioinformatics/btq054 · Cited by 4,697
Gut Microbiota from Twins Discordant for Obesity Modulate Metabolism in Mice
Ridaura, V. K., Faith, J. J., Rey, F. E., Cheng, J., Duncan, A. E., Kau, A. L., Griffin, N. W., Lombard, V., Henrissat, B., Bain, J. R., et al. (2013) · Science · doi:10.1126/science.1241214 · Cited by 3,788
Inflammaging: a new immune–metabolic viewpoint for age-related diseases
Franceschi, C., Garagnani, P., Parini, P., Giuliani, C., & Santoro, A. (2018) · Nature Reviews Endocrinology · doi:10.1038/s41574-018-0059-4 · Cited by 3,586
Dynamics and Stabilization of the Human Gut Microbiome during the First Year of Life
Bäckhed, F., Roswall, J., Peng, Y., Feng, Q., Jia, H., Kovatcheva-Datchary, P., Li, Y., Xia, Y., Xie, H., Zhong, H., et al. (2015) · Cell Host & Microbe · doi:10.1016/j.chom.2015.04.004 · Cited by 3,315
Self-citationGut metagenome in European women with normal, impaired and diabetic glucose control
Karlsson, F. H., Tremaroli, V., Nookaew, I., Bergström, G., Behre, C. J., Fagerberg, B., Nielsen, J., & Bäckhed, F. (2013) · Nature · doi:10.1038/nature12198 · Cited by 3,115
Bile salt biotransformations by human intestinal bacteria
Ridlon, J. M., Kang, D.-J., & Hylemon, P. B. (2006) · Journal of Lipid Research · doi:10.1194/jlr.r500013-jlr200 · Cited by 2,829
Prevalence and Control of Diabetes in Chinese Adults
Xu, Y. (2013) · JAMA · doi:10.1001/jama.2013.168118 · Cited by 2,710
Sayin, S. I., Wahlström, A., Felin, J., Jäntti, S., Marschall, H.-U., Bamberg, K., Angelin, B., Hyötyläinen, T., Orešič, M., & Bäckhed, F. (2013) · Cell Metabolism · doi:10.1016/j.cmet.2013.01.003 · Cited by 2,331
Cited by
Sorted by citations
Items 101–200 of 383
Kowdley, K. V., Forman, L., Eksteen, B., Gunn, N., Sundaram, V., Landis, C. S., Harrison, S. A., Levy, C., Liberman, A., Bisceglie, A. M. D., et al. (2022) · The American Journal of Gastroenterology · doi:10.14309/ajg.0000000000001956 · Cited by 28
Natural biomolecules and derivatives as anticancer immunomodulatory agents
Bernitsa, S., Dayan, R., Stephanou, A., Tzvetanova, I. D., & Patrikios, I. S. (2023) · Frontiers in Immunology · doi:10.3389/fimmu.2022.1070367 · Cited by 29
Pharmacomicrobiomics and type 2 diabetes mellitus: A novel perspective towards possible treatment
Jia, L., Huang, S., Sun, B., Shang, Y., & Zhu, C. (2023) · Frontiers in Endocrinology · doi:10.3389/fendo.2023.1149256 · Cited by 27
Self-citationQian, Y., Kang, Z., Zhao, L., Chen, H., Zhou, C., Gao, Q., Wang, Z., Liu, Q., Cui, Y., Li, X., et al. (2023) · Chinese Medical Journal · doi:10.1097/cm9.0000000000002752 · Cited by 27
Self-citationAraj‐Khodaei, M., Ayati, M. H., Azizi-Zeinalhajlou, A., Novinbahador, T., Yousefi, M., Shiri, M., Mahmoodpoor, A., Shamekh, A., Namazi, N., & Sanaie, S. (2023) · Archives of Physiology and Biochemistry · doi:10.1080/13813455.2023.2258559 · Cited by 30
Yibcharoenporn, C., Muanprasat, C., Moonwiriyakit, A., Satitsri, S., & Pathomthongtaweechai, N. (2025) · Drug Design Development and Therapy · doi:10.2147/dddt.s507489 · Cited by 27
Zhang, X., Ren, H., Zhao, C., Shi, Z., Li, Q., Yang, F., Zhou, X., Han, X., Wu, K., Zhong, H., et al. (2022) · Diabetologia · doi:10.1007/s00125-022-05768-5 · Cited by 28
Self-citationFerroptosis: a new strategy for Chinese herbal medicine treatment of diabetic nephropathy
Wei, M., Liu, X., Tan, Z., Tian, X., Li, M., & Wei, J. (2023) · Frontiers in Endocrinology · doi:10.3389/fendo.2023.1188003 · Cited by 28
Pierro, F. D., Sultana, R., Eusaph, A. Z., Abrar, S., Bugti, M., Afridi, F., Farooq, U., Iqtadar, S., Ghauri, F., Makhduma, S., et al. (2023) · Frontiers in Pharmacology · doi:10.3389/fphar.2023.1269605 · Cited by 29
Liu, J., Li, F., Yang, L., Luo, S., & Deng, Y. (2025) · Frontiers in Microbiology · doi:10.3389/fmicb.2025.1554189 · Cited by 27
Zhao, Y., Li, M., Wang, Y., Geng, R., Fang, J., Liu, Q., Kang, S., Zeng, W., Huang, K., & Tong, T. (2022) · Critical Reviews in Food Science and Nutrition · doi:10.1080/10408398.2022.2045895 · Cited by 28
Human gut microbiome: Therapeutic opportunities for metabolic syndrome—Hype or hope?
Horvath, A., Žukauskaitė, K., Hazia, O., Balázs, I., & Stadlbauer, V. (2023) · Endocrinology Diabetes & Metabolism · doi:10.1002/edm2.436 · Cited by 30
Recent advances and future directions in microbiome metabolomics
Misheva, M., Ilott, N. E., & McCullagh, J. (2021) · Current Opinion in Endocrine and Metabolic Research · doi:10.1016/j.coemr.2021.07.001 · Cited by 23
Holistic perspective of the role of gut microbes in diabetes mellitus and its management
Alagiakrishnan, K., & Halverson, T. (2021) · World Journal of Diabetes · doi:10.4239/wjd.v12.i9.1463 · Cited by 25
Chen, Y., & Wang, M. (2021) · Drug Design Development and Therapy · doi:10.2147/dddt.s334325 · Cited by 25
Microbiota: A potential orchestrator of antidiabetic therapy
Liu, B., Zhang, L., Yang, H., Zheng, H., & Liao, X. (2023) · Frontiers in Endocrinology · doi:10.3389/fendo.2023.973624 · Cited by 26
Self-citationAdvances in Gut Microbiota-Targeted Therapeutics for Metabolic Syndrome
Gao, Y., Li, W., Huang, X., Lyu, Y., & Yue, C. (2024) · Microorganisms · doi:10.3390/microorganisms12050851 · Cited by 24
Huang, C., Sun, Y. H., Liao, S.-R., Chen, Z.-X., Lin, H.-F., & Shen, W. (2022) · Frontiers in Microbiology · doi:10.3389/fmicb.2022.869931 · Cited by 23
Quorum sensing-based interactions among drugs, microbes, and diseases
Wu, S., Yang, S., Wang, M., Song, N., Feng, J., Wu, H., Yang, A., Liu, C., Li, Y., Guo, F., et al. (2022) · Science China Life Sciences · doi:10.1007/s11427-021-2121-0 · Cited by 23
Wang, Z., Li, W., Lyu, Z., Yang, L., Wang, S., Wang, P., Song, F., Chen, K., & Huang, Y. (2022) · Public Health · doi:10.1016/j.puhe.2022.06.012 · Cited by 28
Self-citationHu, Y., Ye, Z., She, Y., Li, L., Wu, M., Qin, K., Li, Y., He, H., Hu, Z., Yang, M., et al. (2022) · Frontiers in Pharmacology · doi:10.3389/fphar.2022.844961 · Cited by 23
Dou, Y., Ai, G., Huang, R., Huang, Z., Li, Y., Liu, Y., Xie, J., Chen, J., & Su, Z. (2022) · Phytomedicine · doi:10.1016/j.phymed.2022.154135 · Cited by 22
Wang, Z., Ding, L., Liu, J., Savarin, P., Wang, X., Zhao, K., Ding, W., & Hou, Y. (2023) · Journal of Functional Foods · doi:10.1016/j.jff.2023.105899 · Cited by 24
Self-citationLi, M., Liu, Y., Qiu, Y., Zhang, J., Zhang, Y., Zhao, Y., Jia, Q., & Li, J. (2021) · Psychiatry Research · doi:10.1016/j.psychres.2021.113899 · Cited by 21
Self-citationAdvancements in MRSA treatment: the role of berberine in enhancing antibiotic therapy
Zhou, F., Gu, X., Wang, W., Lin, M., & Wang, L. (2024) · BMC Microbiology · doi:10.1186/s12866-024-03692-9 · Cited by 21
Self-citationPerspectives on Berberine and the Regulation of Gut Microbiota: As an Anti-Inflammatory Agent
Quintero, J., Galvez-Ruiz, J. C., Ibarra, A. A. M., & Leyva‐Peralta, M. A. (2025) · Pharmaceuticals · doi:10.3390/ph18020193 · Cited by 21
Lin, D., Chen, X., Lin, X., Zhang, C., Liang, T., Zheng, L., Xu, Y., Huang, L., Qiao, Q., & Xiong, K. (2025) · Journal of Hazardous Materials · doi:10.1016/j.jhazmat.2025.138308 · Cited by 21
Yang, Y., Cao, S., Xu, W., Zang, C., Zhang, F., Xie, Y., & Wu, C. (2022) · Biomedicine & Pharmacotherapy · doi:10.1016/j.biopha.2022.113542 · Cited by 21
Bacteria-driven bio-therapy: From fundamental studies to clinical trials
Yu, Y., Lin, S., Chen, Z., Qin, B. Y., He, Z., Cheng, M., Sun, M., & Sun, J. Y. (2022) · Nano Today · doi:10.1016/j.nantod.2022.101731 · Cited by 23
Luo, Z., Li, Z., Liang, Z., Wang, L., He, G., Wang, D., Shen, L., Wang, Z., Ma, X., Geng, F., et al. (2022) · BMC Biology · doi:10.1186/s12915-022-01492-z · Cited by 21
Coppinger, C., Pomales, B., Movahed, M. R., Marefat, M. M., & Hashemzadeh, M. (2024) · Current Clinical Pharmacology · doi:10.2174/0127724328250471231222094648 · Cited by 25
Xia, S., Jing, R., Shi, M., Yang, Y., Feng, M., Deng, L., & Luo, L. (2024) · Journal of Periodontal Research · doi:10.1111/jre.13246 · Cited by 21
Setayesh, A., Karimi, M., Karimi, M. A., Pirzad, S., Heydari, M., Asbaghi, O., Davoodi, S. H., & Larijani, B. A. (2025) · Probiotics and Antimicrobial Proteins · doi:10.1007/s12602-025-10644-w · Cited by 22
Tian, J., Jin, Y.-Q., Yu, E., Sun, J., Xia, Y. L., Zhang, K., Li, Z., Gong, W., Wang, G.-J., & Xie, J. (2022) · Aquaculture · doi:10.1016/j.aquaculture.2022.738055 · Cited by 20
Ye, X., Wu, K., Xu, L., Cen, Y., Ni, J., Chen, J., Zheng, W., & Liu, W. (2023) · Frontiers in Endocrinology · doi:10.3389/fendo.2022.1103972 · Cited by 24
Wang, J., Dong, P., Zheng, S., Mai, Y.-Y., Ding, J., Pan, P., Tang, L., Wan, Y., & Liang, H. (2023) · Frontiers in Cellular and Infection Microbiology · doi:10.3389/fcimb.2023.1196967 · Cited by 21
Self-citationSalivary microbiome and hypertension in the Qatari population
Murugesan, S., & Khodor, S. A. (2023) · Journal of Translational Medicine · doi:10.1186/s12967-023-04247-8 · Cited by 20
Bile Acids, Gut Microbiome and the Road to Fatty Liver Disease
Hylemon, P. B., Su, L., Zheng, P., Bajaj, J. S., & Zhou, H. (2021) · Comprehensive physiology · doi:10.1002/cphy.c210024 · Cited by 29
Pharmacomicrobiomics in Western Medicine and Traditional Chinese Medicine in Type 2 Diabetes
Chu, N. H. S., Chan, J. C. N., & Chow, E. (2022) · Frontiers in Endocrinology · doi:10.3389/fendo.2022.857090 · Cited by 19
Foodomics: a new perspective on gut probiotics nutrition and health research
He, M., Tan, C. P., Liu, Y., & Xu, Y. (2021) · Current Opinion in Food Science · doi:10.1016/j.cofs.2021.04.004 · Cited by 20
Adhikary, K., Sarkar, R., Maity, S., Banerjee, I., Chatterjee, P., Bhattacharya, K., Ahuja, D., Sinha, N. K., & Maiti, R. (2024) · Journal of Basic and Clinical Physiology and Pharmacology · doi:10.1515/jbcpp-2024-0043 · Cited by 20
Asghari, P., Babaei, A., Zamanian, N., & Nattagh‐Eshtivani, E. (2025) · Metabolism Open · doi:10.1016/j.metop.2025.100399 · Cited by 23
Microbiome Changes after Type 2 Diabetes Treatment: A Systematic Review
Merkevičius, K., Kundelis, R., Maleckas, A., & Veličkienė, D. (2021) · Medicina · doi:10.3390/medicina57101084 · Cited by 17
Chen, Q., Li, D., Wu, F., He, X., Zhou, Y., Sun, C., Wang, H., & Liu, Y. (2022) · Combinatorial Chemistry & High Throughput Screening · doi:10.2174/1386207326666221124093228 · Cited by 18
Lin, J., Zhang, Y., Wang, K., Wang, J., Kou, S., Chen, K., Zheng, W., & Chen, R. (2023) · European Journal of Nutrition · doi:10.1007/s00394-023-03184-y · Cited by 19
Self-citationMa, Y.-H., Sheng, Y.-D., Zhang, D., Liu, J., Tian, Y., Li, H., Li, X., Li, N., Sun, P. G., Siddiqui, S. A., et al. (2024) · Microbial Pathogenesis · doi:10.1016/j.micpath.2024.106614 · Cited by 18
Self-citationWu, J., Jia, R., Luo, D., Li, Z., Lin, L., Zheng, Q., & Zhao, M. (2022) · Food & Function · doi:10.1039/d1fo02165f · Cited by 18
Targeted Antimicrobial Agents as Potential Tools for Modulating the Gut Microbiome
Chou, S., Zhang, S., Guo, H., Chang, Y., Zhao, W., & Mou, X. (2022) · Frontiers in Microbiology · doi:10.3389/fmicb.2022.879207 · Cited by 19
Li, F. N., Peng, X., & Li, W. (2025) · Food & Function · doi:10.1039/d4fo04430d · Cited by 17
Li, B., Ye, L., Zhao, Y., Liu, Y., Chen, Y., & Zhang, H. (2025) · Agricultural Products Processing and Storage · doi:10.1007/s44462-025-00023-7 · Cited by 29
Wang, M., Yang, Q., Li, Y., Zhao, Y., Zou, J., Luan, F., Peng, X., Huang, Z., & Liu, F. (2025) · Chinese Medicine · doi:10.1186/s13020-025-01222-x · Cited by 17
Cui, S., Guo, W., Chen, C., Tang, X., Zhao, J., Mao, B., & Zhang, H. (2022) · Foods · doi:10.3390/foods11091187 · Cited by 17
Cao, M.-Z., Wei, C.-H., Wen, M.-C., Song, Y., Srivastava, K. D., Yang, N., Shi, Y., Miao, M., Chung, D., & Li, X.-M. (2023) · Frontiers in Endocrinology · doi:10.3389/fendo.2023.1054674 · Cited by 19
Self-citationModulative effect of Physalis alkekengi on both gut bacterial and fungal micro-ecosystem
Yang, Y., Zhao, X., Xie, Y., & Wu, C. (2023) · Chinese Herbal Medicines · doi:10.1016/j.chmed.2023.02.003 · Cited by 17
Self-citationAlkanad, M. A., Hani, U., Annegowda, H. V., Ghazwani, M., Haider, N., Osmani, R. A. M., Pandareesh, M. D., Hamsalakshmi, & Bhat, R. (2024) · BioFactors · doi:10.1002/biof.2034 · Cited by 18
Bornlisy Attenuates Colitis-Associated Colorectal Cancer via Inhibiting GPR43-Mediated Glycolysis
Lu, X., Qiao, S., Chen, P., Yan, W., Xu, Z., Qu, J., Hou, Y., Zhao, S., Chen, P., & Wang, T. (2021) · Frontiers in Nutrition · doi:10.3389/fnut.2021.706382 · Cited by 17
Anti-Hyperglycemic Agents in the Adjuvant Treatment of Sepsis: Improving Intestinal Barrier Function
Wang, Y., Li, J., Wang, D., Jin, K., Hui, J., & Xu, H. (2022) · Drug Design Development and Therapy · doi:10.2147/dddt.s360348 · Cited by 18
Self-citationJayaraman, S., Eswaran, A., Rajagopal, P., Palanisamy, C. P., Veerakumar, P., Veeraraghavan, V. P., & Sirasanagandla, S. R. (2026) · Biogerontology · doi:10.1007/s10522-026-10402-7 · Cited by 17
He, Q., Chen, B., Wang, G., Zhou, D., Zeng, H., Li, X., Song, Y., Yu, X., Liang, W., Chen, H., et al. (2022) · Frontiers in Pharmacology · doi:10.3389/fphar.2022.842879 · Cited by 19
Self-citationKim, W. J., Kil, B. J., Lee, C., Kim, T. Y., Han, G., Choi, Y., Kim, K., Shin, C. H., Park, S.-Y., Kim, H., et al. (2024) · Gut Microbes · doi:10.1080/19490976.2024.2319889 · Cited by 16
Li, J.-S., Fan, R.-Y., Zhang, Z., Zhao, L., Han, Y., Zhu, K. Y., Duan, J., & Su, S. (2024) · Microbiological Research · doi:10.1016/j.micres.2024.127973 · Cited by 19
Self-citationYang, C., Bai, X., Hu, T., Xue, X., Su, X., Zhang, X., Wu, T., Zhang, M., Shen, X., & Dong, X. (2022) · Frontiers in Microbiology · doi:10.3389/fmicb.2022.1018008 · Cited by 16
Li, S., Wei, Y., Liang, Z., Guo, L., Hao, X., & Zhang, Y. (2023) · Food Science and Human Wellness · doi:10.26599/fshw.2022.9250150 · Cited by 16
Self-citationPharmacological and Clinical Studies of Medicinal Plants That Inhibit Dipeptidyl Peptidase-IV
Rohani, R., Febrina, E., Wahyuni, I. S., & Levita, J. (2023) · Drug Design Development and Therapy · doi:10.2147/dddt.s426870 · Cited by 16
Zhang, W., Yi, C., Song, Z., Yu, B., Jiang, X., Guo, L., Huang, S., Xia, T., Huang, F., Yan, Y., et al. (2025) · Phytomedicine · doi:10.1016/j.phymed.2025.156560 · Cited by 15
Self-citationWang, C., Wang, Y., Yang, H., Tian, Z., Zhu, M., Sha, X., Ran, J., & Li, L. (2022) · BMC Endocrine Disorders · doi:10.1186/s12902-022-01155-8 · Cited by 15
Self-citationThe exciting and magical journey of components from compound formulae to where they fight
Meng, N., Lyu, Y., Zhang, X., Chai, X., Li, K., & Wang, Y. (2022) · Acupuncture and Herbal Medicine · doi:10.1097/hm9.0000000000000047 · Cited by 15
Tian, R., Hong, J., Zhao, J., Zhou, D., Liu, Y., Jiao, Z., Song, J., Zhang, Y., Meng, L., & Yu, M. (2022) · Mediators of Inflammation · doi:10.1155/2022/2078520 · Cited by 14
Self-citationHuang, Y.-H., Wu, Y.-H., Tang, H.-Y., Chen, S., Wang, C., Ho, W., Lin, Y., Liu, G.-H., Lin, P.-Y., Lo, C.-J., et al. (2022) · Pharmaceutics · doi:10.3390/pharmaceutics14091857 · Cited by 14
Wang, Y., Zhao, D., Su, L., Tai, Y., Way, G. W., Zeng, J., Yan, Q., Xu, Y., Wang, X., Gurley, E. C., et al. (2024) · Cell & Bioscience · doi:10.1186/s13578-024-01195-8 · Cited by 14
Self-citationZhao, Z., Ma, R., Ma, Y., Zhao, L., Wang, L., Fang, Y., Zhang, Y., Wu, X., & Wang, X. (2024) · Molecules · doi:10.3390/molecules29102304 · Cited by 14
Self-citationCao, Z., Wang, X., Liu, H., Yang, Z., & Zeng, Z. (2024) · Phytomedicine · doi:10.1016/j.phymed.2024.156151 · Cited by 14
Self-citationChen, C.-Y., & Zhang, Y. (2025) · European Journal of Medicinal Chemistry · doi:10.1016/j.ejmech.2025.117475 · Cited by 14
Self-citationZhou, X., Zheng, W., Kong, W., Zhang, J., Liao, Y., Min, J., & Zeng, T. (2025) · The Journal of Clinical Endocrinology & Metabolism · doi:10.1210/clinem/dgaf340 · Cited by 14
Shi, J., Yin, Q., Zhang, L., Wu, Y. H., Yi, P., Guo, M., Li, H., Yuan, L., Wang, Z., Zhuang, P., et al. (2022) · Frontiers in Pharmacology · doi:10.3389/fphar.2022.898360 · Cited by 14
Self-citationA diet high in FODMAPs as a novel dietary strategy in diabetes?
Chu, N. H. S., Chan, J. C. N., & Chow, E. (2022) · Clinical Nutrition · doi:10.1016/j.clnu.2022.07.036 · Cited by 15
Yan, J., Li, J., Xue, Q., Xie, S., Jiang, J., Li, P., & Du, B. (2022) · Journal of Applied Microbiology · doi:10.1111/jam.15773 · Cited by 14
Self-citationHuman Gut Microbiota in Heart Failure: Trying to Unmask an Emerging Organ
PARASKEVAIDIS, I. A., Xanthopoulos, A. V., Tsougos, E., & Triposkiadis, F. K. (2023) · Biomedicines · doi:10.3390/biomedicines11092574 · Cited by 13
Wang, J., Bi, C., Xi, H., & Wei, F. (2024) · Frontiers in Pharmacology · doi:10.3389/fphar.2024.1455534 · Cited by 13
Self-citationAllam, A. R., Helal, M. B., Alhateem, M. S., Shehab, M. A., Elshaar, A. G., Saeda, M. A., Ibrahim, F. M., Khalil, A. A., & Mahmoud, A. M. (2025) · Diabetology & Metabolic Syndrome · doi:10.1186/s13098-025-01841-2 · Cited by 13
Zhao, J. V., Huang, X., Zhang, J., Chan, Y., Tse, H., & Blais, J. E. (2023) · Journal of Nutrition · doi:10.1016/j.tjnut.2023.08.016 · Cited by 12
Probiotics and Prebiotics as Dietary Supplements for the Adjunctive Treatment of Type 2 Diabetes
Wang, Y., Wen, L., Tang, H., Qu, J., & Rao, B. (2023) · Polish Journal of Microbiology · doi:10.33073/pjm-2023-013 · Cited by 13
Liu, D., Zhao, L., Wang, Y., Wang, L., Wu, D., & Liu, Y. (2025) · Pharmaceuticals · doi:10.3390/ph18121890 · Cited by 12
Jayedi, A., Aletaha, A., Zeraattalab-Motlagh, S., Shahinfar, H., Mohammadpour, S., Mirrafiei, A., Jibril, A. T., Soltani, A., & Shab‐Bidar, S. (2023) · Diabetes & Metabolic Syndrome Clinical Research & Reviews · doi:10.1016/j.dsx.2023.102923 · Cited by 12
Singh, A. K., Kumar, P., Mishra, S. K., Rajput, V. D., Tiwari, K. N., Singh, A. K., Minkina, T., Pandey, A. K., & Upadhyay, P. (2024) · Applied Biochemistry and Biotechnology · doi:10.1007/s12010-024-04879-6 · Cited by 12
Chai, Y., Liu, X., Bai, G., Zhou, N., Liu, D., Zhang, X., Li, M., Li, K., & Lei, H. (2024) · Frontiers in Immunology · doi:10.3389/fimmu.2024.1323723 · Cited by 12
Peterson, C. T. (2024) · J — Multidisciplinary Scientific Journal · doi:10.3390/j7030020 · Cited by 12
Disentangling Organ‐Specific Roles of Farnesoid X Receptor in Bile Acid and Glucolipid Metabolism
Li, T., Fu, C., Tang, Z., Li, C., Hua, D., Liu, B., Tao, Z., Yang, J., Zhang, L., Cheng, T., et al. (2025) · Liver International · doi:10.1111/liv.70027 · Cited by 12
Self-citationKhvostov, M. V., Gladkova, E. D., Борисов, С. А., Zhukova, N., Marenina, M. K., Meshkova, Y. V., Luzina, O. A., Tolstikova, T. G., & Salakhutdinov, N. F. (2021) · Pharmaceutics · doi:10.3390/pharmaceutics13122138 · Cited by 13
Preclinical Studies of Natural Products Targeting the Gut Microbiota: Beneficial Effects on Diabetes
Jiang, X., Sun, B., & Zhou, Z. (2022) · Journal of Agricultural and Food Chemistry · doi:10.1021/acs.jafc.2c02960 · Cited by 12
Li, D. X., Feng, G., Li, Y., Han, P., Luo, P., Liu, B., Ding, T., Wang, X., Xu, H., Zhao, Y., et al. (2023) · Frontiers in Endocrinology · doi:10.3389/fendo.2023.1120221 · Cited by 12
Self-citationIdentification of FtfL as a novel target of berberine in intestinal bacteria
Yan, J., Fang, C., Yang, G., Li, J., Liu, Y., Zhang, L., Yang, P., Fang, J., Gu, Y., Zhang, Y., et al. (2023) · BMC Biology · doi:10.1186/s12915-023-01778-w · Cited by 12
Self-citationMapping the regulatory effects of herbal organic compounds on gut bacteria
Zhang, Y., Chen, T., Hao, X., Yuanjia, H., Chen, M., Zhang, D., Cai, H. N., Luo, J., Kong, L., Huang, S.-T.-Z., et al. (2023) · Pharmacological Research · doi:10.1016/j.phrs.2023.106804 · Cited by 12
Self-citationHua, R., Lam, C. S., Chu, N. H. S., Yang, A., Chow, E., & Cheung, Y. T. (2023) · Nutrition & Metabolism · doi:10.1186/s12986-023-00753-0 · Cited by 11
Singh, N., Barthwal, R., Negi, A., Aggarwal, S., Kathuria, D., Kumar, V., & Paul, M. (2024) · International Journal of Food Science & Technology · doi:10.1111/ijfs.17041 · Cited by 11
Kang, X., Jin, D., Ji, H., An, X., Zhang, Y., Duan, L., Yang, C., Zhou, R., Duan, Y., Zhang, Y., et al. (2024) · Drug Design Development and Therapy · doi:10.2147/dddt.s487315 · Cited by 11
Self-citationQiu, F., Lu, W., Ye, S., Liu, H., Zeng, Q., Huang, H., Liang, C.-L., Chen, Y., Fang, Z., Zhang, Q., et al. (2021) · Frontiers in Immunology · doi:10.3389/fimmu.2021.646831 · Cited by 11
Ma, X., Wang, F., Zhao, T., Wang, W., & Dai, Q. (2021) · Nutrición Hospitalaria · doi:10.20960/nh.03866 · Cited by 11
Self-citationRathod, P., & Yadav, R. P. (2023) · Drug Delivery and Translational Research · doi:10.1007/s13346-023-01404-w · Cited by 11
Nie, X., Qi, L., Yin, Y., He, Z., Bai, Y., & Zhu, C. (2024) · Frontiers in Microbiology · doi:10.3389/fmicb.2024.1428287 · Cited by 11
Metadata
- Authors
- Zhang, Y., Gu, Y., Ren, H., Wang, S., Zhong, H., Zhao, X., Ma, J., Gu, X., Xue, Y., Huang, S., Yang, J., Chen, L., Chen, G., Qu, S., Liang, J., Qin, L., Huang, Q., Peng, Y., Li, Q., Wang, X., Kong, P., Hou, G., Gao, M., Shi, Z., Li, X., Qiu, Y., Zou, Y., Yang, H., Wang, J., Xu, G., Lai, S., Li, J., Ning, G., & Wang, W.
- Affiliations
- Shanghai Jiao Tong University (CN)
- BGI Group (China) (CN)
- Dalian Institute of Chemical Physics (CN)
- First Affiliated Hospital of Wenzhou Medical University (CN)
- Nanfang Hospital (CN)
- Minhang District Central Hospital (CN)
- Qilu Hospital of Shandong University (CN)
- Fujian Provincial Hospital (CN)
- Tongji University (CN)
- Xuzhou Central Hospital (CN)
- Second Military Medical University (CN)
- Johns Hopkins University (US)
- Corresponding author
- Li, Junhua
- Wang, Weiqing
- ORCID
- Zhang, Yifei
- Gu, Yanyun
- Ren, Huahui
- Wang, Shujie
- Zhong, Huanzi
- Zhao, Xinjie
- Ma, Jing
- Gu, Xuejiang
- Xue, Yaoming
- Huang, Shan
- Yang, Jialin
- Chen, Li
- Qu, Shen
- Liang, Jun
- Qin, Li
- Huang, Qin
- Peng, Yongde
- Li, Qi
- Wang, Xiaolin
- Hou, Guixue
- Gao, Mengyu
- Shi, Zhun
- Li, Xuelin
- Qiu, Yixuan
- Zou, Yuanqiang
- Yang, Huanming
- Wang, Jian
- Xu, Guowang
- Lai, Shenghan
- Li, Junhua
- Ning, Guang
- Wang, Weiqing
- Venue
- Nature Communications
- Published
- 2020-10-06
- Volume
- 11
- Issue
- 1
- Pages
- 5015-5015
- ISSN
- 2041-1723 (ISSN-L)
- PMC
- PMC7538905
- OpenAlex
- W3092484485
- Cited by
- 380
- References
- 63
- Citations by year
- 2026: 44 · 2025: 68 · 2024: 63 · 2023: 84 · 2022: 72 · 2021: 48 · 2020: 1
- FWCI
- 31.32
- Type
- journal article
- Language
- en
- Open access
- gold
- doi.org
- Locations
- Nature Communications (publishedVersion, cc-by)
- PubMed Central (publishedVersion, cc-by)
- PubMed (publishedVersion)
- RePEc: Research Papers in Economics (submittedVersion)
- DOAJ (DOAJ: Directory of Open Access Journals) (submittedVersion, cc-by-sa)
- Funders
- National Natural Science Foundation of China (81,870,555, 91857205, 2016YFC0901200, 2018YFC1313804, 81930021)
- Sun Yat-sen University
- Government of Jiangsu Province
- Huazhong University of Science and Technology
- Science and Technology Commission of Shanghai Municipality
- Government of Jiangxi Province
- Tongji University
- Zhejiang University
- Shanghai Jiao Tong University
- Second Military Medical University
- Peking University
- Nanjing University
- Southern Medical University
- Nanfang Hospital
- Shanghai General Hospital
- Fujian Provincial Hospital
- Ruijin Hospital
- Wuhan Union Hospital
- School of Medicine, Shanghai Jiao Tong University
- Tongji Medical College, Huazhong University of Science and Technology
- Topics
- Health Sciences › Medicine › Pharmacology (medical) › Berberine and alkaloids research
- Life Sciences › Biochemistry, Genetics and Molecular Biology › Molecular Biology › Gut microbiota and health
- Life Sciences › Agricultural and Biological Sciences › Food Science › Probiotics and Fermented Foods
- Keywords
- berberine, probiotics, type 2 diabetes, gut microbiota, HbA1c, Ruminococcus bromii, metagenomics, metabolomics, antidiabetic mechanism, newly diagnosed diabetes, gastrointestinal adverse effects
- MeSH terms
- Gastrointestinal Microbiome, Berberine, Diabetes Mellitus, Type 2, Female, Glycated Hemoglobin, Humans, Hypoglycemic Agents, Male, Middle Aged, Placebos, Treatment Outcome, Probiotics, Metagenome
About these checks
Registry, retraction, Cites and statistics results are computed, not judged, with one exception: a printed reference that no index lists is read once by a model before it counts as a citation error. Claims are extracted by a model and kept only when their quote appears verbatim in the text; each cited source is then checked, with a model’s help, for whether it says what the claim relies on. Those verdicts can be wrong — read the claim’s quote and the cited source before relying on one.
Statistics and arithmetic are recomputed, not judged.
Confidence bands are shown only for fields calibrated on our annotated test set. None is calibrated yet, so no band is shown.
What counts as a claim ›How we measure confidence ›How we check this ›
Are you an author, or do you see a problem with this page? Request a review
