

The DOI matches its Crossref record; 50 of the 51 references it cites were found in a registry or an index.
Chiral gold nanoparticles enantioselectively rescue memory deficits in a mouse model of Alzheimer’s disease
Open accessAbstract
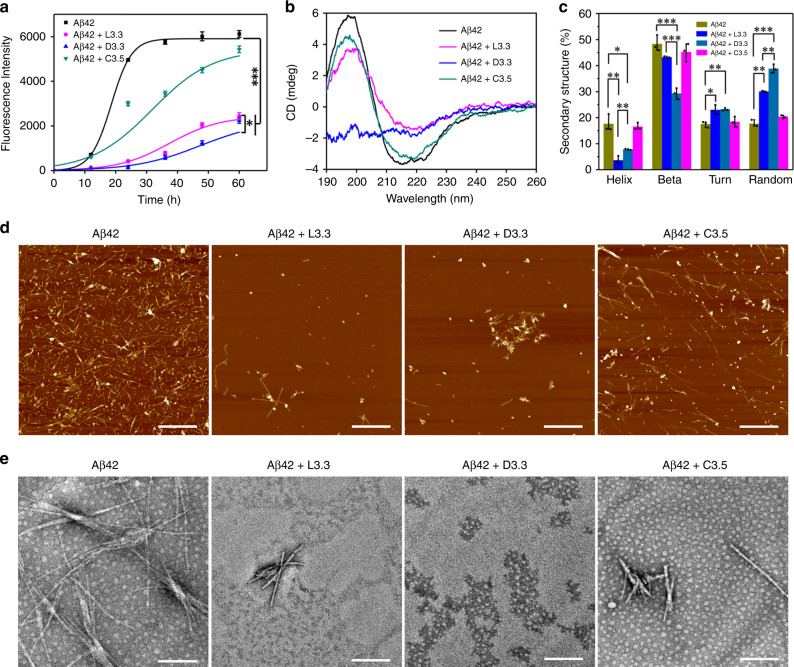
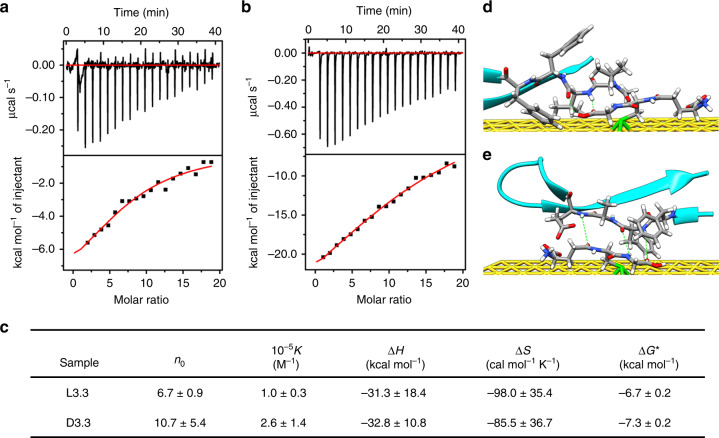
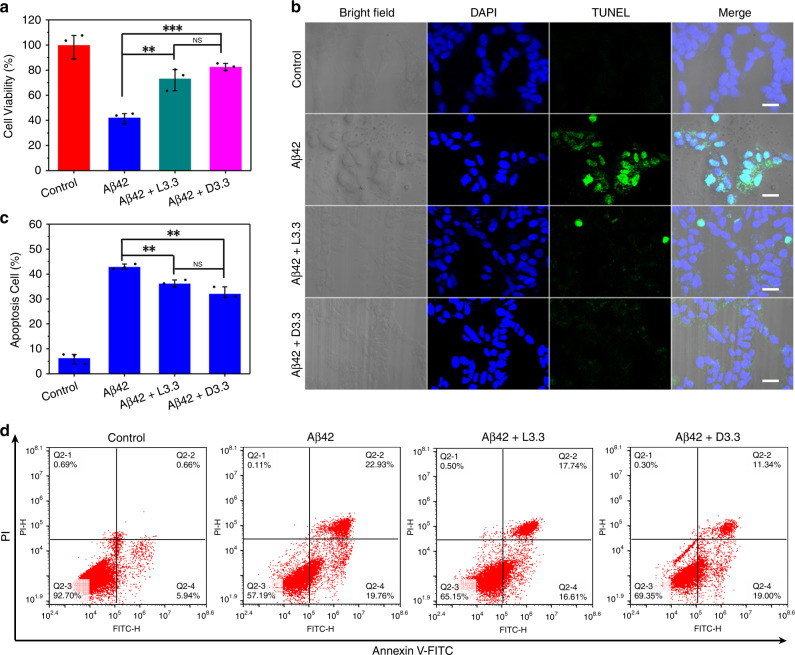
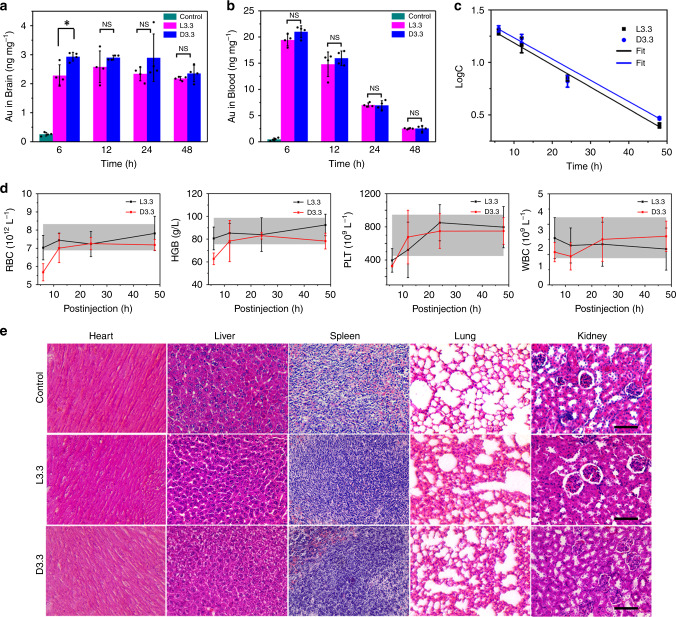
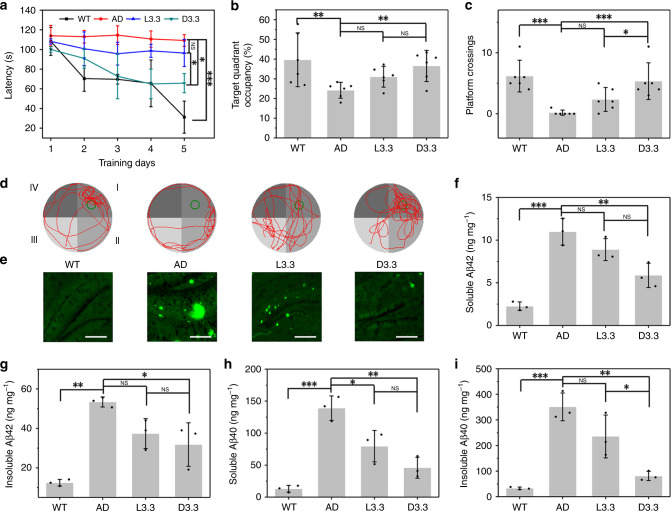
Preventing aggregation of amyloid beta (Aβ) peptides is a promising strategy for the treatment of Alzheimer's disease (AD), and gold nanoparticles have previously been explored as a potential anti-Aβ therapeutics. Here we design and prepare 3.3 nm L- and D-glutathione stabilized gold nanoparticles (denoted as L3.3 and D3.3, respectively). Both chiral nanoparticles are able to inhibit aggregation of Aβ42 and cross the blood-brain barrier (BBB) following intravenous administration without noticeable toxicity. D3.3 possesses a larger binding affinity to Aβ42 and higher brain biodistribution compared with its enantiomer L3.3, giving rise to stronger inhibition of Aβ42 fibrillation and better rescue of behavioral impairments in AD model mice. This conjugation of a small nanoparticle with chiral recognition moiety provides a potential therapeutic approach for AD.
Overview
The claims and statistics of this paper haven’t been checked yet.
Run the check — free, no account needed. It reads the open-access text and checks the sources it cites.
Integrity signals
Registry
Cites
Statistics
Figures
Verification
Claims the paper makes
The claims and statistics of this paper haven’t been checked yet.
Run the check — free, no account needed. It reads the open-access text and checks the sources it cites.
Claims other papers make about this one
Each is checked against this paper’s own text: does it say what the citing paper says it does?
The cited source says what the claim attributes to it.
In the citing paper
“the D-GSH-stabilized gold nanoparticles at 3.3 nm (D3.3) possessed higher brain distribution compared to its enantiomer (L-GSH-stabilized nanoparticles, L3.3).”
From The blood–brain barrier: Structure, regulation and drug delivery (2023) · cites this paper as [294]
The cited source says what the claim attributes to it.
In the citing paper
“Together with a larger binding affinity towards amyloid-β of D3.3”
From The blood–brain barrier: Structure, regulation and drug delivery (2023) · cites this paper as [294]
Self-check
Percentages, sums and reported differences re-computed from the paper’s own numbers.
The self-check needs the paper’s full text.
Citations
Cites
Generalized Gradient Approximation Made Simple
Perdew, J. P., Burke, K., & Ernzerhof, M. (1996) · Physical Review Letters · doi:10.1103/physrevlett.77.3865 · Cited by 215,824
Efficient iterative schemes for ab initio total-energy calculations using a plane-wave basis set
Kresse, G., & Furthmüller, J. (1996) · Physical Review B · doi:10.1103/physrevb.54.11169 · Cited by 123,652
Projector augmented-wave method
Blöchl, P. E. (1994) · Physical Review B · doi:10.1103/physrevb.50.17953 · Cited by 92,732
AutoDock4 and AutoDockTools4: Automated docking with selective receptor flexibility
Morris, G. M., Huey, R., Lindstrom, W., Sanner, M. F., Belew, R. K., Goodsell, D. S., & Olson, A. J. (2009) · Journal of Computational Chemistry · doi:10.1002/jcc.21256 · Cited by 26,294
Neurodegenerative diseases and oxidative stress
Barnham, K. J., Masters, C. L., & Bush, A. I. (2004) · Nature Reviews Drug Discovery · doi:10.1038/nrd1330 · Cited by 3,683
The golden age: gold nanoparticles for biomedicine
Dreaden, E. C., Alkilany, A. M., Huang, X., Murphy, C. J., & El‐Sayed, M. A. (2011) · Chemical Society Reviews · doi:10.1039/c1cs15237h · Cited by 3,659
Sreerama, N., & Woody, R. W. (2000) · Analytical Biochemistry · doi:10.1006/abio.2000.4880 · Cited by 3,046
Karran, E., Mercken, M., & Strooper, B. D. (2011) · Nature Reviews Drug Discovery · doi:10.1038/nrd3505 · Cited by 2,188
The Amyloid State of Proteins in Human Diseases
Eisenberg, D. S., & Jucker, M. (2012) · Cell · doi:10.1016/j.cell.2012.02.022 · Cited by 1,769
Structural conversion of neurotoxic amyloid-β1–42 oligomers to fibrils
Ahmed, M., Davis, J., Aucoin, D., Sato, T., Ahuja, S., Aimoto, S., Elliott, J. I., Van Nostrand, W. E., & Smith, S. O. (2010) · Nature Structural & Molecular Biology · doi:10.1038/nsmb.1799 · Cited by 1,111
Cited by
Sorted by citations
The blood–brain barrier: Structure, regulation and drug delivery
Wu, D., Chen, Q., Chen, X., Han, F., Chen, Z., & Wang, Y. (2023) · Signal Transduction and Targeted Therapy · doi:10.1038/s41392-023-01481-w · Cited by 1,906
“294 It is known that GSH transporters at high level in the brain promoted the BBB permeability of GSH-capped nanoparticles.”
BackgroundRu, Y., Sui, L., Song, H., Liu, X., Tang, Z., Zang, S., Yang, B. J., & Lu, S. (2021) · Angewandte Chemie International Edition · doi:10.1002/anie.202103336 · Cited by 290
Self-citationChiral carbon dots: synthesis, optical properties, and emerging applications
Döring, A., Ushakova, E. V., & Rogach, A. L. (2022) · Light Science & Applications · doi:10.1038/s41377-022-00764-1 · Cited by 300
Self-assembled inorganic chiral superstructures
Lv, J., Gao, X., Han, B. Q., Zhu, Y., Hou, K., & Tang, Z. (2022) · Nature Reviews Chemistry · doi:10.1038/s41570-021-00350-w · Cited by 271
Self-citationIn situ analysis of nanoparticle soft corona and dynamic evolution
Baimanov, D., Wang, J., Zhang, J., Liu, K., Cong, Y., Shi, X., Zhang, X., Li, Y., Li, X., Qiao, R., et al. (2022) · Nature Communications · doi:10.1038/s41467-022-33044-y · Cited by 220
Self-citation
Metadata
- Authors
- Hou, K., Zhao, J., Wang, H., Li, B., Li, K., Shi, X., Wan, K., Ai, J., Lv, J., Wang, D., Huang, Q., Wang, H., Cao, Q., Liu, S., & Tang, Z.
- Affiliations
- Peking University (CN)
- Harbin Institute of Technology (CN)
- National Center for Nanoscience and Technology (CN)
- Sun Yat-sen University (CN)
- Harbin Medical University (CN)
- Howard Hughes Medical Institute (US)
- Corresponding author
- Liu, Shaoqin
- Tang, Zhiyong
- ORCID
- Venue
- Nature Communications
- Published
- 2020-09-22
- Volume
- 11
- Issue
- 1
- Pages
- 4790-4790
- ISSN
- 2041-1723 (ISSN-L)
- PMC
- PMC7509831
- OpenAlex
- W3088242221
- Cited by
- 373
- References
- 51
- Citations by year
- 2026: 41 · 2025: 79 · 2024: 76 · 2023: 68 · 2022: 68 · 2021: 40 · 2020: 1
- FWCI
- 26.62
- Type
- journal article
- Language
- en
- Open access
- gold
- doi.org
- Locations
- Nature Communications (publishedVersion, cc-by)
- PubMed Central (publishedVersion, cc-by)
- PubMed (publishedVersion)
- RePEc: Research Papers in Economics (submittedVersion)
- DOAJ (DOAJ: Directory of Open Access Journals) (submittedVersion, cc-by-sa)
- Griffith Research Online (submittedVersion, cc-by)
- Funders
- Howard Hughes Medical Institute
- National Natural Science Foundation of China (2014CB931801, 21890381, 21721002, 21721002 and 21475029, 21890381, QYZDJ-SSW-SLH038, 21721002, 21475029, 2016YFA0200700, 51825202)
- Chinese Academy of Sciences (2016YFA0200700, QYZDJ‐SSW‐SLH038, 21721002)
- Peking University
- K. C. Wong Education Foundation
- National Science Fund for Distinguished Young Scholars (51825202)
- Topics
- Life Sciences › Neuroscience › Cellular and Molecular Neuroscience › Alzheimer's disease research and treatments
- Physical Sciences › Materials Science › Biomaterials › Nanoparticle-Based Drug Delivery
- Physical Sciences › Materials Science › Electronic, Optical and Magnetic Materials › Gold and Silver Nanoparticles Synthesis and Applications
- Keywords
- gold nanoparticles, chiral nanoparticles, Alzheimer's disease, amyloid-beta 42, amyloid aggregation inhibition, enantiomers, blood-brain barrier penetration, brain biodistribution, memory impairment, anti-amyloid therapy, nanoparticle drug delivery
- MeSH terms
- Alzheimer Disease, Animals, Blood-Brain Barrier, Brain, Cell Survival, Disease Models, Animal, Gold, Male, Memory Disorders, Mice, Inbred C57BL, Peptide Fragments, Stereoisomerism, Amyloid beta-Peptides, Mice, Metal Nanoparticles, Molecular Docking Simulation
About these checks
Registry, retraction, Cites and statistics results are computed, not judged, with one exception: a printed reference that no index lists is read once by a model before it counts as a citation error. Claims are extracted by a model and kept only when their quote appears verbatim in the text; each cited source is then checked, with a model’s help, for whether it says what the claim relies on. Those verdicts can be wrong — read the claim’s quote and the cited source before relying on one.
Statistics and arithmetic are recomputed, not judged.
Confidence bands are shown only for fields calibrated on our annotated test set. None is calibrated yet, so no band is shown.
What counts as a claim ›How we measure confidence ›How we check this ›
Are you an author, or do you see a problem with this page? Request a review
