

The DOI matches its Crossref record; 53 of the 53 references it cites were found in a registry or an index.
Impacts of solar intermittency on future photovoltaic reliability.
Open accessAbstract
As photovoltaic power is expanding rapidly worldwide, it is imperative to assess its promise under future climate scenarios. While a great deal of research has been devoted to trends in mean solar radiation, less attention has been paid to its intermittent character, a key challenge when compounded with uncertainties related to climate variability. Using both satellite data and climate model outputs, we characterize solar radiation intermittency to assess future photovoltaic reliability. We find that the relation between the future power supply and long-term mean solar radiation trends is spatially heterogeneous, showing power reliability is more sensitive to the fluctuations of mean solar radiation in hot arid regions. Our results highlight how reliability analysis must account simultaneously for the mean and intermittency of solar inputs when assessing the impacts of climate change on photovoltaics.
Overview
The claims and statistics of this paper haven’t been checked yet.
Run the check — free, no account needed. It reads the open-access text and checks the sources it cites.
Integrity signals
Registry
Cites
Statistics
Figures
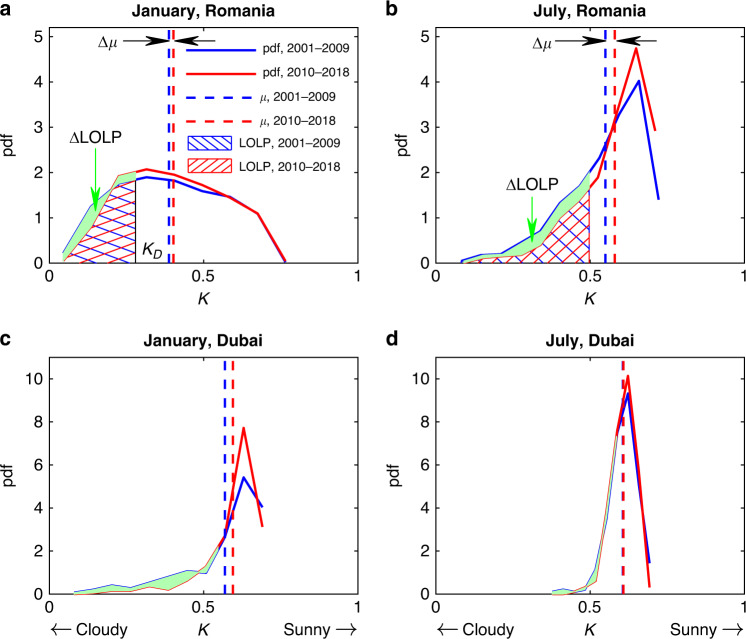
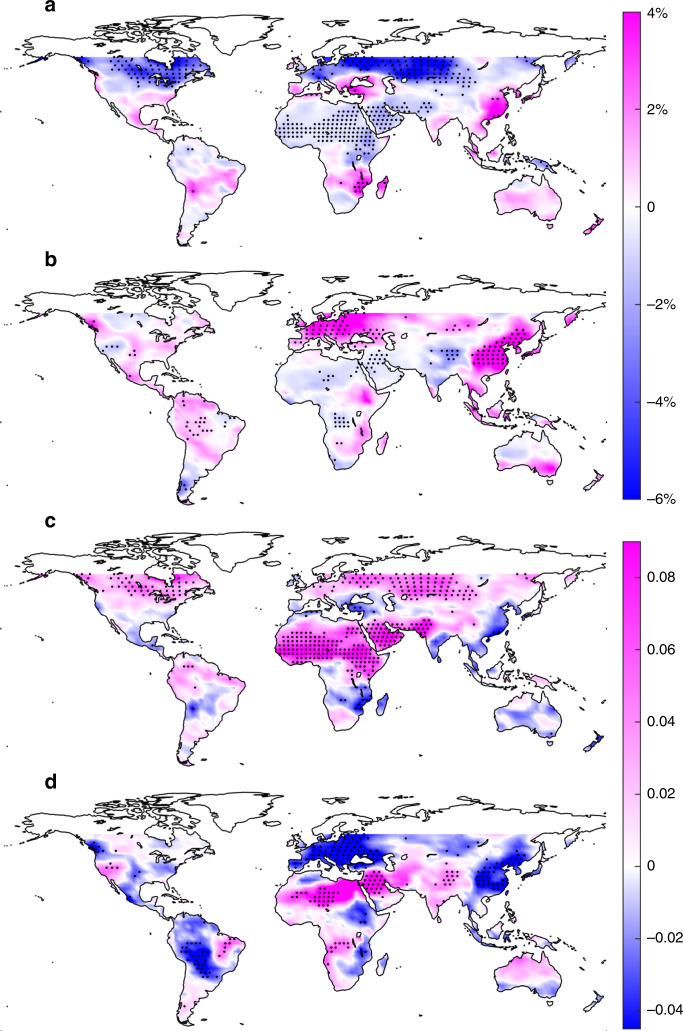
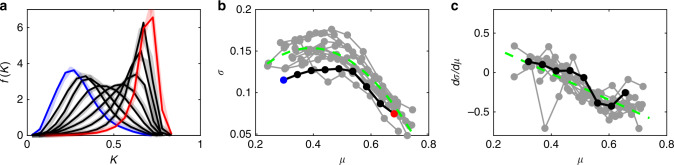
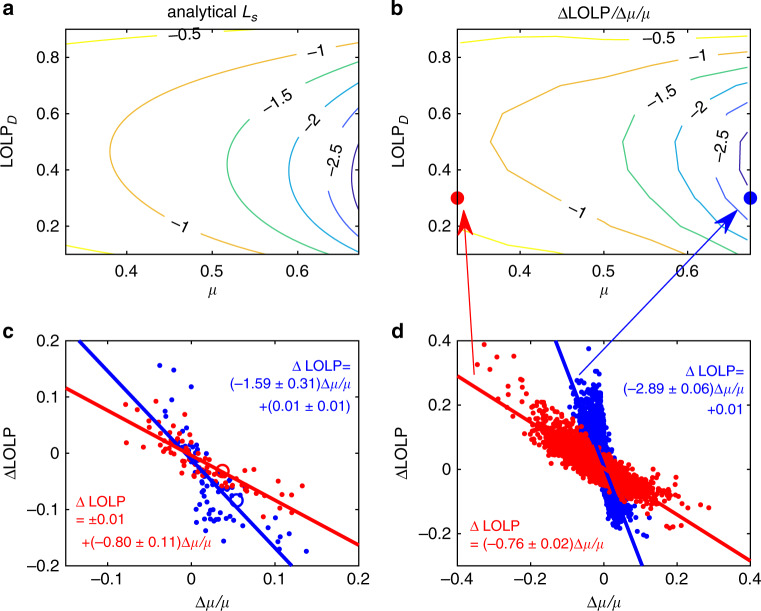
Verification
Claims the paper makes
The claims and statistics of this paper haven’t been checked yet.
Run the check — free, no account needed. It reads the open-access text and checks the sources it cites.
Claims other papers make about this one
Each is checked against this paper’s own text: does it say what the citing paper says it does?
In the citing paper
“In that regard, biofuels will not be the only solution but an essential building block in a network with other physical (i.e., wind power, photovoltaic systems [103–105]) and chemical technologies (i.e., Sabatier process, Power to X [106,107]) that together can provide carbon neutral or even carbon negative energy and mobility solutions.”
From The potential of biofuels from first to fourth generation (2023) · cites this paper as [104]
Self-check
Percentages, sums and reported differences re-computed from the paper’s own numbers.
The self-check needs the paper’s full text.
Citations
Cites
The next generation of scenarios for climate change research and assessment
Moss, R. H., Edmonds, J. A., Hibbard, K. A., Manning, M. R., Rose, S. K., van Vuuren, D. P., Carter, T. R., Emori, S., Kainuma, M., Kram, T., et al. (2010) · Nature · doi:10.1038/nature08823 · Cited by 6,467
Jansen, E. H., Overpeck, J. T., Briffa, K., Duplessy, J., Joos, F., Masson-Delmotte, Olago, D., Otto‐Bliesner, B. L., Peltier, W. R., Rahmstorf, S., et al. (2007) · UEA Digital Repository (University of East Anglia) · Cited by 4,577
The interrelationship and characteristic distribution of direct, diffuse and total solar radiation
Liu, B. Y. H., & Jordan, R. C. (1960) · Solar Energy · doi:10.1016/0038-092x(60)90062-1 · Cited by 2,561
Trenberth, K. E., Fasullo, J., & Kiehl, J. T. (2008) · Bulletin of the American Meteorological Society · doi:10.1175/2008bams2634.1 · Cited by 2,068
Change, I. P. O. C. (2014) · Cambridge University Press eBooks · doi:10.1017/cbo9781107415324.016 · Cited by 1,482
The National Solar Radiation Data Base (NSRDB)
Sengupta, M., Xie, Y., Lopez, A., Habte, A., Maclaurin, G. J., & Shelby, J. (2018) · Renewable and Sustainable Energy Reviews · doi:10.1016/j.rser.2018.03.003 · Cited by 1,466
Dubey, S., Sarvaiya, J. N., & Seshadri, B. (2013) · Energy Procedia · doi:10.1016/j.egypro.2013.05.072 · Cited by 1,427
Micropower System Modeling with Homer
Lambert, T., Gilman, P., & Lilienthal, P. D. (2005) · doi:10.1002/0471755621.ch15 · Cited by 813
Changes in rainfall seasonality in the tropics
Feng, X. D., Porporato, A. M., & Rodriguez-Iturbe, I. (2013) · Nature Climate Change · doi:10.1038/nclimate1907 · Cited by 662
Self-citation
Cited by
Sorted by citations
Ede, S. R., & Luo, Z. (2021) · Journal of Materials Chemistry A · doi:10.1039/d1ta04032d · Cited by 287
The potential of biofuels from first to fourth generation
Cavelius, P., Engelhart-Straub, S., Mehlmer, N., Lercher, J., Awad, D., & Brück, T. (2023) · PLOS Biology · doi:10.1371/journal.pbio.3002063 · Cited by 224
Inherent spatiotemporal uncertainty of renewable power in China
Wang, J., Chen, L., Tan, Z., Du, E., Liu, N., Ma, J., Sun, M., Li, C., Song, J., Lu, X., et al. (2023) · Nature Communications · doi:10.1038/s41467-023-40670-7 · Cited by 193
Chen, Q., Kuang, Z., Liu, X., & Zhang, T. (2022) · Applied Energy · doi:10.1016/j.apenergy.2022.118744 · Cited by 120
Globally interconnected solar-wind system addresses future electricity demands
Jiang, H., Yao, L., Qin, J., Bai, Y., Brandt, M., Lian, X., Davis, S. J., Lu, N., Zhao, W., Liu, T., et al. (2025) · Nature Communications · doi:10.1038/s41467-025-59879-9 · Cited by 99
Energy management for solar-hydrogen microgrids with vehicle-to-grid and power-to-gas transactions
Hou, L., Dong, J., Herrera, O. E., & Mérida, W. (2022) · International Journal of Hydrogen Energy · doi:10.1016/j.ijhydene.2022.09.238 · Cited by 87
Kim, J. H., Lin, J., Kim, J., Roh, I., Lee, S., & Yang, P. (2024) · Nature Catalysis · doi:10.1038/s41929-024-01198-1 · Cited by 80
Yoo, G., Koo, B., & An, G. (2022) · Chemical Engineering Journal · doi:10.1016/j.cej.2022.134738 · Cited by 75
Kuang, Y., He, R., Gu, X., Yang, F., Tian, X., & Feng, L. (2022) · Chemical Engineering Journal · doi:10.1016/j.cej.2022.141055 · Cited by 71
Accurate nowcasting of cloud cover at solar photovoltaic plants using geostationary satellite images
Xia, P., Zhang, L., Min, M., Li, J., Wang, Y., Yu, Y., & Jia, S. (2024) · Nature Communications · doi:10.1038/s41467-023-44666-1 · Cited by 70
Recent and projected changes in climate patterns in the Middle East and North Africa (MENA) region
Francis, D., & Fonseca, R. (2024) · Scientific Reports · doi:10.1038/s41598-024-60976-w · Cited by 77
Jiang, H., Lu, N., Yao, L., Qin, J., & Liu, T. (2023) · Renewable Energy · doi:10.1016/j.renene.2023.03.114 · Cited by 71
Ye, J., Gu, W., Hu, J. R., Chen, L., Yang, C., Gao, J., & Zhou, S. (2025) · Chemical Reviews · doi:10.1021/acs.chemrev.5c00658 · Cited by 68
Technological development in solar dryers from 2016 to 2021-A review
Saini, R. K., Saini, D. K., Gupta, R., Verma, P., Thakur, R., Kumar, S., & Wassouf, A. (2023) · Renewable and Sustainable Energy Reviews · doi:10.1016/j.rser.2023.113855 · Cited by 64
Furlan, G., & You, F. (2024) · Advances in Applied Energy · doi:10.1016/j.adapen.2024.100164 · Cited by 61
Khamgaonkar, S. S., Taka, A. L., & Maheshwari, V. (2024) · Advanced Functional Materials · doi:10.1002/adfm.202405414 · Cited by 57
Designing carbon dots for enhanced photo-catalysis: Challenges and opportunities
Zdražil, L., Cadranel, A., Medveď, M., Otyepka, M., Zbořil, R., & Guldi, D. M. (2024) · Chem · doi:10.1016/j.chempr.2024.07.018 · Cited by 56
Enhancing Short-Term Solar Photovoltaic Power Forecasting Using a Hybrid Deep Learning Approach
Thipwangmek, N., Suetrong, N., Taparugssanagorn, A., Tangparitkul, S., & Promsuk, N. (2024) · IEEE Access · doi:10.1109/access.2024.3440035 · Cited by 54
Changes in solar resource intermittency and reliability under Australia’s future warmer climate
Poddar, S., Kay, M. J., Prasad, A. A., Evans, J. P., & Bremner, S. (2023) · Solar Energy · doi:10.1016/j.solener.2023.112039 · Cited by 47
Scalable Photovoltaic‐Electrochemical Cells for Hydrogen Production from Water ‐ Recent Advances
Lee, M., Haas, S., Smirnov, V., Merdzhanova, T., & Rau, U. (2022) · ChemElectroChem · doi:10.1002/celc.202200838 · Cited by 48
Carneiro, P. M. R., Vidal, J. V., Rolo, P., Peres, I., Ferreira, J., Kholkin, A. L., & dos Santos, M. P. S. (2022) · Mechanical Systems and Signal Processing · doi:10.1016/j.ymssp.2022.108898 · Cited by 44
Sarker, M. T., Qwaid, M. A., Shern, S. J., & Ramasamy, G. (2025) · World Electric Vehicle Journal · doi:10.3390/wevj16070385 · Cited by 41
Unveiling deployable rooftop solar potential across Chinese cities
Shi, M., Lu, X., & Craig, M. (2025) · Nature Cities · doi:10.1038/s44284-025-00270-6 · Cited by 40
Saxena, A., Brown, C., Arneth, A., & Rounsevell, M. (2024) · Communications Earth & Environment · doi:10.1038/s43247-024-01754-4 · Cited by 39
Lee, S., Han, I. K., Jeon, N. G., Lee, Y., Son, H. B., Han, D., Nam, S., Chung, T., Kwak, M., Kim, Y. S., et al. (2023) · Advanced Science · doi:10.1002/advs.202304915 · Cited by 36
Unsupervised discovery of thin-film photovoltaic materials from unlabeled data
Wang, Z., Cai, J., Wang, Q., Wu, S., & Li, J. (2021) · npj Computational Materials · doi:10.1038/s41524-021-00596-4 · Cited by 38
High Emission Scenario Substantially Damages China's Photovoltaic Potential
Lu, N., Yao, L., Qin, J., Yang, K., Wild, M., & Jiang, H. (2022) · Geophysical Research Letters · doi:10.1029/2022gl100068 · Cited by 37
Barkanov, E., Peñalba, M., Martinez, A., Martinez-Perurena, A., Zarketa‐Astigarraga, A., & Iglesias, G. (2024) · Energy Conversion and Management · doi:10.1016/j.enconman.2023.118058 · Cited by 36
Risk in solar energy: Spatio-temporal instability and extreme low-light events in China
Guo, J., Li, R., Cai, P., Xiao, Z., Fu, H., Guo, T., Wang, T.-Y., Zhang, X., Wang, J., & Song, X. (2024) · Applied Energy · doi:10.1016/j.apenergy.2024.122749 · Cited by 35
Xu, Y., Wang, X., Qi, X., Zhao, Q., Dai, S., Zheng, Y., Wang, S., Wu, X., & Zeng, X. (2022) · ACS Sustainable Chemistry & Engineering · doi:10.1021/acssuschemeng.2c04772 · Cited by 33
Guo, H. Y., Hu, B., Shan, H., Li, Z., Qi, W., & Li, B. (2024) · Chemical Engineering Journal · doi:10.1016/j.cej.2024.153361 · Cited by 33
Life cycle cost analysis of solar energy via environmental externality monetization
Huang, B., Wang, Y., Huang, Y., Xu, X., Chen, X., Duan, L., Yu, G., Li, Z., Liu, H., Kua, H. W., et al. (2022) · The Science of The Total Environment · doi:10.1016/j.scitotenv.2022.158910 · Cited by 31
Babu, R. M., Alam, M. S., Islam, A., & Islam, M. K. (2025) · IEEE Access · doi:10.1109/access.2025.3614771 · Cited by 31
Changes in photovoltaic potential over China in a warmer future
Zhang, J., You, Q., & Ullah, S. (2022) · Environmental Research Letters · doi:10.1088/1748-9326/ac9e0b · Cited by 31
Projected patterns of climate change impact on photovoltaic energy potential: A case study of Iraq
Ghanim, M. S., & Farhan, A. A. (2023) · Renewable Energy · doi:10.1016/j.renene.2023.01.027 · Cited by 31
Transformer approach to nowcasting solar energy using geostationary satellite data
Li, R., Wang, D., Wang, Z., Liang, S., Li, Z., Xie, Y., & He, J. (2024) · Applied Energy · doi:10.1016/j.apenergy.2024.124387 · Cited by 29
Jiang, H., Zhang, X., Yao, L., Lu, N., Qin, J., Liu, T., & Zhou, C. (2023) · Applied Energy · doi:10.1016/j.apenergy.2023.121553 · Cited by 29
Chisale, S. W., Lee, H. S., Calvo, M. S., Jeong, J.-S., Aljber, M., Williams, Z., & Cabrera, J. S. (2024) · Renewable Energy · doi:10.1016/j.renene.2024.122084 · Cited by 27
Prediction of Solar Power Using Near-Real Time Satellite Data
Prasad, A. A., & Kay, M. J. (2021) · Energies · doi:10.3390/en14185865 · Cited by 27
Hao, W., Kong, Q., Huber, M. S., Sun, M., & Craig, M. (2025) · Joule · doi:10.1016/j.joule.2025.102218 · Cited by 26
Chen, Q., Kuang, Z., Liu, X., & Zhang, T. (2022) · Journal of Cleaner Production · doi:10.1016/j.jclepro.2022.135761 · Cited by 25
Terrén-Serrano, G., & Martínez‐Ramón, M. (2023) · Renewable and Sustainable Energy Reviews · doi:10.1016/j.rser.2022.113125 · Cited by 27
A Review of Solar and Wind Energy Resource Projection Based on the Earth System Model
Chen, G., & Ji, Z. (2024) · Sustainability · doi:10.3390/su16083339 · Cited by 24
Techno-economic and environmental assessment of closed-loop photovoltaic recycling in China
Wang, Q., Wang, Y., Huang, B., Wang, Y., Wang, X., Long, Y., & Dou, Y. (2025) · Sustainable Production and Consumption · doi:10.1016/j.spc.2025.02.025 · Cited by 24
Hamed, M. H., Hassan, H. A. A., Ookawara, S. A., & Nada, S. A. (2024) · Energy · doi:10.1016/j.energy.2024.132700 · Cited by 24
Enhancing solar PV reliability with hybrid local features and infrared thermography
Ahmed, W. (2024) · Energy Reports · doi:10.1016/j.egyr.2024.12.014 · Cited by 23
Song, Z., Huang, L., Dong, Q., Zhang, G., Chew, M. Y. L., Setunge, S., & Shi, L. X. (2025) · Energy · doi:10.1016/j.energy.2025.135219 · Cited by 21
Jiang, H., Yao, L., Lu, N., Qin, J., Zhang, X., Liu, T., Zhang, X., & Zhou, C. (2024) · Energy · doi:10.1016/j.energy.2024.130721 · Cited by 22
Lara-Cerecedo, L. O., Hinojosa, J. F., Pitalúa-Díaz, N., Matsumoto, Y., & González-Ángeles, Á. (2023) · Energies · doi:10.3390/en16166050 · Cited by 24
Droplet-based synthesis of microencapsulated phase change hydrogels via electro-coalescence
Fang, W., Tao, Z., Liu, S., Yin, S., Shen, X., Xiao, L., Li, H., Wong, T., & Huang, Y. (2026) · Journal of Colloid and Interface Science · doi:10.1016/j.jcis.2025.139787 · Cited by 17
Dai, Y., Williams, I. N., & Qiu, S. (2020) · Journal of Geophysical Research Atmospheres · doi:10.1029/2020jd033821 · Cited by 17
Sarsah, E. A., Sunnu, A. K., & Bawa, A.-R. (2024) · iEnergy · doi:10.23919/ien.2024.0004 · Cited by 17
Graphene-doped polymer microencapsulated n-Octadecane for heat storage and photothermal conversion
Duan, S., Zhao, K., Wang, J., & Xie, H. (2024) · International Journal of Heat and Fluid Flow · doi:10.1016/j.ijheatfluidflow.2024.109480 · Cited by 17
Jia, B., & Su, J. (2024) · Energies · doi:10.3390/en17174459 · Cited by 16
Tang, L., Han, Y., Zhou, S., Zalhaf, A. S., Yang, P., Wang, C., Huang, T., & Lu, C. (2025) · Energy · doi:10.1016/j.energy.2025.134864 · Cited by 16
Wang, H., Чэн, Б., & Gong, P. (2025) · Landscape and Urban Planning · doi:10.1016/j.landurbplan.2025.105521 · Cited by 15
Zhang, Y., Li, A., Fei, Y., Zhang, C., Zhu, L., & Huang, Z. (2024) · Journal of CO2 Utilization · doi:10.1016/j.jcou.2024.102905 · Cited by 17
Zhao, Z., Lan, Y., Xu, S., Zou, H., & Du, H. (2024) · Energy Economics · doi:10.1016/j.eneco.2024.107926 · Cited by 15
Maihulla, A. S., Yusuf, İ., & Isa, M. S. (2021) · International Journal of Quality & Reliability Management · doi:10.1108/ijqrm-03-2021-0071 · Cited by 15
Inherent Spatiotemporal Uncertainty of Renewable Power in ChinaPreprint
Wang, J., Chen, L., Tan, Z., Du, E., Liu, N., Ma, J., Sun, M., Li, C., Song, J., Lu, X., et al. (2022) · Research Square · doi:10.21203/rs.3.rs-2284531/v1 · Cited by 15
Membrane-free redox flow battery with polymer electrolytes
Gautam, R. K., Wang, X., & Jiang, J. (2025) · Nature Communications · doi:10.1038/s41467-025-63878-1 · Cited by 14
Risk-Aware Operating Regions for PV-Rich Distribution Networks Considering Irradiance Variability
Duque, E. M. S., Giraldo, J. S., Vergara, P. P., Nguyen, P. H., van der Molen, A., & Slootweg, J. G. (2023) · IEEE Transactions on Sustainable Energy · doi:10.1109/tste.2023.3281890 · Cited by 14
Carneiro, P. M. R., Vidal, J. V., Rolo, P., & dos Santos, M. P. S. (2024) · Mechanical Systems and Signal Processing · doi:10.1016/j.ymssp.2024.111360 · Cited by 14
Rolo, P., Vidal, J. V., Kholkin, A. L., & dos Santos, M. P. S. (2024) · Communications Engineering · doi:10.1038/s44172-024-00249-6 · Cited by 17
Advancing solar and wind penetration in China through energy complementarity
Hu, Y., Jiang, H., Zhang, C., Yuan, J., Zhang, M., Yao, L., Chen, Q., Wu, J., Zhang, H., Ma, S., et al. (2026) · Nature · doi:10.1038/s41586-026-10570-z · Cited by 13
Temiz, M., & Dinçer, İ. (2023) · Journal of Energy Storage · doi:10.1016/j.est.2023.108415 · Cited by 13
Photovoltaic installations are extensively deployed in areas at risk of extremely low production
Wang, Q., Liu, K., Xie, W., Ali, T., Wu, J., & Wang, M. (2024) · Communications Earth & Environment · doi:10.1038/s43247-024-01932-4 · Cited by 14
Khalkho, A. M., Rapada, B., Majumder, G., Cherukuri, M., & Mohanta, D. K. (2022) · Frontiers in Energy Research · doi:10.3389/fenrg.2022.851449 · Cited by 12
Reduced Order Based Active Disturbance Rejection Controller Design with Applications
Safiullah, & Hote, Y. V. (2023) · IETE Technical Review · doi:10.1080/02564602.2023.2165178 · Cited by 10
Impact of spatial layout optimization on photovoltaic power consumption: insights from China
Jiang, H., Yao, L., Zhang, X., Liu, T., Chen, M., & Zhou, C. (2024) · International Journal of Digital Earth · doi:10.1080/17538947.2024.2447339 · Cited by 10
Global Solar Droughts Due To Supply‐Demand Imbalance Exacerbated by Anthropogenic Climate Change
Lei, Y., Wang, Z., Xu, Y., Yu, X., Tian, C., Li, Z., Li, L., Zhong, J., Guo, L., Liu, L., et al. (2024) · Geophysical Research Letters · doi:10.1029/2024gl112162 · Cited by 10
Chen, Y., Xu, J., Chen, Y., Xie, Z., & Munroe, P. R. (2023) · Small · doi:10.1002/smll.202302781 · Cited by 9
Zheng, J., Chen, M., Yuan, H., Luo, J., Wang, Y., Nai, J., Tao, X., & Liu, Y. (2023) · Chinese Chemical Letters · doi:10.1016/j.cclet.2023.108812 · Cited by 8
Dimnik, J., Božič, J. T., Čikić, A., & Muhič, S. (2024) · Energies · doi:10.3390/en17133170 · Cited by 8
Zhang, L., Ling, G., Ye, Q., Liu, N., Zhang, J., Li, S., & Shao, J. (2025) · Solar Energy · doi:10.1016/j.solener.2025.113429 · Cited by 8
Photovoltaic–electrochemical coupled architectures for next-generation solar batteries
Khajuria, G., Nazir, R., Abaszade, R. G., Sundramoorthy, A. K., Singh, A., & Arya, S. K. (2026) · Journal of Energy Storage · doi:10.1016/j.est.2026.121193 · Cited by 8
Butt, O. M., Ahmad, M. S., Lun, T. K., Seng, H., Fayaz, H., Rahim, N. A., Koziol, K. K., Radwan, N., Khan, M. A., Khan, N. A., et al. (2022) · Waste Management · doi:10.1016/j.wasman.2022.11.016 · Cited by 8
Coproduction of Integrated Weather and Climate Services to Support Net-Zero Energy Transitions
Troccoli, A., Fuchs, T., Boscolo, R., Matt, E., & Bastani, H. (2024) · Bulletin of the American Meteorological Society · doi:10.1175/bams-d-23-0029.1 · Cited by 7
Li, H., Zhang, J., Cui, X., Liu, X., Zhang, T., & Liu, X. (2025) · Energy Conversion and Management · doi:10.1016/j.enconman.2025.120171 · Cited by 7
Ding, N., Zhang, Z., Yang, J., Li, X., Sun, S., & Zhao, S. (2025) · Renewable and Sustainable Energy Reviews · doi:10.1016/j.rser.2025.116325 · Cited by 7
Perovskite solar cells: recent progress and future prospects
Shevaleevskiy, O. I. (2020) · Nanosystems Physics Chemistry Mathematics · doi:10.17586/2220-8054-2020-11-6-716-728 · Cited by 7
Optimal Resource Allocation for Carbon Mitigation
Cerasoli, S., & Porporato, A. M. (2023) · Sustainability · doi:10.3390/su151310291 · Cited by 7
Self-citationZhu, X., Jiang, X.-T., Pang, Z.-H., Guo, J.-C., Zhang, X.-S., Li, W., Luan, J., & Liu, Y. (2025) · International Journal of Hydrogen Energy · doi:10.1016/j.ijhydene.2025.150117 · Cited by 6
Negotiating the energy transition: Governance trade-offs in solar deployment
Eitan, A. (2025) · Energy Strategy Reviews · doi:10.1016/j.esr.2025.101854 · Cited by 7
Jajini, M., Vadivoo, N. S., Gangatharan, S., & Balasundar, C. (2026) · Journal of Energy Storage · doi:10.1016/j.est.2026.120489 · Cited by 6
Feng, S., Zhong, Z., He, H., Liu, R., Chen, J.-J., Huang, X., Zhu, Y., & Hong, Y. (2024) · Optics Express · doi:10.1364/oe.538608 · Cited by 6
Reliability of photo-voltaic power plants
Cohen, D., & Elmakis, D. (2023) · Electric Power Systems Research · doi:10.1016/j.epsr.2023.109736 · Cited by 6
Frequency domain enhanced transformer network for robust photovoltaic power prediction
Si, G., Xie, M., Luo, F., Xia, T., & Xi, L. (2026) · Solar Energy · doi:10.1016/j.solener.2026.114358 · Cited by 5
Xu, X., Yang, L., Qiao, Y., Xiang, C., Chen, L., & Liu, Y. (2026) · Renewable Energy · doi:10.1016/j.renene.2026.125382 · Cited by 5
Nonaqueous Organic Slurry Battery over 4 V
Gautam, R. K., McGrath, J. J., Wang, X., & Jiang, J. (2024) · ACS Energy Letters · doi:10.1021/acsenergylett.4c01470 · Cited by 5
Vargas‐Salgado, C., Alfonso-Solar, D., Gómez‐Navarro, T., Díaz-Bello, D., & Montalvá, C. M. (2025) · Sustainable Energy Technologies and Assessments · doi:10.1016/j.seta.2025.104602 · Cited by 4
Updating global green-hydrogen production costs and configurations under future climates
Wu, H., Sun, M., & Craig, M. (2026) · The Innovation · doi:10.1016/j.xinn.2026.101303 · Cited by 4
Photovoltaic performance degradation from dust and cleaning frequency in tropical Indonesia
Sibagariang, Y. P., Rosyid, O. A., Priyadi, A., Tarno, Sutrisno, B., Kamil, B., Lande, N. M., Khairiani, D., Ridlo, M. R., & Sitorus, T. B. (2026) · Solar Energy · doi:10.1016/j.solener.2026.114421 · Cited by 4
An Integrated Hydroclimatic Assessment of Future Reservoir and Hydropower Operations in the U.S.
Bokhari, H. H., Corsi, F., Miara, A., Fekete, B. M., Gangrade, S., Kao, S., Jackson, N. D., & Vörösmarty, C. J. (2025) · Earth s Future · doi:10.1029/2025ef006203 · Cited by 4
Tang, C. Q., Mialhe, P., Pohl, B., Morel, B., Wild, M., Koseki, S., Abiodun, B. J., Bessafi, M., Lennard, C., Beeharry, G. K., et al. (2023) · Solar Energy · doi:10.1016/j.solener.2023.111856 · Cited by 4
Zou, Z., Ding, Q., Tong, Y., Wei, Y., Zhou, J., & Wu, Y. (2025) · Energy Ecology and Environment · doi:10.1007/s40974-025-00358-8 · Cited by 4
COP26 Visions for a Net Zero Future – Regional Profile for the Arabian PeninsulaPreprint
Short, S. W., Molini, A., Santamarina, J. C., & Friedrich, L. (2021) · doi:10.33774/coe-2021-29q7b · Cited by 4
Self-citationChapter 5 : Energy Supply, Delivery, and Demand. Fifth National Climate Assessment
Zamuda, C. D., Bilello, D. E., Carmack, J., Davis, X. J., Efroymson, R. A., Goff, K. M., Hong, T., Karimjee, A., Loughlin, D. H., Upchurch, S., et al. (2023) · doi:10.7930/nca5.2023.ch5 · Cited by 6
Guo, J., Peng, J., Luo, Y., Wu, H., Yan, J., & Yang, H. (2025) · Renewable Energy · doi:10.1016/j.renene.2025.123919 · Cited by 3
Can photovoltaic buildings be energy self-sufficient? A case study of Xiamen
Chen, Y., Liu, Y., Nie, Y., Ye, H., & Chen, W. (2025) · Energy and Buildings · doi:10.1016/j.enbuild.2025.116231 · Cited by 3
Metadata
- Authors
- Yin, J., Molini, A., & Porporato, A.
- Affiliations
- Nanjing University of Information Science and Technology (CN)
- Khalifa University of Science and Technology (AE)
- Princeton University (US)
- Corresponding author
- Porporato, Amilcare
- Venue
- Nature Communications
- Published
- 2020-09-22
- Volume
- 11
- Issue
- 1
- Pages
- 4781-4781
- ISSN
- 2041-1723 (ISSN-L)
- PMC
- PMC7508863
- OpenAlex
- W3003290234
- Cited by
- 179
- References
- 53
- Citations by year
- 2026: 51 · 2025: 40 · 2024: 36 · 2023: 22 · 2022: 19 · 2021: 9 · 2020: 2
- FWCI
- 5.11
- Type
- journal article
- Language
- en
- Open access
- gold
- doi.org
- Locations
- Nature Communications (publishedVersion, cc-by)
- PubMed Central (publishedVersion, cc-by)
- PubMed (publishedVersion)
- arXiv (Cornell University) (submittedVersion)
- RePEc: Research Papers in Economics (submittedVersion)
- DOAJ (DOAJ: Directory of Open Access Journals) (submittedVersion, cc-by-sa)
- arXiv (Cornell University)
- Funders
- National Natural Science Foundation of China (41877158, 51739009)
- National Science Foundation (EAR-1316258, FESD EAR-1338694)
- United States Department of Agriculture | Agricultural Research Service (58-6408-3-027)
- Topics
- Physical Sciences › Energy › Renewable Energy, Sustainability and the Environment › Solar Radiation and Photovoltaics
- Physical Sciences › Energy › Renewable Energy, Sustainability and the Environment › Photovoltaic Systems and Sustainability
- Physical Sciences › Energy › Renewable Energy, Sustainability and the Environment › Solar Thermal and Photovoltaic Systems
- Keywords
- solar intermittency, photovoltaic module reliability, solar radiation variability, climate change impacts, solar power supply, climate model projections, arid regions, spatial heterogeneity, renewable energy reliability
About these checks
Registry, retraction, Cites and statistics results are computed, not judged, with one exception: a printed reference that no index lists is read once by a model before it counts as a citation error. Claims are extracted by a model and kept only when their quote appears verbatim in the text; each cited source is then checked, with a model’s help, for whether it says what the claim relies on. Those verdicts can be wrong — read the claim’s quote and the cited source before relying on one.
Statistics and arithmetic are recomputed, not judged.
Confidence bands are shown only for fields calibrated on our annotated test set. None is calibrated yet, so no band is shown.
What counts as a claim ›How we measure confidence ›How we check this ›
Are you an author, or do you see a problem with this page? Request a review
