

The DOI matches its Crossref record; 96 of the 96 references it cites were found in a registry or an index.
Single-cell RNA landscape of intratumoral heterogeneity and immunosuppressive microenvironment in advanced osteosarcoma
Open accessAbstract
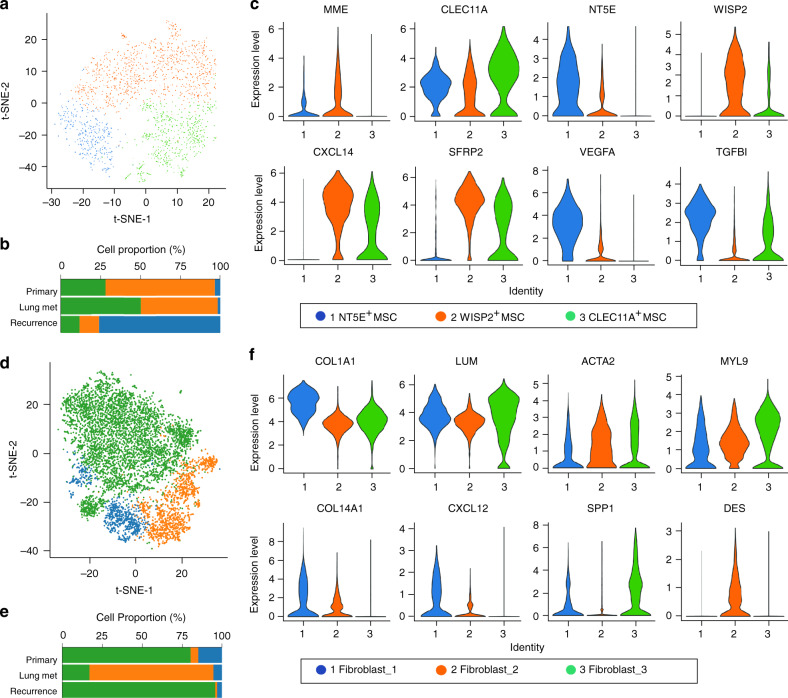
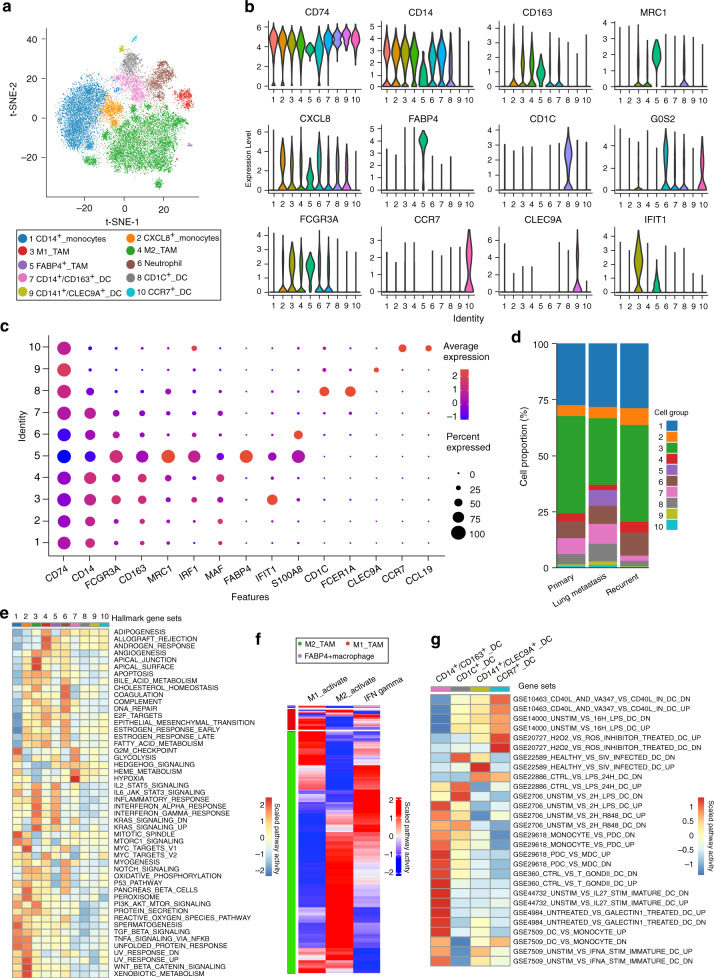
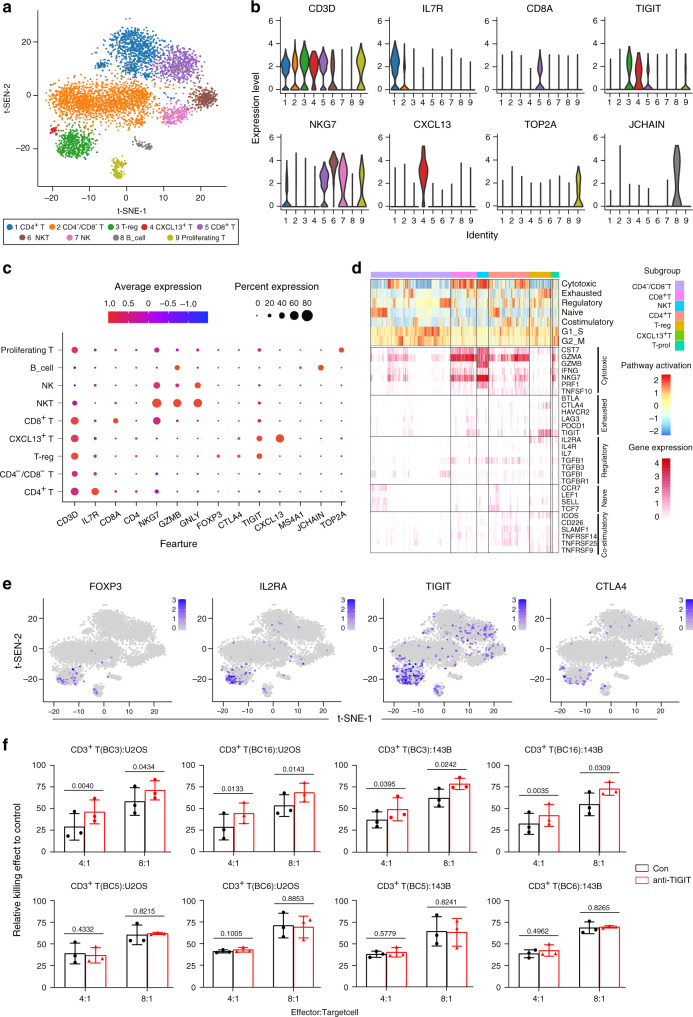
Osteosarcoma is the most frequent primary bone tumor with poor prognosis. Through RNA-sequencing of 100,987 individual cells from 7 primary, 2 recurrent, and 2 lung metastatic osteosarcoma lesions, 11 major cell clusters are identified based on unbiased clustering of gene expression profiles and canonical markers. The transcriptomic properties, regulators and dynamics of osteosarcoma malignant cells together with their tumor microenvironment particularly stromal and immune cells are characterized. The transdifferentiation of malignant osteoblastic cells from malignant chondroblastic cells is revealed by analyses of inferred copy-number variation and trajectory. A proinflammatory FABP4 + macrophages infiltration is noticed in lung metastatic osteosarcoma lesions. Lower osteoclasts infiltration is observed in chondroblastic, recurrent and lung metastatic osteosarcoma lesions compared to primary osteoblastic osteosarcoma lesions. Importantly, TIGIT blockade enhances the cytotoxicity effects of the primary CD3 + T cells with high proportion of TIGIT + cells against osteosarcoma. These results present a single-cell atlas, explore intratumor heterogeneity, and provide potential therapeutic targets for osteosarcoma.
Overview
The claims and statistics of this paper haven’t been checked yet.
Run the check — free, no account needed. It reads the open-access text and checks the sources it cites.
Integrity signals
Registry
Cites
Statistics
Figures
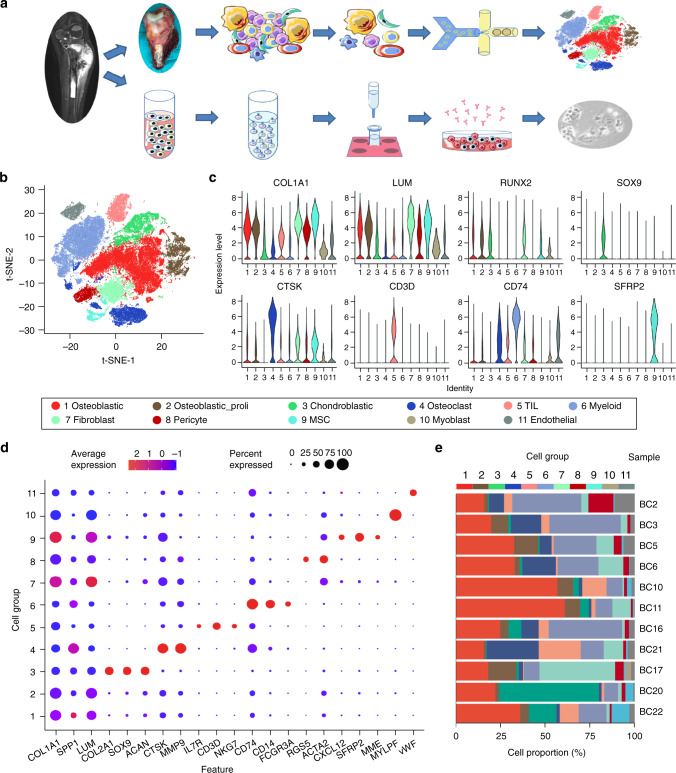
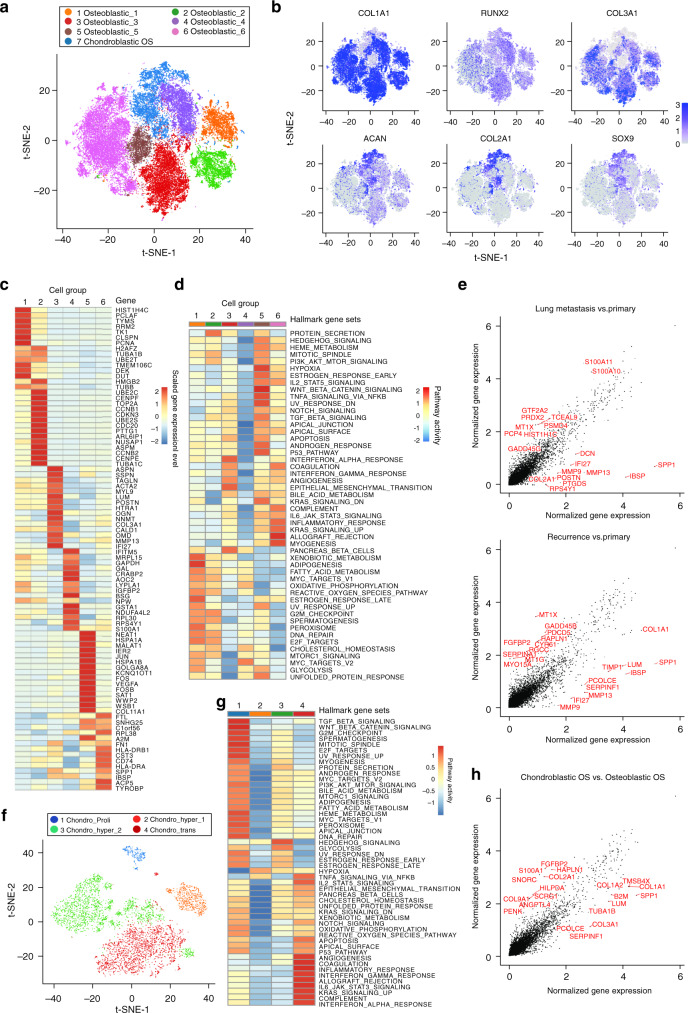
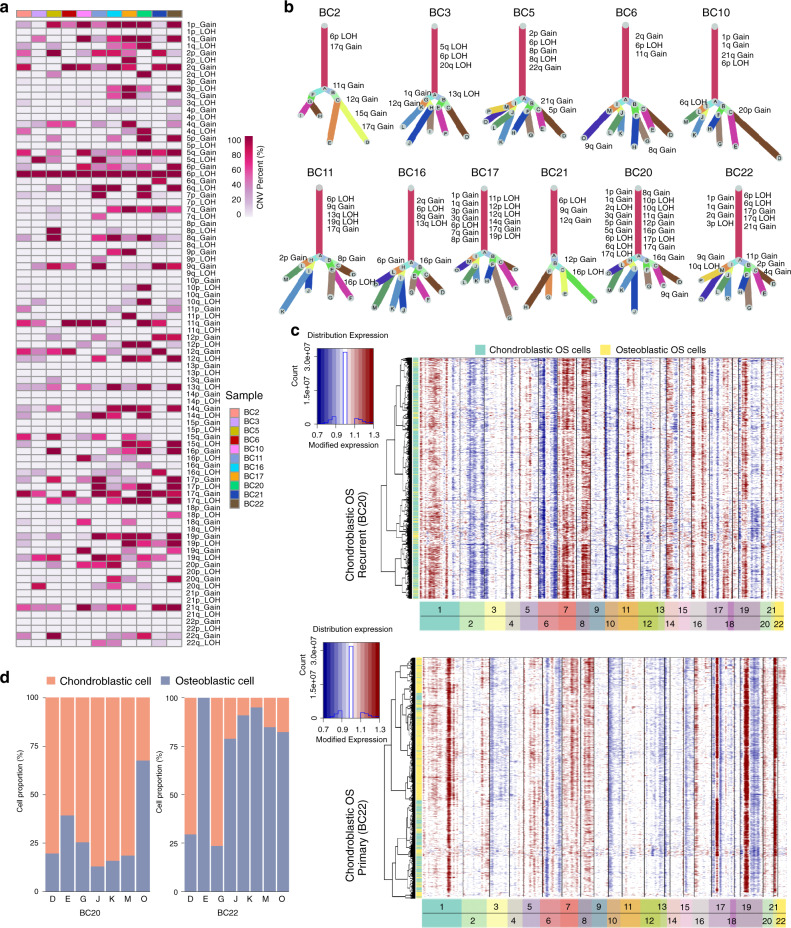
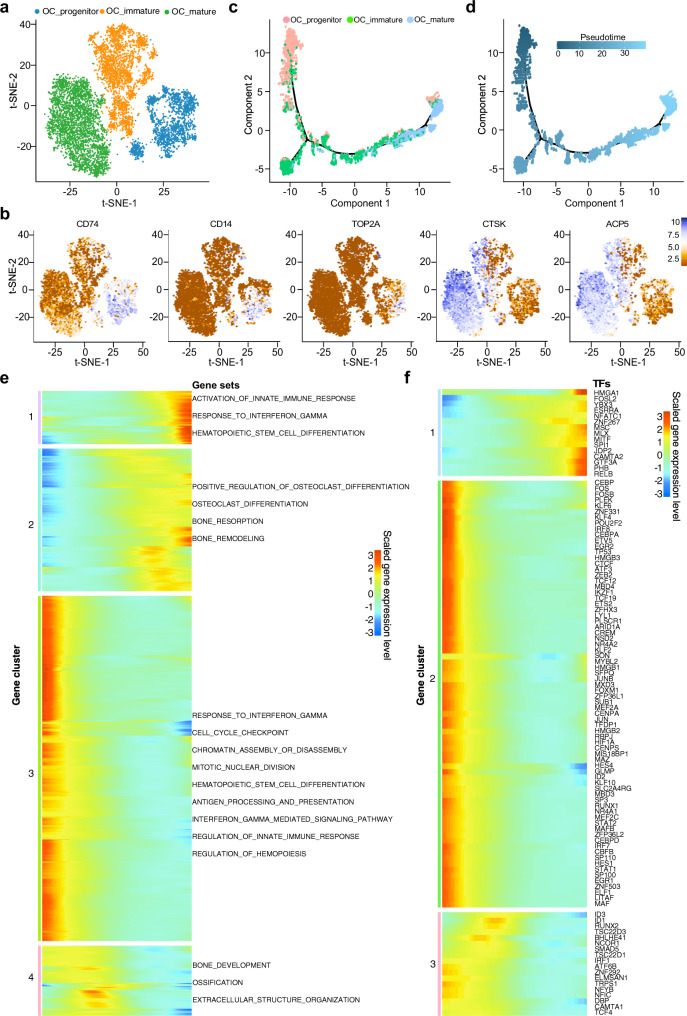
Verification
Claims the paper makes
The claims and statistics of this paper haven’t been checked yet.
Run the check — free, no account needed. It reads the open-access text and checks the sources it cites.
Claims other papers make about this one
Each is checked against this paper’s own text: does it say what the citing paper says it does?
The source backs part of the claim, not all of it — or backs it for a different population, condition or comparison.
In the citing paper
“Blocking TIGIT signaling can significantly enhance the cytotoxicity effects of CD3+ T cells with high expression of TIGIT against osteosarcoma cells, indicating potential therapeutic value of targeted TIGIT therapy for osteosarcoma [4].”
From Advances on immunotherapy for osteosarcoma (2024) · cites this paper as [4]
Experimental — accuracy not yet measuredThe cited source says what the claim attributes to it.
In the citing paper
“And the immunoreceptor inhibitory checkpoint marker TIGIT was highly expressed by the CD8+ T, CD4+ T, Treg and NKT cells in osteosarcoma lesions.”
From Advances on immunotherapy for osteosarcoma (2024) · cites this paper as [4]
The cited source says what the claim attributes to it.
In the citing paper
“indicating potential therapeutic value of targeted TIGIT therapy for osteosarcoma [4]”
From Advances on immunotherapy for osteosarcoma (2024) · cites this paper as [4]
In the citing paper
“This seed and soil phenomenon is driven by a microenvironment that modulates osteosarcoma cell behaviour and facilitates proliferation, quiescence, invasion, migration, and drug resistance 15,51,52,53 and contributes to their intrinsic heterogeneity 54,55 .”
From Osteosarcoma (2022) · cites this paper as [54]
Self-check
Percentages, sums and reported differences re-computed from the paper’s own numbers.
The self-check needs the paper’s full text.
Citations
Cites
clusterProfiler: an R Package for Comparing Biological Themes Among Gene Clusters
Yu, G., Wang, L.-G., Han, Y., & He, Q.-Y. (2012) · OMICS: A Journal of Integrative Biology · doi:10.1089/omi.2011.0118 · Cited by 36,259
Integrating single-cell transcriptomic data across different conditions, technologies, and species
Butler, A., Hoffman, P., Smibert, P., Papalexi, E., & Satija, R. (2018) · Nature Biotechnology · doi:10.1038/nbt.4096 · Cited by 13,174
Fast, sensitive and accurate integration of single-cell data with Harmony
Korsunsky, I., Millard, N., Fan, J., Slowikowski, K., Zhang, F., Wei, K., Baglaenko, Y., Brenner, M., Loh, P.-R., & Raychaudhuri, S. (2019) · Nature Methods · doi:10.1038/s41592-019-0619-0 · Cited by 10,488
Trapnell, C., Cacchiarelli, D., Grimsby, J., Pokharel, P., Li, S., Morse, M., Lennon, N. J., Livak, K. J., Mikkelsen, T. S., & Rinn, J. L. (2014) · Nature Biotechnology · doi:10.1038/nbt.2859 · Cited by 7,314
Molecular signatures database (MSigDB) 3.0
Liberzon, A., Subramanian, A., Pinchback, R., Thorvaldsdóttir, H., Tamayo, P., & Mesirov, J. P. (2011) · Bioinformatics · doi:10.1093/bioinformatics/btr260 · Cited by 7,111
Elements of cancer immunity and the cancer–immune set point
Chen, D. S., & Mellman, I. (2017) · Nature · doi:10.1038/nature21349 · Cited by 5,352
Single-cell RNA-seq highlights intratumoral heterogeneity in primary glioblastoma
Patel, A. P., Tirosh, I., Trombetta, J. J., Shalek, A. K., Gillespie, S. M., Wakimoto, H., Cahill, D. P., Nahed, B. V., Curry, W. T., Martuza, R. L., et al. (2014) · Science · doi:10.1126/science.1254257 · Cited by 5,063
Aran, D., Looney, A. P., Liu, L., Wu, E., Fong, V., Hsu, A., Chak, S., Naikawadi, R. P., Wolters, P. J., Abate, A. R., et al. (2019) · Nature Immunology · doi:10.1038/s41590-018-0276-y · Cited by 4,984
Dissecting the multicellular ecosystem of metastatic melanoma by single-cell RNA-seq
Tirosh, I., Izar, B., Prakadan, S. M., Wadsworth, M. H., Treacy, D., Trombetta, J. J., Rotem, A., Rodman, C., Lian, C., Murphy, G., et al. (2016) · Science · doi:10.1126/science.aad0501 · Cited by 4,944
Molecular and cellular insights into T cell exhaustion
Wherry, E. J., & Kurachi, M. (2015) · Nature Reviews Immunology · doi:10.1038/nri3862 · Cited by 4,652
McGinnis, C. S., Murrow, L. M., & Gartner, Z. J. (2019) · Cell Systems · doi:10.1016/j.cels.2019.03.003 · Cited by 4,521
Puram, S. V., Tirosh, I., Parikh, A. S., Patel, A. P., Yizhak, K., Gillespie, S., Rodman, C., Luo, C. L., Mroz, E. A., Emerick, K. S., et al. (2017) · Cell · doi:10.1016/j.cell.2017.10.044 · Cited by 2,557
A comparison of single-cell trajectory inference methods
Saelens, W., Cannoodt, R., Todorov, H., & Saeys, Y. (2019) · Nature Biotechnology · doi:10.1038/s41587-019-0071-9 · Cited by 1,670
Minireview: The OPG/RANKL/RANK System
Khosla, S. (2001) · Endocrinology · doi:10.1210/endo.142.12.8536 · Cited by 1,515
Tawbi, H. A., Burgess, M., Bolejack, V., Van Tine, B. A., Schuetze, S. M., Hu, J., D'Angelo, S., Attia, S., Riedel, R. F., Priebat, D. A., et al. (2017) · The Lancet Oncology · doi:10.1016/s1470-2045(17)30624-1 · Cited by 1,452
Single-cell RNA-seq supports a developmental hierarchy in human oligodendroglioma
Tirosh, I., Venteicher, A. S., Hebert, C. M., Escalante, L. E., Patel, A. P., Yizhak, K., Fisher, J. M., Rodman, C., Mount, C., Filbin, M. G., et al. (2016) · Nature · doi:10.1038/nature20123 · Cited by 1,245
Link, M. P., Goorin, A. M., Miser, A. W., Green, A. A., Pratt, C. B., Belasco, J. B., Pritchard, J., Malpas, J. S., Baker, A. R., Kirkpatrick, J. A., et al. (1986) · New England Journal of Medicine · doi:10.1056/nejm198606193142502 · Cited by 1,203
Zhang, Q., Bi, J., Zheng, X., Chen, Y., Wang, H., Wu, W., Wang, Z., Wu, Q., Peng, H. C., Wei, H., et al. (2018) · Nature Immunology · doi:10.1038/s41590-018-0132-0 · Cited by 1,155
Human T Regulatory Cells Can Use the Perforin Pathway to Cause Autologous Target Cell Death
Grossman, W. J., Verbsky, J. W., Barchet, W., Colonna, M., Atkinson, J. P., & Ley, T. J. (2004) · Immunity · doi:10.1016/j.immuni.2004.09.002 · Cited by 1,021
Single-cell RNA-seq enables comprehensive tumour and immune cell profiling in primary breast cancer
Chung, W., Eum, H. H., Lee, H.-O., Lee, K.-M., Lee, H.-B., Kim, K.-T., Ryu, H. S., Kim, S., Lee, J. E., Park, Y. H., et al. (2017) · Nature Communications · doi:10.1038/ncomms15081 · Cited by 992
Sinha, P., Clements, V. K., Bunt, S. K., Albelda, S. M., & Ostrand-Rosenberg, S. (2007) · The Journal of Immunology · doi:10.4049/jimmunol.179.2.977 · Cited by 847
Smeland, S., Bielack, S. S., Whelan, J., Bernstein, M., Hogendoorn, P., Krailo, M. D., Gorlick, R., Janeway, K. A., Ingleby, F. C., Anninga, J., et al. (2019) · European Journal of Cancer · doi:10.1016/j.ejca.2018.11.027 · Cited by 704
Immune Landscape of Viral- and Carcinogen-Driven Head and Neck Cancer
Cillo, A. R., Kürten, C. H. L., Tabib, T., Qi, Z., Onkar, S., Wang, T., Liu, A., Duvvuri, U., Kim, S., Soose, R. J., et al. (2020) · Immunity · doi:10.1016/j.immuni.2019.11.014 · Cited by 677
Benchmarking single-cell RNA-sequencing protocols for cell atlas projects
Mereu, E., Lafzi, A., Moutinho, C., Ziegenhain, C., McCarthy, D. J., Álvarez-Varela, A., Batlle, E., Sagar, Grün, D., Lau, J. K., et al. (2020) · Nature Biotechnology · doi:10.1038/s41587-020-0469-4 · Cited by 499
The Osteosarcoma Microenvironment: A Complex but Targetable Ecosystem
Corre, I., Verrecchia, F., Crenn, V., Rédiní, F., & Trichet, V. (2020) · Cells · doi:10.3390/cells9040976 · Cited by 494
Duggan, M. A., Anderson, W. F., Altekruse, S., Penberthy, L., & Sherman, M. E. (2016) · American Journal of Surgical Pathology · doi:10.1097/pas.0000000000000749 · Cited by 472
Single-cell analysis reveals new evolutionary complexity in uveal melanoma
Durante, M. A., Rodriguez, D. A., Kurtenbach, S., Kuznetsoff, J. N., Sanchez, M. I., Decatur, C. L., Snyder, H., Feun, L. G., Livingstone, A. S., & Harbour, J. W. (2020) · Nature Communications · doi:10.1038/s41467-019-14256-1 · Cited by 461
Genome-Informed Targeted Therapy for Osteosarcoma
Sayles, L. C., Breese, M. R., Koehne, A. L., Leung, S. G., Lee, A. G., Liu, H.-Y., Spillinger, A., Shah, A. T., Tanasa, B., Straessler, K., et al. (2019) · Cancer Discovery · doi:10.1158/2159-8290.cd-17-1152 · Cited by 452
Pelon, F., Bourachot, B., Kieffer, Y., Magagna, I., Mermet‐Meillon, F., Bonnet, I., Costa, A., Givel, A.-M., Atieh, Y., Barbazán, J., et al. (2020) · Nature Communications · doi:10.1038/s41467-019-14134-w · Cited by 404
Davis, K. L., Fox, E., Merchant, M. S., Reid, J. M., Kudgus, R. A., Liu, X., Minard, C. G., Voss, S., Berg, S. L., Weigel, B. J., et al. (2020) · The Lancet Oncology · doi:10.1016/s1470-2045(20)30023-1 · Cited by 337
Updating osteoimmunology: regulation of bone cells by innate and adaptive immunity
Walsh, M. C., Takegahara, N., Kim, H., & Choi, Y. (2018) · Nature Reviews Rheumatology · doi:10.1038/nrrheum.2017.213 · Cited by 256
Immuno-genomic landscape of osteosarcoma
Wu, C.-C., Beird, H. C., Andrew Livingston, J., Advani, S., Mitra, A., Cao, S., Reuben, A., Ingram, D., Wang, W.-L., Ju, Z., et al. (2020) · Nature Communications · doi:10.1038/s41467-020-14646-w · Cited by 251
Li, H., Hong, S., Qian, J., Zheng, Y., Yang, J., & Yi, Q. (2010) · Blood · doi:10.1182/blood-2009-11-255026 · Cited by 248
Cells of origin in osteosarcoma: Mesenchymal stem cells or osteoblast committed cells?
Mutsaers, A. J., & Walkley, C. R. (2014) · Bone · doi:10.1016/j.bone.2014.02.003 · Cited by 233
Lee, H. W., Chung, W., Lee, H., Jeong, D. E., Jo, A., Lim, J. E., Hong, J. H., Nam, D., Jeong, B. C., Park, S. H., et al. (2020) · Genome Medicine · doi:10.1186/s13073-020-00741-6 · Cited by 192
Proton‐based radiotherapy for unresectable or incompletely resected osteosarcoma
Ciernik, I. F., Niemierko, A., Harmon, D. C., Kobayashi, W., Chen, Y., Yock, T. I., Ebb, D. H., Choy, E., Raskin, K. A., Liebsch, N., et al. (2011) · Cancer · doi:10.1002/cncr.26037 · Cited by 191
Sawant, A., Deshane, J. S., Jules, J., Lee, C. M., Harris, B. A., Feng, X., & Ponnazhagan, S. (2012) · Cancer Research · doi:10.1158/0008-5472.can-12-2202 · Cited by 183
Le Cesne, A., Marec-Berard, P., Blay, J.-Y., Gaspar, N., Bertucci, F., Penel, N., Bompas, E., Cousin, S., Toulmonde, M., Bessede, A., et al. (2019) · European Journal of Cancer · doi:10.1016/j.ejca.2019.07.018 · Cited by 174
Advances in immune checkpoint inhibitors for bone sarcoma therapy
Thanindratarn, P., Dean, D. C., Nelson, S. D., Hornicek, F. J., & Duan, Z. (2019) · Journal of bone oncology · doi:10.1016/j.jbo.2019.100221 · Cited by 173
Mesenchymal stroma: Role in osteosarcoma progression
Cortini, M., Avnet, S., & Baldini, N. (2017) · Cancer Letters · doi:10.1016/j.canlet.2017.07.024 · Cited by 171
Chiu, D. K., Yuen, V. W., Cheu, J. W., Wei, L. L., Ting, V., Fehlings, M., Sumatoh, H., Nardin, A., Newell, E. W., Ng, I. O., et al. (2020) · Gastroenterology · doi:10.1053/j.gastro.2020.03.074 · Cited by 171
Shen, W.-C., Lai, Y., Li, L., Liao, K., Lai, H.-C., Kao, S., Wang, J., Chuong, C., & Hung, S. (2019) · Nature Communications · doi:10.1038/s41467-019-10197-x · Cited by 163
SCORPIUS improves trajectory inference and identifies novel modules in dendritic cell developmentPreprint
Cannoodt, R., Saelens, W., Sichien, D., Tavernier, S. J., Janssens, S., Guilliams, M., Lambrecht, B. N., Preter, K. D., & Saeys, Y. (2016) · bioRxiv (Cold Spring Harbor Laboratory) · doi:10.1101/079509 · Cited by 160
The TNF–TNFR Family of Co-signal Molecules
So, T., & Ishii, N. (2019) · Advances in experimental medicine and biology · doi:10.1007/978-981-32-9717-3_3 · Cited by 156
Fra-2/AP-1 controls bone formation by regulating osteoblast differentiation and collagen production
Bözec, A., Bakiri, L., Jiménez, M., Schinke, T., Amling, M., & Wagner, E. F. (2010) · The Journal of Cell Biology · doi:10.1083/jcb.201002111 · Cited by 149
Wang, D., Niu, X., Wang, Z., Song, C., Huang, Z., Chen, K., Duan, J., Bai, H., Xu, J., Zhao, J., et al. (2018) · Cancer Research · doi:10.1158/0008-5472.can-18-1086 · Cited by 149
Self-citationThe role of chemokines in intestinal inflammation and cancer
Wang, D., DuBois, R. N., & Richmond, A. J. (2009) · Current Opinion in Pharmacology · doi:10.1016/j.coph.2009.08.003 · Cited by 145
Whole-exome sequencing in osteosarcoma reveals important heterogeneity of genetic alterations
Bousquet, M., Noirot, C., Accadbled, F., de Gauzy, J. S., Castex, M., Brousset, P., & Gomez‐Brouchet, A. (2016) · Annals of Oncology · doi:10.1093/annonc/mdw009 · Cited by 143
Harari, A., Enders, F. B., Cellerai, C., Bart, P., & Pantaleo, G. (2009) · Journal of Virology · doi:10.1128/jvi.02528-08 · Cited by 141
Akiyama, T., Dass, C. R., & Choong, P. (2008) · Molecular Cancer Therapeutics · doi:10.1158/1535-7163.mct-08-0530 · Cited by 137
Zhang, J., Späth, S. S., Marjani, S. L., Zhang, W., & Pan, X. (2018) · Precision Clinical Medicine · doi:10.1093/pcmedi/pby007 · Cited by 137
Self-citationSuehara, Y., Alex, D., Bowman, A., Middha, S., Zehir, A., Chakravarty, D., Wang, L., Jour, G., Nafa, K., Hayashi, T., et al. (2019) · Clinical Cancer Research · doi:10.1158/1078-0432.ccr-18-4032 · Cited by 135
Gene amplifications in osteosarcoma—CGH microarray analysis
Atiye, J., Wolf, M., Kaur, S., Monni, O. M., Böhling, T., Kivioja, A., Tas, É., Serra, M., Tarkkanen, M., & Knuutila, S. (2004) · Genes Chromosomes and Cancer · doi:10.1002/gcc.20120 · Cited by 130
Zheng, Y., Wang, G., Chen, R., Hua, Y., & Cai, Z. (2018) · Stem Cell Research & Therapy · doi:10.1186/s13287-018-0780-x · Cited by 127
IRX1 hypomethylation promotes osteosarcoma metastasis via induction of CXCL14/NF-κB signaling
Lu, J., Song, G., Tang, Q., Zou, C., Han, F., Zhao, Z., Yong, B., Yin, J., Xu, H., Xie, X., et al. (2015) · Journal of Clinical Investigation · doi:10.1172/jci78437 · Cited by 125
Self-citationWHO Classification of Soft Tissue and Bone, fourth edition
Rosenberg, A. E. (2013) · Current Opinion in Oncology · doi:10.1097/01.cco.0000432522.16734.2d · Cited by 119
Molecular determinants for the polarization of macrophage and osteoclast
Yang, D., & Wan, Y. (2019) · Seminars in Immunopathology · doi:10.1007/s00281-019-00754-3 · Cited by 104
Self-citationSawant, A., & Ponnazhagan, S. (2013) · Cancer Research · doi:10.1158/0008-5472.can-13-0305 · Cited by 92
Emerging next-generation sequencing-based discoveries for targeted osteosarcoma therapy
Zhao, J., Dean, D. C., Hornicek, F. J., Yu, X., & Duan, Z. (2020) · Cancer Letters · doi:10.1016/j.canlet.2020.01.020 · Cited by 92
Prognostic value of inflammation-based scores in patients with osteosarcoma
Liu, B., Huang, Y., Sun, Y., Zhang, J., Yao, Y., Shen, Z., Xiang, D., & He, A. (2016) · Scientific Reports · doi:10.1038/srep39862 · Cited by 89
Self-citationTargeting the TIGIT-PVR immune checkpoint axis as novel therapeutic option in breast cancer
Stamm, H., Oliveira‐Ferrer, L., Grossjohann, E.-M., Muschhammer, J., Thaden, V., Brauneck, F., Kischel, R., Müller, V., Bokemeyer, C., Fiedler, W., et al. (2019) · OncoImmunology · doi:10.1080/2162402x.2019.1674605 · Cited by 88
Cell Cycle Regulator Gene CDC5L , a Potential Target for 6p12-p21 Amplicon in Osteosarcoma
Lu, X., Lu, Y., Zhao, Y., Jaeweon, K., Kang, J., Li, X., Ge, G., Meyer, R., Perlaky, L., Hicks, J. M., et al. (2008) · Molecular Cancer Research · doi:10.1158/1541-7786.mcr-07-2115 · Cited by 86
Yin, Q., Tang, L., Cai, K., Tong, R., Sternberg, R., Yang, X., Dobrucki, L. W., Borst, L. B., Kamstock, D. A., Song, Z., et al. (2016) · Proceedings of the National Academy of Sciences · doi:10.1073/pnas.1603316113 · Cited by 82
Self-citationOhmura, H., Yamaguchi, T., Hanamura, F., Ito, M., Makiyama, A., Uchino, K., Shimokawa, H., Tamura, S., Esaki, T., Mitsugi, K., et al. (2020) · British Journal of Cancer · doi:10.1038/s41416-020-0810-1 · Cited by 80
Reimann, E., Kõks, S., Ho, X. D., Maasalu, K., & Märtson, A. (2014) · Human Genomics · doi:10.1186/s40246-014-0020-0 · Cited by 79
A TIGIT-based chimeric co-stimulatory switch receptor improves T-cell anti-tumor function
Hoogi, S., Eisenberg, V., Mayer, S., Shamul, A., Barliya, T., & Cohen, C. J. (2019) · Journal for ImmunoTherapy of Cancer · doi:10.1186/s40425-019-0721-y · Cited by 79
Grünberg, J. R., Hammarstedt, A., Hedjazifar, S., & Smith, U. (2014) · Journal of Biological Chemistry · doi:10.1074/jbc.m113.511964 · Cited by 78
Lv, Z., Wei, J., You, W., Wang, R., Shang, J., Xiong, Y., Yang, H., Yang, X., & Fu, Z. (2017) · Journal of Translational Medicine · doi:10.1186/s12967-017-1357-7 · Cited by 74
Incidence and Mortality of Sarcomas in Shanghai, China, During 2002–2014
Pingping, B., Yuhong, Z., Lu, W., Wu, C., Chunfang, W., Yuanjue, S., Chenping, Z., Xiao, J., Lu, J. J., Lin, K., et al. (2019) · Frontiers in Oncology · doi:10.3389/fonc.2019.00662 · Cited by 64
Targeting mutant TP53 as a potential therapeutic strategy for the treatment of osteosarcoma
Tang, F., Min, L., Seebacher, N. A., Li, X., Zhou, Y., Hornicek, F. J., Wei, Y., Tu, C., & Duan, Z. (2019) · Journal of Orthopaedic Research® · doi:10.1002/jor.24227 · Cited by 63
Self-citationSuch, L., Zhao, F., Liu, D. H., Thier, B., Le‐Trilling, V. T. K., Sucker, A., Coch, C., Pieper, N., Howe, S., Bhat, H., et al. (2020) · Journal of Clinical Investigation · doi:10.1172/jci131572 · Cited by 61
Evaluation of a Flow Cytometry‐Based Assay for Natural Killer Cell Activity in Clinical Settings
Valiathan, R., Lewis, J. E., Melillo, A. B., Leonard, S. M., Ali, K. H., & Asthana, D. (2011) · Scandinavian Journal of Immunology · doi:10.1111/j.1365-3083.2011.02667.x · Cited by 58
Rodríguez‐Fernández, J. L., & Criado‐García, O. (2020) · Frontiers in Immunology · doi:10.3389/fimmu.2020.00528 · Cited by 58
Aghajanian, P., Xing, W., Cheng, S., & Mohan, S. (2017) · Scientific Reports · doi:10.1038/s41598-017-11050-1 · Cited by 47
Lozano, E., Mena, M.-P., Díaz, T., Martín-Antonio, B., León, S., Rodríguez‐Lobato, L. G., Oliver‐Caldés, A., Cibeira, M. T., Bladé, J., Prat, A., et al. (2020) · Clinical Cancer Research · doi:10.1158/1078-0432.ccr-19-3673 · Cited by 47
Genomic and transcriptomic characterisation of undifferentiated pleomorphic sarcoma of bone
Ali, N. M., Niada, S., Brini, A. T., Morris, M. R., Kurusamy, S., Alholle, A., Huen, D. S., Antonescu, C. R., Tirode, F., Sumathi, V. P., et al. (2018) · The Journal of Pathology · doi:10.1002/path.5176 · Cited by 46
A novel mechanism of mTORC1-mediated serine/glycine metabolism in osteosarcoma development
Wang, D., Wu, L., Cao, Y., Yang, L., Liu, W., Xiaoqiang, E., Ji, G., & Bi, Z. (2016) · Cellular Signalling · doi:10.1016/j.cellsig.2016.06.008 · Cited by 43
Meng, M., Sang, L., & Wang, X. (2019) · OncoTargets and Therapy · doi:10.2147/ott.s225248 · Cited by 42
Wong, S. A., Rivera, K. O., Miclau, T., Alsberg, E., Marcucio, R., & Bahney, C. S. (2018) · Frontiers in Bioengineering and Biotechnology · doi:10.3389/fbioe.2018.00058 · Cited by 40
Molecular structure, expression, and functional role of Clec11a in skeletal biology and cancers
Wang, M., Guo, J., Zhang, L., Kuek, V., Xu, J., & Zou, J. (2020) · Journal of Cellular Physiology · doi:10.1002/jcp.29600 · Cited by 35
Treatment outcome of patients with chondroblastic osteosarcoma of the limbs and pelvis
Tsagozis, P., Laitinen, M., Stevenson, J. D., Jeys, L. M., Abudu, A., & Parry, M. (2019) · The Bone & Joint Journal · doi:10.1302/0301-620x.101b6.bjj-2018-1090.r1 · Cited by 34
NK and NKT Cell-Mediated Immune Surveillance against Hematological Malignancies
Shimizu, K., Iyoda, T., Yamasaki, S., Kadowaki, N., Tojo, A., & Fujii, S. (2020) · Cancers · doi:10.3390/cancers12040817 · Cited by 34
Fejzo, M. S., Anderson, L. A., Chen, H., Guandique, E., Kalous, O., Conklin, D. F., & Slamon, D. J. (2017) · Genes Chromosomes and Cancer · doi:10.1002/gcc.22459 · Cited by 33
Vascularization of primary and secondary ossification centres in the human growth plate
Walzer, S. M., Cetin, E., Gruebl‐Barabas, R., Sulzbacher, I., Rüger, B. M., Girsch, W., Toegel, S., Windhager, R. H., & Fischer, M. B. (2014) · BMC Developmental Biology · doi:10.1186/s12861-014-0036-7 · Cited by 32
Wang, L., Yan, W., Li, X., Liu, Z., Tian, T., Chen, T., Zou, L., & Cui, Z. (2019) · Journal of Ovarian Research · doi:10.1186/s13048-019-0592-3 · Cited by 31
Lancia, C., Anninga, J., Sydes, M. R., Spitoni, C., Whelan, J. S., Hogendoorn, P. C. W., Gelderblom, H. A. J., & Fiocco, M. F. (2019) · Cancer Chemotherapy and Pharmacology · doi:10.1007/s00280-019-03797-3 · Cited by 27
TIGIT Blockade: A Multipronged Approach to Target the HIV Reservoir
Holder, K. A., & Grant, M. D. (2020) · Frontiers in Cellular and Infection Microbiology · doi:10.3389/fcimb.2020.00175 · Cited by 25
Benasciutti, E., Mariani, E., Oliva, L., Scolari, M. P., Perilli, E., Barras, E., Milan, E., Orfanelli, U., Fazzalari, N. L., Campana, L., et al. (2013) · Journal of Bone and Mineral Research · doi:10.1002/jbmr.2090 · Cited by 23
Medrado, A. R. A. P., Almeida, E., Mascarenhas, B., & Cerqueira, A. (2014) · Journal of Oral and Maxillofacial Pathology · doi:10.4103/0973-029x.151357 · Cited by 23
Models of dendritic cell development correlate ontogeny with function
Anderson, D. A., & MURPHY, K. M. M. (2019) · Advances in immunology · doi:10.1016/bs.ai.2019.09.001 · Cited by 22
Shi, T., Shen, X., & Gao, G. (2019) · BioMed Research International · doi:10.1155/2019/4291689 · Cited by 21
Stenger, E. O., Chinnadurai, R., Yuan, S., Garcia, M. A., Arafat, D., Gibson, G. C., Krishnamurti, L., & Galipeau, J. (2017) · Transplantation and Cellular Therapy · doi:10.1016/j.bbmt.2017.01.081 · Cited by 19
Kittaka, M., Mayahara, K., Mukai, T., Yoshimoto, T., Yoshitaka, T., Gorski, J. P., & Ueki, Y. (2017) · Journal of Bone and Mineral Research · doi:10.1002/jbmr.3295 · Cited by 18
Insights into Gene Regulatory Networks in Chondrocytes
Hojo, H., & Ohba, S. (2019) · International Journal of Molecular Sciences · doi:10.3390/ijms20246324 · Cited by 13
Analysis of Transcriptional Profiling of Immune Cells at the Single-Cell Level
Ferguson, A. A., & Chen, K. (2020) · Methods in molecular biology · doi:10.1007/978-1-0716-0266-9_4 · Cited by 8
Cancer makes new friends with old tricks
Dazzi, F. (2013) · Blood · doi:10.1182/blood-2013-06-509620 · Cited by 5
Cited by
Sorted by citations
Hu, C., Li, T., Xu, Y., Zhang, X., Li, F., Bai, J., Chen, J., Jiang, W., Yang, K., Ou, Q., et al. (2022) · Nucleic Acids Research · doi:10.1093/nar/gkac947 · Cited by 1,373
Advancing therapy for osteosarcoma
Gill, J., & Gorlick, R. (2021) · Nature Reviews Clinical Oncology · doi:10.1038/s41571-021-00519-8 · Cited by 876
Macrophage diversity in cancer revisited in the era of single-cell omics
Ma, R., Black, A., & Qian, B. (2022) · Trends in Immunology · doi:10.1016/j.it.2022.04.008 · Cited by 732
Self-citationBeird, H. C., Bielack, S. S., Flanagan, A. M., Gill, J., Heymann, D., Janeway, K. A., Livingston, J. A., Roberts, R. D., Strauss, S. J., & Gorlick, R. (2022) · Nature Reviews Disease Primers · doi:10.1038/s41572-022-00409-y · Cited by 660
Applications of single-cell sequencing in cancer research: progress and perspectives
Lei, Y., Tang, R., Xu, J., Wang, W., Zhang, B., Liu, J., Yu, X., & Shi, S. (2021) · Journal of Hematology & Oncology · doi:10.1186/s13045-021-01105-2 · Cited by 610
Metadata
- Authors
- Zhou, Y., Yang, D., Yang, Q., Lv, X., Huang, W., Zhou, Z., Wang, Y., Zhang, Z., Yuan, T., Ding, X., Tang, L., Zhang, J., Yin, J., Huang, Y., Yu, W., Wang, Y., Zhou, C., Su, Y., He, A., Sun, Y., Shen, Z., Qian, B., Meng, W., Fei, J., Yao, Y., Pan, X., Chen, P., & Hu, H.
- Affiliations
- Shanghai Jiao Tong University (CN)
- Third Affiliated Hospital of Nanchang University (CN)
- Second Military Medical University (CN)
- Southern Medical University (CN)
- Jinan University (CN)
- Key Laboratory of Guangdong Province (CN)
- Corresponding author
- Yao, Yang
- Pan, Xinghua
- Chen, Peizhan
- Hu, Haiyan
- ORCID
- Venue
- Nature Communications
- Published
- 2020-12-10
- Volume
- 11
- Issue
- 1
- Pages
- 6322-6322
- ISSN
- 2041-1723 (ISSN-L)
- PMC
- PMC7730477
- OpenAlex
- W3110998212
- Cited by
- 672
- References
- 96
- Citations by year
- 2026: 106 · 2025: 136 · 2024: 152 · 2023: 139 · 2022: 96 · 2021: 41 · 2020: 2
- FWCI
- 40.35
- Type
- journal article
- Language
- en
- Update notices
- correction (2021-04-30)
- Open access
- gold
- doi.org
- Locations
- Nature Communications (publishedVersion, cc-by)
- PubMed Central (publishedVersion, cc-by)
- PubMed (publishedVersion)
- RePEc: Research Papers in Economics (submittedVersion)
- DOAJ (DOAJ: Directory of Open Access Journals) (submittedVersion, cc-by-sa)
- Funders
- National Natural Science Foundation of China (81372873, 8187215, 81503396, 81770173)
- Please indicate the funder(s) of the research described in this manuscript, and the associated grant reference numbers
- Topics
- Health Sciences › Medicine › Oncology › Sarcoma Diagnosis and Treatment
- Life Sciences › Biochemistry, Genetics and Molecular Biology › Molecular Biology › Single-cell and spatial transcriptomics
- Health Sciences › Medicine › Orthopedics and Sports Medicine › Bone Tumor Diagnosis and Treatments
- Keywords
- osteosarcoma, intratumoral heterogeneity, tumor microenvironment, immunosuppression, single-cell transcriptomics, cell of origin, osteoblastic osteosarcoma, chondroblastic osteosarcoma, transdifferentiation, copy number variation, macrophage infiltration, FABP4, osteoclasts, lung metastasis, recurrent osteosarcoma, TIGIT, CD3+ T cells
- MeSH terms
- Cancer-Associated Fibroblasts, Adolescent, Adult, Cell Aggregation, Child, Clone Cells, Dendritic Cells, Female, Humans, Immunosuppression Therapy, Macrophages, Male, Neoplasm Staging, Osteoclasts, RNA, Neoplasm, Osteosarcoma, Lymphocytes, Tumor-Infiltrating, Stromal Cells, Genetic Heterogeneity, Myeloid Cells, Young Adult, DNA Copy Number Variations, Single-Cell Analysis, Tumor Microenvironment, Transcriptome, Mesenchymal Stem Cells
About these checks
Registry, retraction, Cites and statistics results are computed, not judged, with one exception: a printed reference that no index lists is read once by a model before it counts as a citation error. Claims are extracted by a model and kept only when their quote appears verbatim in the text; each cited source is then checked, with a model’s help, for whether it says what the claim relies on. Those verdicts can be wrong — read the claim’s quote and the cited source before relying on one.
Statistics and arithmetic are recomputed, not judged.
Confidence bands are shown only for fields calibrated on our annotated test set. None is calibrated yet, so no band is shown.
What counts as a claim ›How we measure confidence ›How we check this ›
Are you an author, or do you see a problem with this page? Request a review
