

The DOI matches its Crossref record; 47 of the 47 references it cites were found in a registry or an index.
A persistently low level of atmospheric oxygen in Earth’s middle age
Open accessAbstract
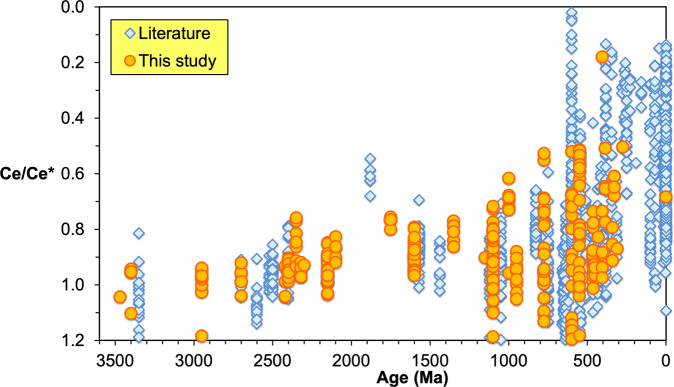
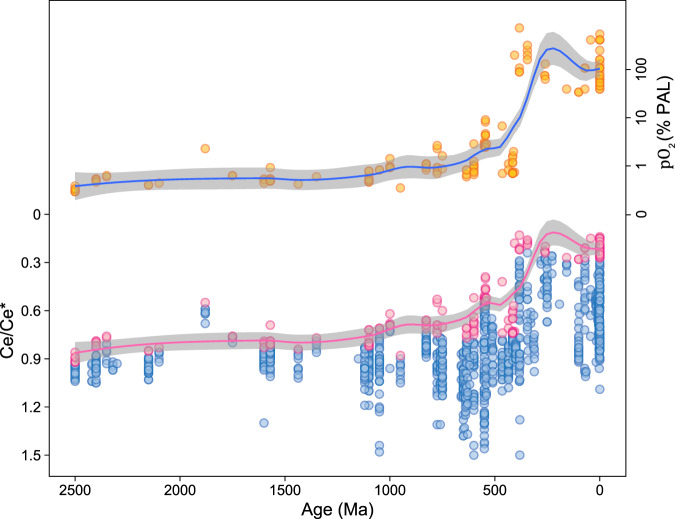
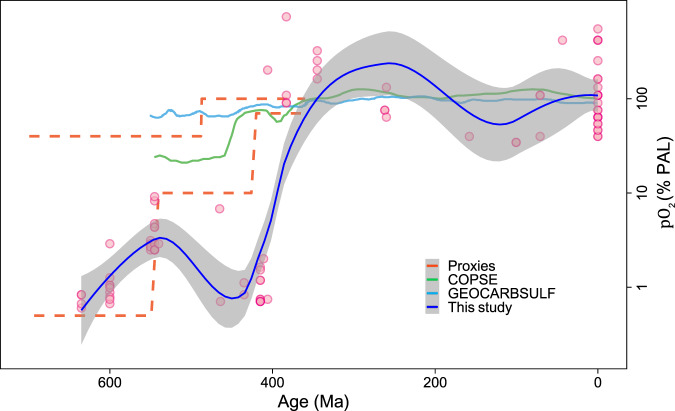
Resolving how Earth surface redox conditions evolved through the Proterozoic Eon is fundamental to understanding how biogeochemical cycles have changed through time. The redox sensitivity of cerium relative to other rare earth elements and its uptake in carbonate minerals make the Ce anomaly (Ce/Ce*) a particularly useful proxy for capturing redox conditions in the local marine environment. Here, we report Ce/Ce* data in marine carbonate rocks through 3.5 billion years of Earth’s history, focusing in particular on the mid-Proterozoic Eon (i.e., 1.8 – 0.8 Ga). To better understand the role of atmospheric oxygenation, we use Ce/Ce* data to estimate the partial pressure of atmospheric oxygen (pO 2 ) through this time. Our thermodynamics-based modeling supports a major rise in atmospheric oxygen level in the aftermath of the Great Oxidation Event (~ 2.4 Ga), followed by invariant pO 2 of about 1% of present atmospheric level through most of the Proterozoic Eon (2.4 to 0.65 Ga).
Overview
The claims and statistics of this paper haven’t been checked yet.
Run the check — free, no account needed. It reads the open-access text and checks the sources it cites.
Integrity signals
Registry
Cites
Statistics
Figures
Verification
Claims the paper makes
The claims and statistics of this paper haven’t been checked yet.
Run the check — free, no account needed. It reads the open-access text and checks the sources it cites.
Claims other papers make about this one
Each is checked against this paper’s own text: does it say what the citing paper says it does?
The source backs part of the claim, not all of it — or backs it for a different population, condition or comparison.
In the citing paper
“In addition, there are geochemical signals for anoxic conditions in very-shallow-water environments, including in the wave-mixed portions of the oceans (Bellefroid et al. 2019, Doyle et al. 2018, Liu et al. 2021, Tang et al. 2016).”
From The History of Ocean Oxygenation (2022) · cites this paper as Liu et al. 2021
Experimental — accuracy not yet measuredThe cited source says what the claim attributes to it.
In the citing paper
“Cerium (Ce) records from the mid-Proterozoic point similarly to low oxygen conditions even in shallow waters where carbonates were forming (Tang et al., 2016; Liu et al., 2021).”
From Oxygenation, Life, and the Planetary System during Earth's Middle History: An Overview (2021) · cites this paper as Liu et al., 2021
The cited source says what the claim attributes to it.
In the citing paper
“Although the precise range of atmospheric pO 2 values during the mid-Proterozoic is not yet clear (Gregory et al. 2021, Liu et al. 2021, Planavsky et al. 2018a), it is widely accepted that atmospheric O 2 was well below that of the modern Earth.”
From The History of Ocean Oxygenation (2022) · cites this paper as Liu et al. 2021
The cited source says what the claim attributes to it.
In the citing paper
“Although the precise range of atmospheric pO 2 values during the mid-Proterozoic is not yet clear (Gregory et al. 2021, Liu et al. 2021, Planavsky et al. 2018a)”
From The History of Ocean Oxygenation (2022) · cites this paper as Liu et al. 2021
Self-check
Percentages, sums and reported differences re-computed from the paper’s own numbers.
The self-check needs the paper’s full text.
Citations
Cites
The rise of oxygen in Earth's early ocean and atmosphere
Lyons, T. W., Reinhard, C. T., & Planavsky, N. J. (2014) · Nature · doi:10.1038/nature13068 · Cited by 2,810
The rare earth elements in seawater
Elderfield, H., & Greaves, M. J. (1982) · Nature · doi:10.1038/296214a0 · Cited by 1,448
THE EARLY HISTORY OF ATMOSPHERIC OXYGEN: Homage to Robert M. Garrels
Canfield, D. E. (2005) · Annual Review of Earth and Planetary Sciences · doi:10.1146/annurev.earth.33.092203.122711 · Cited by 1,032
Rare earth elements in Holocene reefal microbialites: a new shallow seawater proxy
Webb, G. E., & Kamber, B. S. (2000) · Geochimica et Cosmochimica Acta · doi:10.1016/s0016-7037(99)00400-7 · Cited by 855
Low Mid-Proterozoic atmospheric oxygen levels and the delayed rise of animals
Planavsky, N. J., Reinhard, C. T., Wang, X., Thomson, D., McGoldrick, P., Rainbird, R. H., Johnson, T., Fischer, W. W., & Lyons, T. W. (2014) · Science · doi:10.1126/science.1258410 · Cited by 763
Application of the Ce anomaly as a paleoredox indicator: The ground rules
German, C. R., & Elderfield, H. (1990) · Paleoceanography · doi:10.1029/pa005i005p00823 · Cited by 728
Rare Earth Element and Yttrium Variability in South East Queensland Waterways
Lawrence, M. G., Greig, A., Collerson, K. D., & Kamber, B. S. (2006) · Aquatic Geochemistry · doi:10.1007/s10498-005-4471-8 · Cited by 692
The oceanic chemistry of the rare-earth elements
Elderfield, H. (1988) · Philosophical Transactions of the Royal Society of London Series A Mathematical and Physical Sciences · doi:10.1098/rsta.1988.0046 · Cited by 680
Effective use of cerium anomalies as a redox proxy in carbonate-dominated marine settings
Tostevin, R., Shields, G., Tarbuck, G. M., He, T., Clarkson, M. O., & Wood, R. A. (2016) · Chemical Geology · doi:10.1016/j.chemgeo.2016.06.027 · Cited by 655
Evolution of the global phosphorus cycle
Reinhard, C. T., Planavsky, N. J., Gill, B. C., Ozaki, K., Robbins, L. J., Lyons, T. W., Fischer, W. W., Wang, C., Cole, D. B., & Konhauser, K. O. (2017) · Nature · doi:10.1038/nature20772 · Cited by 649
Self-citationBau, M., Koschinsky, A., Dulski, P., & Hein, J. R. (1996) · Geochimica et Cosmochimica Acta · doi:10.1016/0016-7037(96)00063-4 · Cited by 643
Statistical analysis of iron geochemical data suggests limited late Proterozoic oxygenation
Sperling, E. A., Wolock, C. J., Morgan, A. S., Gill, B. C., Kunzmann, M., Halverson, G. P., Macdonald, F. A., Knoll, A. H., & Johnston, D. T. (2015) · Nature · doi:10.1038/nature14589 · Cited by 637
Self-citationThe rise of atmospheric oxygen
Kump, L. R. (2008) · Nature · doi:10.1038/nature06587 · Cited by 553
Babechuk, M. G., Widdowson, M., & Kamber, B. S. (2013) · Chemical Geology · doi:10.1016/j.chemgeo.2013.10.027 · Cited by 543
Paleosols and the evolution of atmospheric oxygen; a critical review
Rye, R., & Holland, H. D. (1998) · American Journal of Science · doi:10.2475/ajs.298.8.621 · Cited by 524
Low marine sulphate and protracted oxygenation of the Proterozoic biosphere
Kah, L. C., Lyons, T. W., & Frank, T. D. (2004) · Nature · doi:10.1038/nature02974 · Cited by 482
Self-citationGeochemical evidence for widespread euxinia in the Later Cambrian ocean
Gill, B. C., Lyons, T. W., Young, S. A., Kump, L. R., Knoll, A. H., & Saltzman, M. R. (2011) · Nature · doi:10.1038/nature09700 · Cited by 456
Self-citationDahl, T. W., Hammarlund, E. U., Anbar, A. D., Bond, D. P. G., Gill, B. C., Gordon, G. W., Knoll, A. H., Nielsen, A. T., Schovsbo, N. H., & Canfield, D. E. (2010) · Proceedings of the National Academy of Sciences · doi:10.1073/pnas.1011287107 · Cited by 443
Self-citationThe evolution of the sulfur cycle
Canfield, D. E. (1999) · American Journal of Science · doi:10.2475/ajs.299.7-9.697 · Cited by 378
The geologic history of seawater pH
Halevy, I., & Bachan, A. (2017) · Science · doi:10.1126/science.aal4151 · Cited by 376
Redox cycling of rare earth elements in the suboxic zone of the Black Sea
German, C. R., Holliday, B. P., & Elderfield, H. (1991) · Geochimica et Cosmochimica Acta · doi:10.1016/0016-7037(91)90055-a · Cited by 371
Constraining the climate and ocean pH of the early Earth with a geological carbon cycle model
Krissansen-Totton, J., Arney, G. N., & Catling, D. C. (2018) · Proceedings of the National Academy of Sciences · doi:10.1073/pnas.1721296115 · Cited by 348
Sufficient oxygen for animal respiration 1,400 million years ago
Zhang, S., Wang, X., Wang, H., Bjerrum, C. J., Hammarlund, E. U., Costa, M. M., Connelly, J. N., Zhang, B., Su, J., & Canfield, D. E. (2016) · Proceedings of the National Academy of Sciences · doi:10.1073/pnas.1523449113 · Cited by 344
Banner, J. L., Hanson, G. N., & Meyers, W. J. (1988) · Journal of Sedimentary Research · doi:10.1306/212f8daa-2b24-11d7-8648000102c1865d · Cited by 326
Oxygenation history of the Neoproterozoic to early Phanerozoic and the rise of land plants
Wallace, M. W., Hood, A. V., Shuster, A., Greig, A., Planavsky, N. J., & Reed, C. P. (2017) · Earth and Planetary Science Letters · doi:10.1016/j.epsl.2017.02.046 · Cited by 299
A shale-hosted Cr isotope record of low atmospheric oxygen during the Proterozoic
Cole, D. B., Reinhard, C. T., Wang, X., Gueguen, B., Halverson, G. P., Gibson, T., Hodgskiss, M. S. W., McKenzie, N. R., Lyons, T. W., & Planavsky, N. J. (2016) · Geology · doi:10.1130/g37787.1 · Cited by 296
Earth's oxygen cycle and the evolution of animal life
Reinhard, C. T., Planavsky, N. J., Olson, S. L., Lyons, T. W., & Erwin, D. H. (2016) · Proceedings of the National Academy of Sciences · doi:10.1073/pnas.1521544113 · Cited by 287
Webb, G., Nothdurft, L. D., Kamber, B., Kloprogge, J. T., & Zhao, J.-X. (2009) · Sedimentology · doi:10.1111/j.1365-3091.2008.01041.x · Cited by 267
Late inception of a resiliently oxygenated upper ocean
Lu, W., Ridgwell, A. J., Thomas, E., Hardisty, D. S., Luo, G., Algeo, T. J., Saltzman, M. R., Gill, B. C., Shen, Y., Ling, H.-F., et al. (2018) · Science · doi:10.1126/science.aar5372 · Cited by 241
Quantifying the areal extent and dissolved oxygen concentrations of Archean oxygen oases
Olson, S. L., Kump, L. R., & Kasting, J. F. (2013) · Chemical Geology · doi:10.1016/j.chemgeo.2013.08.012 · Cited by 239
Oxygenation of the mid-Proterozoic atmosphere: clues from chromium isotopes in carbonates
Gilleaudeau, G. J., Frei, R., Kaufman, A. J., Kah, L. C., Azmy, K., Bartley, J. K., Chernyavskiy, P., & Knoll, A. H. (2016) · Geochemical Perspectives Letters · doi:10.7185/geochemlet.1618 · Cited by 214
Self-citationKamber, B. S., Bolhar, R., & Webb, G. E. (2004) · Precambrian Research · doi:10.1016/j.precamres.2004.03.006 · Cited by 200
Triple oxygen isotope evidence for limited mid-Proterozoic primary productivity
Crockford, P. W., Hayles, J. A., Bao, H., Planavsky, N. J., Bekker, A., Fralick, P. W., Halverson, G. P., Bui, T. H., Peng, Y., & Wing, B. A. (2018) · Nature · doi:10.1038/s41586-018-0349-y · Cited by 196
Self-citationNozaki, Y., & Alibo, D. S. (2003) · Earth and Planetary Science Letters · doi:10.1016/s0012-821x(02)01027-0 · Cited by 196
Highly fractionated chromium isotopes in Mesoproterozoic-aged shales and atmospheric oxygen
Canfield, D. E., Zhang, S., Frank, A. B., Wang, X., Wang, H., Su, J., Ye, Y., & Frei, R. (2018) · Nature Communications · doi:10.1038/s41467-018-05263-9 · Cited by 184
The Ecological Physiology of Earth's Second Oxygen Revolution
Sperling, E. A., Knoll, A. H., & Girguis, P. R. (2015) · Annual Review of Ecology Evolution and Systematics · doi:10.1146/annurev-ecolsys-110512-135808 · Cited by 169
Self-citationA pulse of oxygen increase in the early Mesoproterozoic ocean at ca. 1.57–1.56 Ga
Shang, M., Tang, D., Shi, X., Zhou, L., Zhou, X., Song, H., & Jiang, G. (2019) · Earth and Planetary Science Letters · doi:10.1016/j.epsl.2019.115797 · Cited by 143
Liu, X., Hardisty, D. S., Lyons, T. W., & Swart, P. K. (2018) · Geochimica et Cosmochimica Acta · doi:10.1016/j.gca.2018.12.028 · Cited by 141
Self-citationKamber, B. S., Webb, G. E., & Gallagher, M. (2014) · Journal of the Geological Society · doi:10.1144/jgs2013-110 · Cited by 137
Constraints on Paleoproterozoic atmospheric oxygen levels
Bellefroid, E. J., Hood, A. V. S., Hoffman, P. F., Thomas, M. D., Reinhard, C. T., & Planavsky, N. J. (2018) · Proceedings of the National Academy of Sciences · doi:10.1073/pnas.1806216115 · Cited by 129
Ediacaran reorganization of the marine phosphorus cycle
Laakso, T. A., Sperling, E. A., Johnston, D. T., & Knoll, A. H. (2020) · Proceedings of the National Academy of Sciences · doi:10.1073/pnas.1916738117 · Cited by 100
Self-citationTracing Earth’s O2 evolution using Zn/Fe ratios in marine carbonates
Liu, X., Kah, L. C., Knoll, A. H., Cui, H., Kaufman, A. J., Shahar, A., & Hazen, R. M. (2015) · Geochemical Perspectives Letters · doi:10.7185/geochemlet.1603 · Cited by 90
Self-citationProtracted oxygenation of the Proterozoic biosphere
Kah, L. C., & Bartley, J. K. (2011) · International Geology Review · doi:10.1080/00206814.2010.527651 · Cited by 72
Self-citationWhat do Ce anomalies in marine carbonates really mean? A perspective from leaching experiments
Cao, C., Liu, X., Bataille, C. P., & Liu, C. (2019) · Chemical Geology · doi:10.1016/j.chemgeo.2019.119413 · Cited by 68
Self-citationBanner, J. L., Hanson, G. N., & Meyers, W. J. (1988) · Journal of Sedimentary Research · doi:10.2110/jsr.58.673 · Cited by 64
Neoproterozoic marine dolomite hardgrounds and their relationship to cap dolomites
Wallace, M. W., Hood, A. V. S., Fayle, J., Hordern, E. S., & O'Hare, T. F. (2019) · Precambrian Research · doi:10.1016/j.precamres.2019.04.026 · Cited by 28
The global record of local iron geochemical data from Proterozoic through Paleozoic basins
Sperling, E. A., Wolock, C. J., Johnston, D. T., & Knoll, A. H. (2013) · AGUFM · Cited by 3
Self-citation
Research works printed but not linked: 1
- Cao, C., Liu, X.-M., Owens, J. D., Jenkyns, H. C. Late Cretaceous cerium anomalies and globally distinctive redox responses before, during and after Oceanic anoxic event 2. Paleoceanogr. Paleoclimatol. in review (202X).
Cited by
Sorted by citations
Oxygenation, Life, and the Planetary System during Earth's Middle History: An Overview
Lyons, T. W., Diamond, C. W., Planavsky, N. J., Reinhard, C. T., & Li, C. (2021) · Astrobiology · doi:10.1089/ast.2020.2418 · Cited by 211
“Cerium (Ce) records from the mid-Proterozoic point similarly to low oxygen conditions even in shallow waters where carbonates were forming (Tang et al., 2016; Liu et al., 2021).”
BackgroundSedimentary Ce anomalies: Secular change and implications for paleoenvironmental evolution
Zhang, K., & Shields, G. (2022) · Earth-Science Reviews · doi:10.1016/j.earscirev.2022.104015 · Cited by 162
Progress towards an improved Precambrian seawater 87Sr/86Sr curve
Chen, X., Zhou, Y., & Shields, G. (2021) · Earth-Science Reviews · doi:10.1016/j.earscirev.2021.103869 · Cited by 139
Evolution of Atmospheric O2 Through the Phanerozoic, Revisited
Mills, B. J. W., Krause, A. J., Jarvis, I., & Cramer, B. D. (2023) · Annual Review of Earth and Planetary Sciences · doi:10.1146/annurev-earth-032320-095425 · Cited by 135
The History of Ocean Oxygenation
Reinhard, C. T., & Planavsky, N. J. (2022) · Annual Review of Marine Science · doi:10.1146/annurev-marine-031721-104005 · Cited by 91
Metadata
- Authors
- Liu, X.-M., Kah, L. C., Knoll, A. H., Cui, H., Wang, C., Bekker, A., & Hazen, R. M.
- Affiliations
- University of Tennessee at Knoxville (US)
- Harvard University (US)
- Institut de physique du globe de Paris (FR)
- University of North Carolina at Chapel Hill (US)
- University of California, Riverside (US)
- Carnegie Institution for Science (US)
- Venue
- Nature Communications
- Published
- 2021-01-13
- Volume
- 12
- Issue
- 1
- Pages
- 351-351
- ISSN
- 2041-1723 (ISSN-L)
- PMC
- PMC7806885
- OpenAlex
- W3120679837
- Cited by
- 116
- References
- 47
- Citations by year
- 2026: 11 · 2025: 20 · 2024: 28 · 2023: 24 · 2022: 21 · 2021: 12
- FWCI
- 15.96
- Type
- journal article
- Language
- en
- Open access
- gold
- doi.org
- Locations
- Nature Communications (publishedVersion, cc-by)
- Europe PMC (PubMed Central) (publishedVersion, other-oa)
- PubMed Central (publishedVersion, cc-by)
- PubMed (publishedVersion)
- RePEc: Research Papers in Economics (submittedVersion)
- DOAJ (DOAJ: Directory of Open Access Journals) (submittedVersion, cc-by-sa)
- eScholarship (California Digital Library) (submittedVersion, cc-by)
- Funders
- National Science Foundation (EAR-1848153)
- United States Department of Defense | United States Army | U.S. Army Research, Development and Engineering Command | Army Research Office (W911NF-17-2-0028)
- Canadian Network for Research and Innovation in Machining Technology, Natural Sciences and Engineering Research Council of Canada
- W. M. Keck Foundation
- John Templeton Foundation
- Topics
- Physical Sciences › Earth and Planetary Sciences › Paleontology › Paleontology and Stratigraphy of Fossils
- Physical Sciences › Earth and Planetary Sciences › Geochemistry and Petrology › Geochemistry and Elemental Analysis
- Physical Sciences › Earth and Planetary Sciences › Geochemistry and Petrology › Geological and Geochemical Analysis
- Keywords
- atmospheric oxygen, cerium anomaly, rare earth elements, Great Oxidation Event, oxygen partial pressure, paleo-oxygenation, biogeochemical cycles, thermodynamic modeling
About these checks
Registry, retraction, Cites and statistics results are computed, not judged, with one exception: a printed reference that no index lists is read once by a model before it counts as a citation error. Claims are extracted by a model and kept only when their quote appears verbatim in the text; each cited source is then checked, with a model’s help, for whether it says what the claim relies on. Those verdicts can be wrong — read the claim’s quote and the cited source before relying on one.
Statistics and arithmetic are recomputed, not judged.
Confidence bands are shown only for fields calibrated on our annotated test set. None is calibrated yet, so no band is shown.
What counts as a claim ›How we measure confidence ›How we check this ›
Are you an author, or do you see a problem with this page? Request a review
