

The DOI matches its Crossref record; 11 of the 11 references it cites were found in a registry or an index.
Distinct genetic pathways define pre-malignant versus compensatory clonal hematopoiesis in Shwachman-Diamond syndrome
Abstract
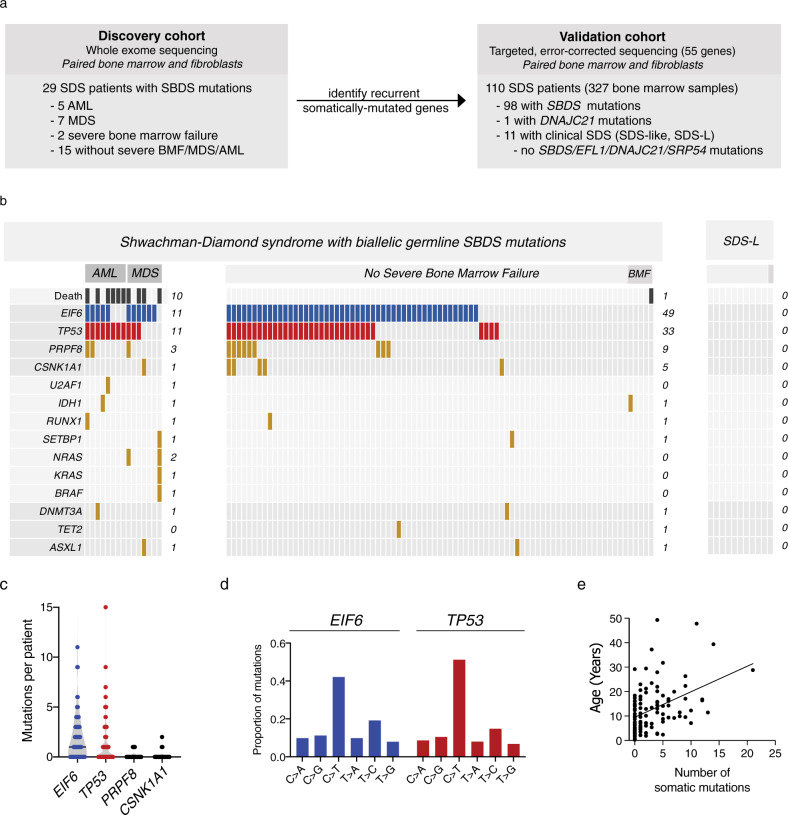
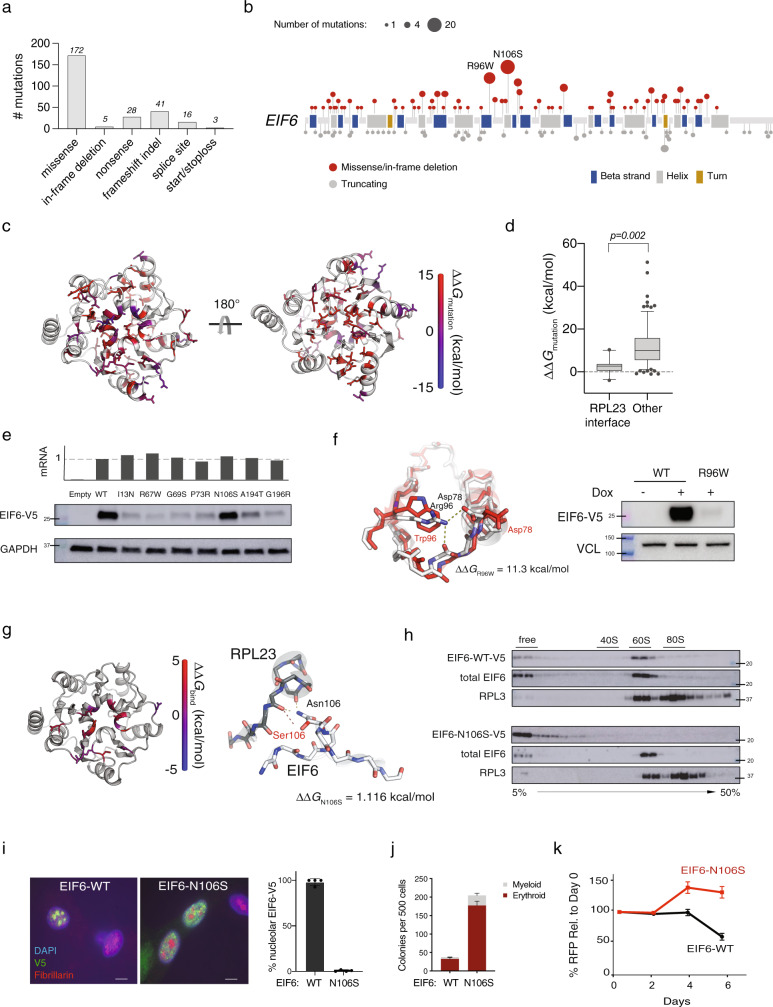
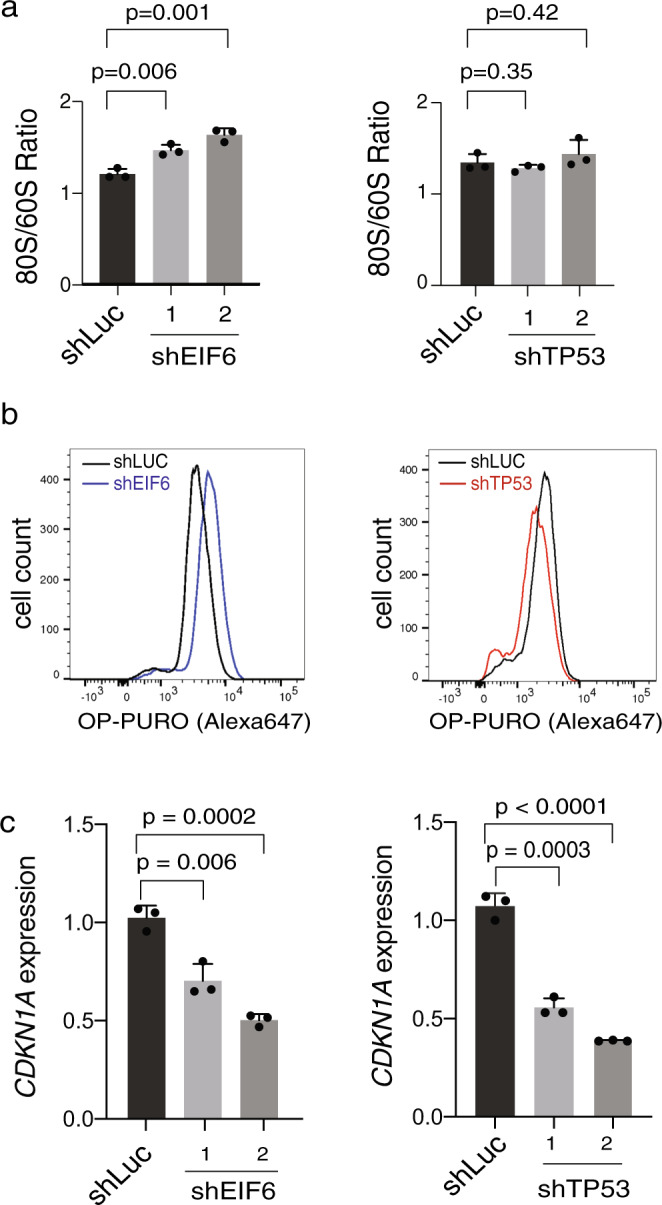
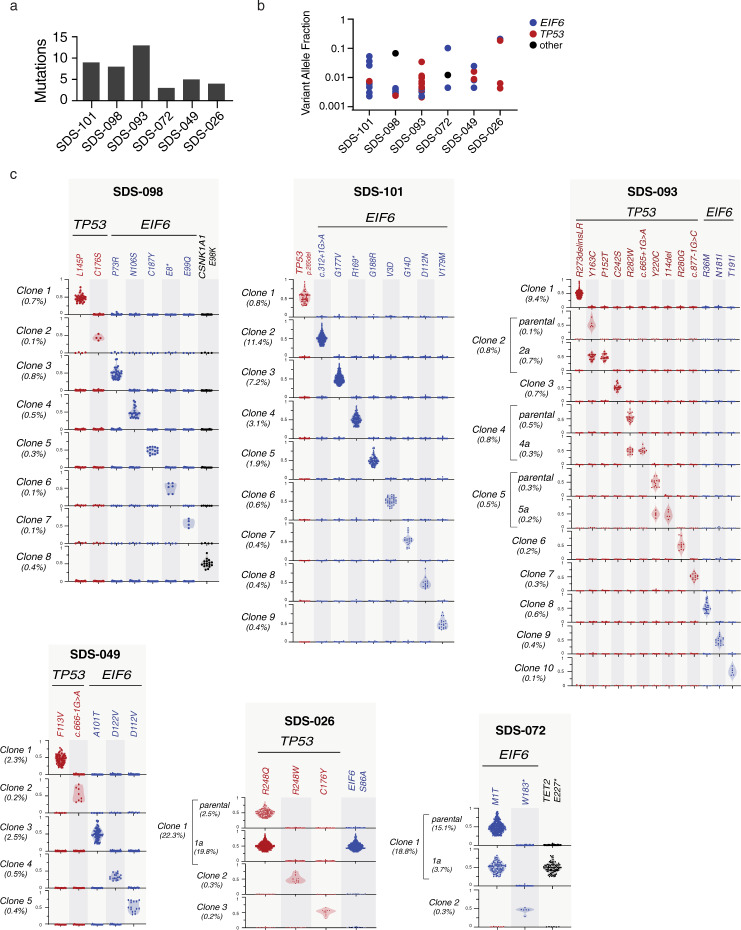
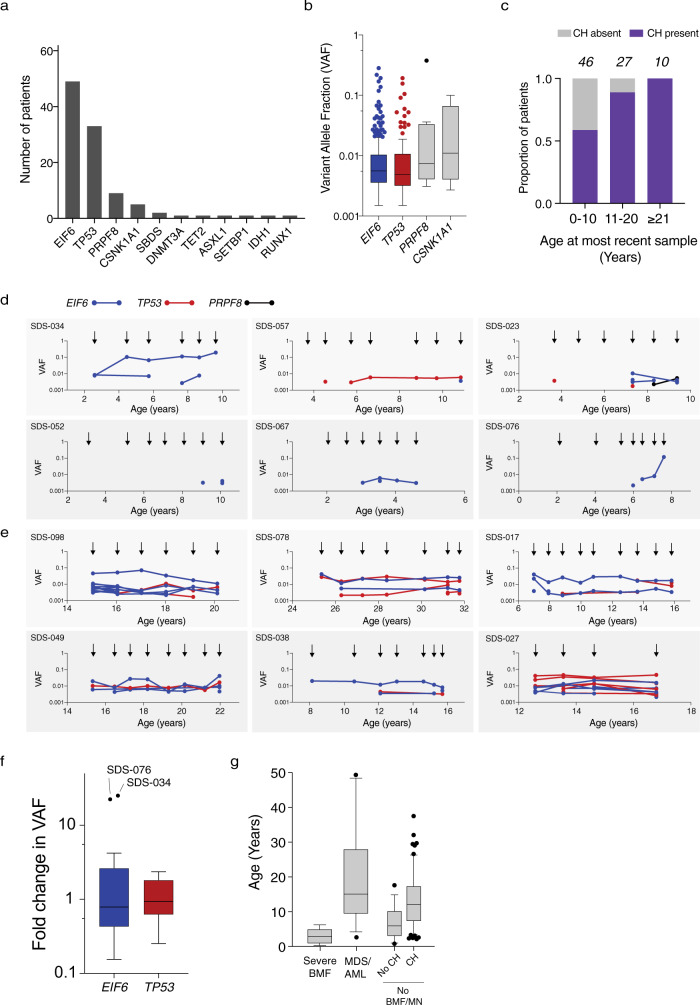
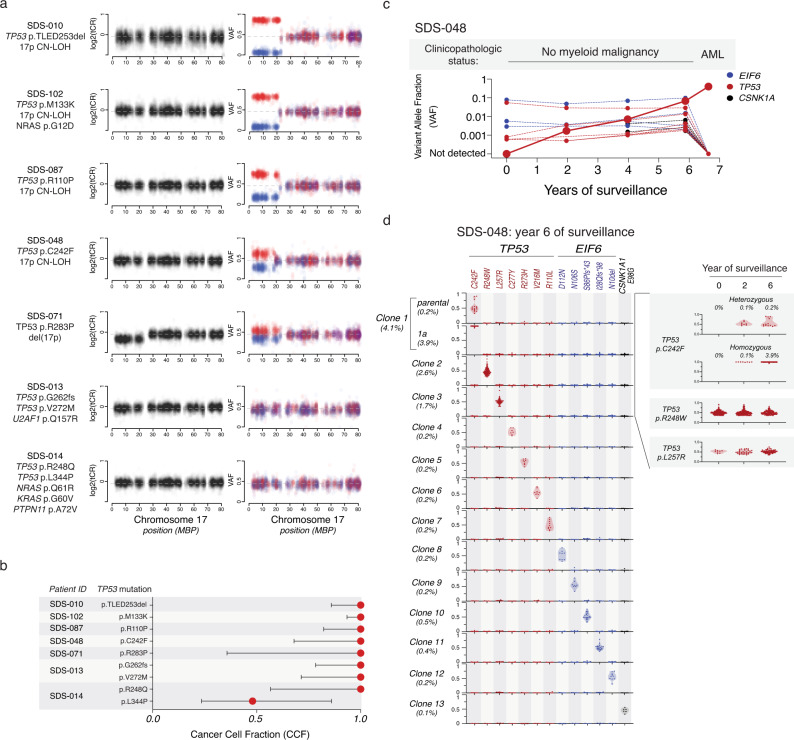
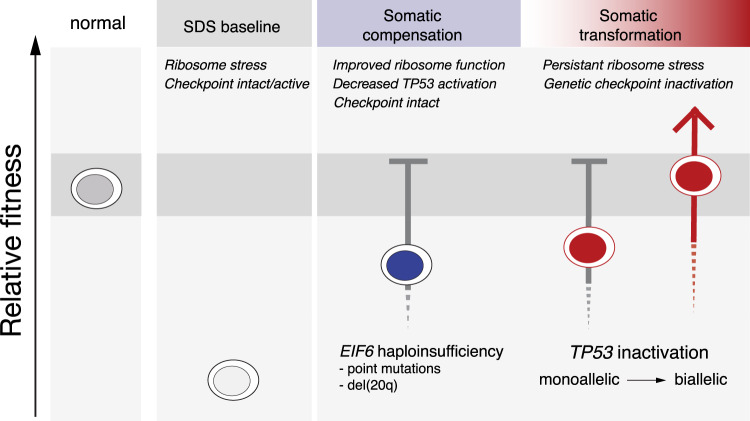
To understand the mechanisms that mediate germline genetic leukemia predisposition, we studied the inherited ribosomopathy Shwachman-Diamond syndrome (SDS), a bone marrow failure disorder with high risk of myeloid malignancies at an early age. To define the mechanistic basis of clonal hematopoiesis in SDS, we investigate somatic mutations acquired by patients with SDS followed longitudinally. Here we report that multiple independent somatic hematopoietic clones arise early in life, most commonly harboring heterozygous mutations in EIF6 or TP53 . We show that germline SBDS deficiency establishes a fitness constraint that drives selection of somatic clones via two distinct mechanisms with different clinical consequences. EIF6 inactivation mediates a compensatory pathway with limited leukemic potential by ameliorating the underlying SDS ribosome defect and enhancing clone fitness. TP53 mutations define a maladaptive pathway with enhanced leukemic potential by inactivating tumor suppressor checkpoints without correcting the ribosome defect. Subsequent development of leukemia was associated with acquisition of biallelic TP53 alterations. These results mechanistically link leukemia predisposition to germline genetic constraints on cellular fitness, and provide a rational framework for clinical surveillance strategies.
Overview
The claims and statistics of this paper haven’t been checked yet.
Run the check — free, no account needed. It reads the open-access text and checks the sources it cites.
Integrity signals
Registry
Cites
Statistics
Figures
Verification
Claims the paper makes
The claims and statistics of this paper haven’t been checked yet.
Run the check — free, no account needed. It reads the open-access text and checks the sources it cites.
Claims other papers make about this one
Each is checked against this paper’s own text: does it say what the citing paper says it does?
In the citing paper
“Among children and young adults with germline hematologic predisposition, CH has been shown to compensate for germline defects”
From Germline genetic variation impacts clonal hematopoiesis landscape and progression to malignancy (2025) · cites this paper as [18]
In the citing paper
“Among individuals with rare Mendelian cancer predisposition syndromes, carriers often show distinct CH mutational profiles reflecting strong selective pressures18–21.”
From Germline genetic variation impacts clonal hematopoiesis landscape and progression to malignancy (2025) · cites this paper as [18]
In the citing paper
“leading to restoration of normal hematopoiesis in some cases but malignant transformation in others18.”
From Germline genetic variation impacts clonal hematopoiesis landscape and progression to malignancy (2025) · cites this paper as [18]
Self-check
Percentages, sums and reported differences re-computed from the paper’s own numbers.
The self-check needs the paper’s full text.
Citations
Cites
Arber, D. A., Orazi, A., Hasserjian, R., Thiele, J., Borowitz, M. J., Le Beau, M. M., Bloomfield, C. D., Cazzola, M., & Vardiman, J. W. (2016) · Blood · doi:10.1182/blood-2016-03-643544 · Cited by 10,119 · cited 2×
“To quantify the technical dropout, we defined the proportion of targeted mutations, which were defined as those (1) present in the bulk sequencing and (2) located in designable amplicons, for which genotyping was successful.”
BackgroundSignatures of mutational processes in human cancer
Initiative, A. P. C. G., Alexandrov, L. B., ICGC Breast Cancer Consortium, ICGC MMML-Seq Consortium, PedBrain, I., Nik-Zainal, S., Wedge, D. C., Aparicio, S. A. J. R., Behjati, S., Biankin, A. V., et al. (2013) · Nature · doi:10.1038/nature12477 · Cited by 9,660
An integrated map of genetic variation from 1,092 human genomes
The 1000 Genomes Project Consortium (2012) · Nature · doi:10.1038/nature11632 · Cited by 7,711
Age-related clonal hematopoiesis associated with adverse outcomes
Jaiswal, S., Fontanillas, P., Flannick, J., Manning, A., Grauman, P. V., Mar, B. G., Lindsley, R. C., Mermel, C. H., Burtt, N., Chavez, A., et al. (2014) · New England Journal of Medicine · doi:10.1056/nejmoa1408617 · Cited by 4,841
Self-citationGenomic classification and prognosis in acute myeloid leukemia
Papaemmanuil, E., Gerstung, M., Bullinger, L., Gaidzik, V. I., Paschka, P., Roberts, N. D., Potter, N. E., Heuser, M., Thol, F., Bolli, N., et al. (2016) · New England Journal of Medicine · doi:10.1056/nejmoa1516192 · Cited by 4,350
Clonal hematopoiesis and blood-cancer risk inferred from blood DNA sequence
Genovese, G., Kähler, A. K., Handsaker, R. E., Lindberg, J., Rose, S. A., Bakhoum, S. F., Chambert, K., Mick, E., Neale, B. M., Fromer, M., et al. (2014) · New England Journal of Medicine · doi:10.1056/nejmoa1409405 · Cited by 3,531
A linear complexity phasing method for thousands of genomes
Delaneau, O., Marchini, J., & Zagury, J.-F. (2012) · Nature Methods · doi:10.1038/nmeth.1785 · Cited by 1,850
Prognostic Mutations in Myelodysplastic Syndrome after Stem-Cell Transplantation
Lindsley, R. C., Saber, W., Mar, B. G., Redd, R., Wang, T., Haagenson, M. D., Grauman, P. V., Hu, Z.-H., Spellman, S. R., Lee, S. J., et al. (2017) · New England Journal of Medicine · doi:10.1056/nejmoa1611604 · Cited by 776
Self-citationBernard, E., Nannya, Y., Hasserjian, R. P., Devlin, S. M., Tuechler, H., Medina-Martinez, J. S., Yoshizato, T., Shiozawa, Y., Saiki, R., Malcovati, L., et al. (2020) · Nature Medicine · doi:10.1038/s41591-020-1008-z · Cited by 648
A public genome-scale lentiviral expression library of human ORFs
Yang, X., Boehm, J. S., Yang, X., Salehi-Ashtiani, K., Hao, T., Shen, Y., Lubonja, R., Thomas, S. R., Alkan, O., Bhimdi, T., et al. (2011) · Nature Methods · doi:10.1038/nmeth.1638 · Cited by 570
Research works printed but not linked: 49
- Nelson, A. S. & Myers, K. C. Diagnosis, Treatment, and Molecular Pathology of Shwachman-Diamond Syndrome. Hematol. Oncol. Clin. North Am. 32, 687–700 (2018). · DOI
- Dror, Y. et al. Clonal evolution in marrows of patients with Shwachman-Diamond syndrome: a prospective 5-year follow-up study. Exp. Hematol. 30, 659–669 (2002). · DOI
- Donadieu, J. et al. Classification of and risk factors for hematologic complications in a French national cohort of 102 patients with Shwachman-Diamond syndrome. Haematologica 97, 1312–1319 (2012). · DOI
- Boocock, G. R. B. et al. Mutations in SBDS are associated with Shwachman–Diamond syndrome. Nat. Genet. 33, 97–101 (2003). · DOI
- Warren, A. J. Molecular basis of the human ribosomopathy Shwachman-Diamond syndrome. Adv. Biol. Regul. 67, 109–127 (2018). · DOI
- Narla, A. & Ebert, B. L. Ribosomopathies: human disorders of ribosome dysfunction. Blood 115, 3196–3205 (2010). · DOI
- Tourlakis, M. E. et al. Deficiency of Sbds in the mouse pancreas leads to features of Shwachman-Diamond syndrome, with loss of zymogen granules. Gastroenterology 143, 481–492 (2012). · DOI
- Dror, Y. & Freedman, M. H. Shwachman-Diamond syndrome marrow cells show abnormally increased apoptosis mediated through the Fas pathway. Blood 97, 3011–3016 (2001). · DOI
- Myers, K. C. et al. Clinical features and outcomes of patients with Shwachman-Diamond syndrome and myelodysplastic syndrome or acute myeloid leukaemia: a multicentre, retrospective, cohort study. Lancet Haematol. 7, e238–e246 (2020). · DOI
- Furutani, E. & Shimamura, A. Germline genetic predisposition to hematologic malignancy. J. Clin. Oncol. 35, 1018–1028 (2017). · DOI
- Bursac, S., Brdovcak, M. C., Donati, G. & Volarevic, S. Activation of the tumor suppressor p53 upon impairment of ribosome biogenesis. Biochim. Biophys. Acta (BBA)—Mol. Basis Dis. 1842, 817–830 (2014). · DOI
- Xia, J. et al. Somatic mutations and clonal hematopoiesis in congenital neutropenia. Blood 131, 408–416 (2018). · DOI
- Pressato, B. et al. Deletion of chromosome 20 in bone marrow of patients with Shwachman-Diamond syndrome, loss of the EIF6 gene and benign prognosis. Br. J. Haematol. 157, 503–505 (2012). · DOI
- Stratton, M. R., Campbell, P. J. & Andrew Futreal, P. The cancer genome. Nature 458, 719–724 (2009). · DOI
- Osorio, F. G. et al. Somatic mutations reveal lineage relationships and age-related mutagenesis in human hematopoiesis. Cell Rep. 25, 2308–2316.e4 (2018). · DOI · Paper page
- Groft, C. M., Beckmann, R., Sali, A. & Burley, S. K. Crystal structures of ribosome anti-association factor IF6. Nat. Struct. Biol. 7, 1156–1164 (2000). · DOI
- Gartmann, M. et al. Mechanism of eIF6-mediated inhibition of ribosomal subunit joining. J. Biol. Chem. 285, 14848–14851 (2010). · DOI
- Weis, F. et al. Mechanism of eIF6 release from the nascent 60S ribosomal subunit. Nat. Struct. Mol. Biol. 22, 914–919 (2015). · DOI
- Barlow, K. A. et al. Flex ddG: Rosetta ensemble-based estimation of changes in protein–protein binding affinity upon mutation. J. Phys. Chem. B 122, 5389–5399 (2018). · DOI
- Wong, C. C., Traynor, D., Basse, N., Kay, R. R. & Warren, A. J. Defective ribosome assembly in Shwachman-Diamond syndrome. Blood 118, 4305–4312 (2011). · DOI
- Ceci, M. et al. Release of eIF6 (p27BBP) from the 60S subunit allows 80S ribosome assembly. Nature 426, 579–584 (2003). · DOI
- Gallo, S., Beugnet, A. & Biffo, S. Tagging of functional ribosomes in living cells by HaloTag® technology. In Vitro Cell. Dev. Biol. Anim. 47, 132–138 (2011). · DOI
- Menne, T. F. et al. The Shwachman-Bodian-Diamond syndrome protein mediates translational activation of ribosomes in yeast. Nat. Genet. 39, 486–495 (2007). · DOI
- Ganapathi, K. A. et al. The human Shwachman-Diamond syndrome protein, SBDS, associates with ribosomal RNA. Blood 110, 1458–1465 (2007). · DOI
- Elghetany, M. T. & Alter, B. P. p53 protein overexpression in bone marrow biopsies of patients with Shwachman-Diamond syndrome has a prevalence similar to that of patients with refractory anemia. Arch. Pathol. Lab. Med. 126, 452–455 (2002). · DOI
- Carter, S. L. et al. Absolute quantification of somatic DNA alterations in human cancer. Nat. Biotechnol. 30, 413–421 (2012). · DOI
- Landau, D. A., Carter, S. L., Getz, G. & Wu, C. J. Clonal evolution in hematological malignancies and therapeutic implications. Leukemia 28, 34–43 (2014). · DOI
- Miluzio, A. et al. Impairment of cytoplasmic eIF6 activity restricts lymphomagenesis and tumor progression without affecting normal growth. Cancer Cell 19, 765–775 (2011). · DOI
- Gregory, J. J. et al. Somatic mosaicism in Fanconi anemia: evidence of genotypic reversion in lymphohematopoietic stem cells. Proc. Natl Acad. Sci. USA 98, 2532–2537 (2001). · DOI
- Hamanoue, S. et al. Myeloid lineage-selective growth of revertant cells in Fanconi anaemia. Br. J. Haematol. 132, 630–635 (2006). · DOI
- Foe, J. R. L. T. et al. Somatic mosaicism in fanconi anemia: molecular basis and clinical significance. Eur. J. Hum. Genet. 5, 137–148 (1997). · DOI · Paper page
- Austin, K. M., Leary, R. J. & Shimamura, A. The Shwachman-Diamond SBDS protein localizes to the nucleolus. Blood 106, 1253–1258 (2005). · DOI
- Rudin, C. M. et al. Comprehensive genomic analysis identifies SOX2 as a frequently amplified gene in small-cell lung cancer. Nat. Genet. 44, 1111–1116 (2012). · DOI
- Livak, K. J. & Schmittgen, T. D. Analysis of relative gene expression data using real-time quantitative PCR and the 2−ΔΔCT method. Methods 25, 402–408 (2001). · DOI · Paper page
- Guda, S. et al. miRNA-embedded shRNAs for Lineage-specific BCL11A knockdown and hemoglobin F induction. Mol. Ther. 23, 1465–1474 (2015). · DOI
- Adams, F. F. et al. An optimized lentiviral vector system for conditional RNAi and efficient cloning of microRNA embedded short hairpin RNA libraries. Biomaterials 139, 102–115 (2017). · DOI
- Austin, K. M. et al. Mitotic spindle destabilization and genomic instability in Shwachman-Diamond syndrome. J. Clin. Investig. 118, 1511–1518 (2008). · DOI
- Dror, Y. et al. Draft consensus guidelines for diagnosis and treatment of Shwachman-Diamond syndrome. Ann. N. Y. Acad. Sci. 1242, 40–55 (2011). · DOI
- Li, H. & Durbin, R. Fast and accurate short read alignment with Burrows-Wheeler transform. Bioinformatics 25, 1754–1760 (2009). · DOI · Paper page
- McKenna, A. et al. The Genome Analysis Toolkit: a MapReduce framework for analyzing next-generation DNA sequencing data. Genome Res. 20, 1297–1303 (2010). · DOI · Paper page
- DePristo, M. A. et al. A framework for variation discovery and genotyping using next-generation DNA sequencing data. Nat. Genet. 43, 491–498 (2011). · DOI
- Karczewski, K. J. et al. The mutational constraint spectrum quantified from variation in 141,456 humans. https://doi.org/10.1101/531210. · DOI · Paper page
- Forbes, S. A. et al. The catalogue of somatic mutations in cancer (COSMIC). Curr. Protoc. Hum. Genet. 57, 10.11 (2008). · DOI
- Lindsley, R. C. et al. Acute myeloid leukemia ontogeny is defined by distinct somatic mutations. Blood 125, 1367–1376 (2015). · DOI · Paper page
- Raman, S. et al. Structure prediction for CASP8 with all-atom refinement using Rosetta. Proteins 77(Suppl. 9), 89–99 (2009). · DOI
- Song, Y. et al. High-resolution comparative modeling with RosettaCM. Structure 21, 1735–1742 (2013). · DOI
- Tyka, M. D. et al. Alternate states of proteins revealed by detailed energy landscape mapping. J. Mol. Biol. 405, 607–618 (2011). · DOI
- Pavlovicz, R. E., Park, H. & DiMaio, F. Efficient consideration of coordinated water molecules improves computational protein–protein and protein–ligand docking. PLoS Comput. Biol. 16, e1008103 (2020). · DOI
- Ashkenazy, H. et al. ConSurf 2016: an improved methodology to estimate and visualize evolutionary conservation in macromolecules. Nucleic Acids Res. 44, W344–W350 (2016). · DOI · Paper page
Cited by
Arber, D. A., Orazi, A., Hasserjian, R. P., Borowitz, M. J., Calvo, K. R., Kvasnicka, H.-M., Wang, S. A., Bagg, A., Barbui, T., Branford, S., et al. (2022) · Blood · doi:10.1182/blood.2022015850 · Cited by 2,945
Self-citationClonal hematopoiesis and inflammation – the perpetual cycle
Avagyan, S., & Zon, L. I. (2023) · Trends in Cell Biology · doi:10.1016/j.tcb.2022.12.001 · Cited by 79
Germline genetic variation impacts clonal hematopoiesis landscape and progression to malignancy
Liu, J., Tran, D., Xue, L., Wiley, B. J., Vlasschaert, C., Watson, C. J., MacGregor, H. A. J., Zong, X., Chan, I. C. C., Das, I., et al. (2025) · Nature Genetics · doi:10.1038/s41588-025-02250-x · Cited by 33
Metadata
- Authors
- Kennedy, A. L., Myers, K. C., Bowman, J., Gibson, C. J., Camarda, N. D., Furutani, E., Muscato, G. M., Klein, R. H., Ballotti, K., Liu, S., Harris, C. E., Galvin, A., Malsch, M., Dale, D., Gansner, J. M., Nakano, T. A., Bertuch, A., Vlachos, A., Lipton, J. M., Castillo, P., Connelly, J., Churpek, J., Edwards, J. R., Hijiya, N., Ho, R. H., Hofmann, I., Huang, J. N., Keel, S., Lamble, A., Lau, B. W., Norkin, M., Stieglitz, E., Stock, W., Walkovich, K., Boettcher, S., Brendel, C., Fleming, M. D., Davies, S. M., Weller, E. A., Bahl, C., Carter, S. L., Shimamura, A., & Lindsley, R. C.
- Venue
- Nature Communications
- Published
- 2021-02-26
- Volume
- 12
- Issue
- 1
- ISSN
- 2041-1723
- PMC
- PMC7910481
- Cited by
- 188
- References
- 11
- Language
- en
- Funders
- The Butterfly Guild
About these checks
Registry, retraction, Cites and statistics results are computed, not judged, with one exception: a printed reference that no index lists is read once by a model before it counts as a citation error. Claims are extracted by a model and kept only when their quote appears verbatim in the text; each cited source is then checked, with a model’s help, for whether it says what the claim relies on. Those verdicts can be wrong — read the claim’s quote and the cited source before relying on one.
Statistics and arithmetic are recomputed, not judged.
Confidence bands are shown only for fields calibrated on our annotated test set. None is calibrated yet, so no band is shown.
What counts as a claim ›How we measure confidence ›How we check this ›
Are you an author, or do you see a problem with this page? Request a review
How to cite
Cite CoChat for the checks on this page, and the paper for its own findings.
- This page
- CoChat. (2026). Citation check: Distinct genetic pathways define pre-malignant versus compensatory clonal hematopoiesis in Shwachman-Diamond syndrome. https://app.cochat.ai/papers/10.1038/s41467-021-21588-4
- The paper
- Kennedy, A. L., Myers, K. C., Bowman, J., Gibson, C. J., Camarda, N. D., Furutani, E., Muscato, G. M., Klein, R. H., Ballotti, K., Liu, S., Harris, C. E., Galvin, A., Malsch, M., Dale, D., Gansner, J. M., Nakano, T. A., Bertuch, A., Vlachos, A., Lipton, J. M., . . . Lindsley, R. C. (2021). Distinct genetic pathways define pre-malignant versus compensatory clonal hematopoiesis in Shwachman-Diamond syndrome. Nature Communications. https://doi.org/10.1038/s41467-021-21588-4
