

The DOI matches its Crossref record; 106 of the 107 references it cites were found in a registry or an index.
Skeletal muscle transcriptome in healthy aging
Open accessAbstract
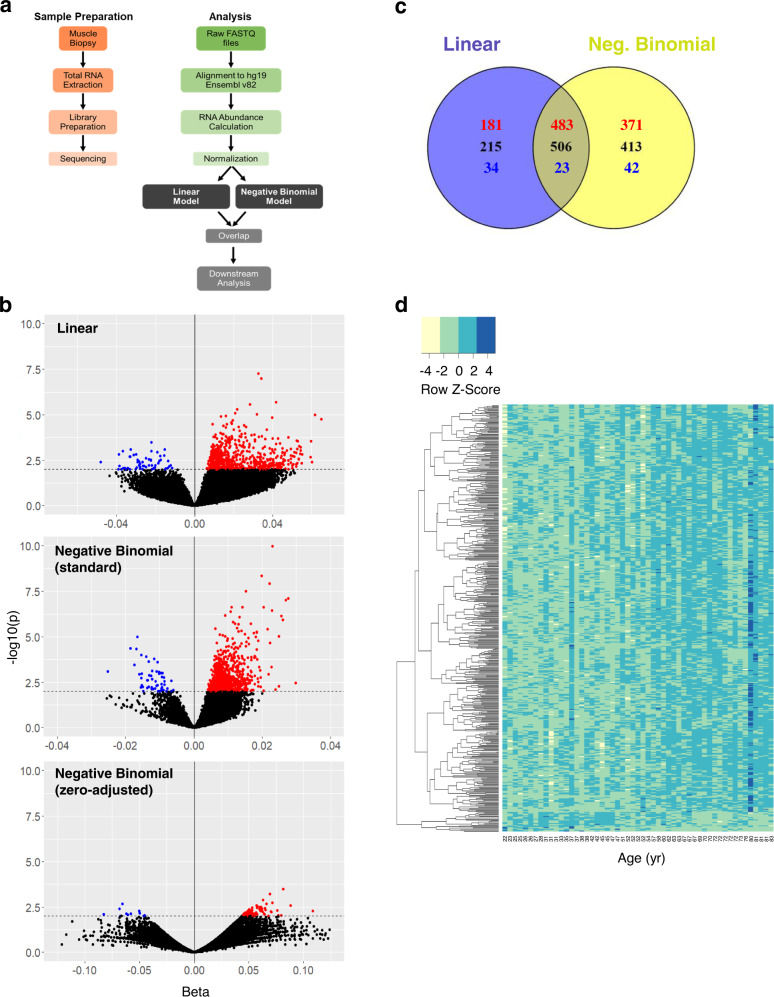
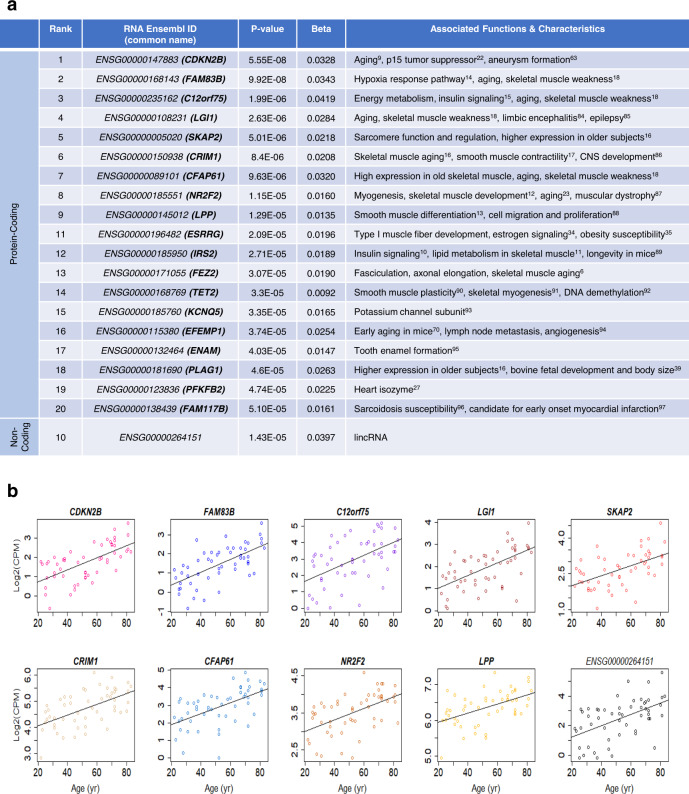
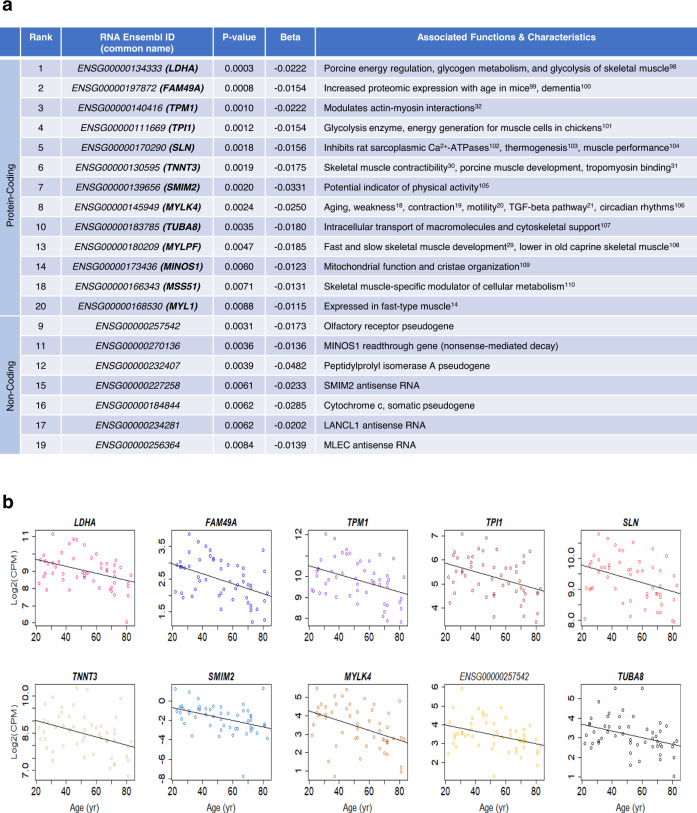
Age-associated changes in gene expression in skeletal muscle of healthy individuals reflect accumulation of damage and compensatory adaptations to preserve tissue integrity. To characterize these changes, RNA was extracted and sequenced from muscle biopsies collected from 53 healthy individuals (22-83 years old) of the GESTALT study of the National Institute on Aging-NIH. Expression levels of 57,205 protein-coding and non-coding RNAs were studied as a function of aging by linear and negative binomial regression models. From both models, 1134 RNAs changed significantly with age. The most differentially abundant mRNAs encoded proteins implicated in several age-related processes, including cellular senescence, insulin signaling, and myogenesis. Specific mRNA isoforms that changed significantly with age in skeletal muscle were enriched for proteins involved in oxidative phosphorylation and adipogenesis. Our study establishes a detailed framework of the global transcriptome and mRNA isoforms that govern muscle damage and homeostasis with age.
Overview
The claims and statistics of this paper haven’t been checked yet.
Run the check — free, no account needed. It reads the open-access text and checks the sources it cites.
Integrity signals
Registry
Cites
Statistics
Figures
Verification
Claims the paper makes
The claims and statistics of this paper haven’t been checked yet.
Run the check — free, no account needed. It reads the open-access text and checks the sources it cites.
Claims other papers make about this one
Each is checked against this paper’s own text: does it say what the citing paper says it does?
In the citing paper
“another study using RNA sequencing analysis from muscle biopsies obtained from 53 healthy individuals (22–83 years old) found that with aging the cyclin-dependent kinase inhibitor 2B (CDKN2B) mRNA, which encodes a protein implicated in cellular senescence, was the top age-related transcript”
From Skeletal muscle aging, cellular senescence, and senotherapeutics: current knowledge and future directions (2021) · cites this paper as Tumasian et al., 2021
Self-check
Percentages, sums and reported differences re-computed from the paper’s own numbers.
The self-check needs the paper’s full text.
Citations
Cites
Subramanian, A., Tamayo, P., Mootha, V. K., Mukherjee, S., Ebert, B. L., Gillette, M. A., Paulovich, A., Pomeroy, S. L., Golub, T. R., Lander, E. S., et al. (2005) · Proceedings of the National Academy of Sciences · doi:10.1073/pnas.0506580102 · Cited by 53,625
STAR: ultrafast universal RNA-seq aligner
Dobin, A., Davis, C. A., Schlesinger, F., Drenkow, J., Zaleski, C., Jha, S., Batut, P., Chaisson, M., & Gingeras, T. R. (2013) · Bioinformatics · doi:10.1093/bioinformatics/bts635 · Cited by 51,709
Robinson, M. D., McCarthy, D. J., & Smyth, G. K. (2010) · Bioinformatics · doi:10.1093/bioinformatics/btp616 · Cited by 41,364
Wickham, H. (2016) · Use R! · doi:10.1007/978-3-319-24277-4 · Cited by 34,873
Cutadapt removes adapter sequences from high-throughput sequencing reads
Martin, M. (2011) · EMBnet.journal · doi:10.14806/ej.17.1.200 · Cited by 33,889
featureCounts: an efficient general purpose program for assigning sequence reads to genomic features
Liao, Y., Smyth, G. K., & Shi, W. (2014) · Bioinformatics · doi:10.1093/bioinformatics/btt656 · Cited by 27,219
Differential expression analysis for sequence count data
Anders, S., & Huber, W. (2010) · Genome Biology · doi:10.1186/gb-2010-11-10-r106 · Cited by 15,581
The GeneCards suite: from gene data mining to disease genome sequence analyses
Stelzer, G., Rosen, N., Plaschkes, I., Zimmerman, S., Twik, M., Fishilevich, S., Stein, T. I., Nudel, R., Lieder, I., Mazor, Y., et al. (2016) · Current Protocols in Bioinformatics · doi:10.1002/cpbi.5 · Cited by 5,550
Li, J.-H., Liu, S., Zhou, H., Qu, L.-H., & Yang, J.-H. (2014) · Nucleic Acids Research · doi:10.1093/nar/gkt1248 · Cited by 4,686
Self-citationDevelopment of Monocytes, Macrophages, and Dendritic Cells
Geissmann, F., Manz, M. G., Jung, S., Sieweke, M. H., Merad, M., & Ley, K. (2010) · Science · doi:10.1126/science.1178331 · Cited by 3,049
Cited by
Sorted by citations
Items 101–125 of 125
Eguchi, T., Hayashiji, N., Tabata, S., Kabetani, K., Shintani, Y., Makinoshima, H., & Ito, N. (2026) · Science Advances · doi:10.1126/sciadv.aeb4011 · Cited by 1
Finger, F., Frost, M., Watanabe, S., Ma, T., Kang, T., Biswas, D., Perez, R. Z., Anton, V., Dollet, L., Markussen, L. K., et al. (2026) · Nature Aging · doi:10.1038/s43587-026-01227-7 · Cited by 2
Cheng, J. H., & Okada, D. (2024) · PeerJ · doi:10.7717/peerj.16851 · Cited by 1
Altab, G., Merry, B. J., Beckett, C. W., Raina, P., Lopes, I., Goljanek‐Whysall, K., & de Magalhães, J. P. (2024) · bioRxiv (Cold Spring Harbor Laboratory) · doi:10.1101/2024.03.09.584213 · Cited by 1
In situ spatial transcriptomic analysis of human skeletal muscle using the Xenium platformPreprint
Umek, N., Meznarič, M., Šink, Ž., Cokan, K. B., Zmrzljak, U. P., & Horvat, S. (2024) · Research Square · doi:10.21203/rs.3.rs-5012685/v1 · Cited by 1
Reed, X., Weller, C. A., Sáez-Atiénzar, S., Beilina, A. G., Solaiman, S., Portley, M. K., Kaileh, M., Roy, R., Ding, J., Moore, A. Z., et al. (2024) · bioRxiv (Cold Spring Harbor Laboratory) · doi:10.1101/2024.12.13.627515 · Cited by 1
Self-citationSarangarajan, R., & Iyengar, K. (2026) · bioRxiv (Cold Spring Harbor Laboratory) · doi:10.64898/2026.04.18.719222 · Cited by 1
Ge, X., Wang, Q., Yao, T., Xie, J., Zhang, C., & Xu, L.-C. (2023) · Obesity Facts · doi:10.1159/000530216
Sayad, S., Hiatt, M., & Mustafa, H. (2023) · medRxiv · doi:10.1101/2023.11.23.23298813
Genome-wide temporal gene expression reveals a post-reproductive shift in the nematode C. briggsaePreprint
van den Berg, W., & Gupta, B. P. (2024) · bioRxiv (Cold Spring Harbor Laboratory) · doi:10.1101/2024.06.04.597319
Weng, C.-J., Lv, L., Yang, L., Zhao, L., Hu, Z.-F., Ma, S., Li, Y.-J., Xiao, W.-X., Wang, Y., Hu, X., et al. (2025) · Science China Life Sciences · doi:10.1007/s11427-024-2877-5
Gene Expression Dynamics Underlying Muscle Aging in the Hawk Moth Manduca sexta
Grosso, A. D., Wone, B., McMahon, C., Downs, H., & Wone, B. W. M. (2025) · Genes · doi:10.3390/genes16111306
Uncertainty-Aware Gene Rankings Reveal Key Players in Coexpression NetworksPreprint
Mahapatra, S., Subramanian, N. A., & Narayanan, M. (2025) · bioRxiv (Cold Spring Harbor Laboratory) · doi:10.64898/2025.12.13.694156
Wang, Z., Tian, W., Wang, D., Guo, Y., Cheng, Z., Zhang, Y., Li, X., Zhi, Y., Li, D., 李转见, et al. (2024) · Figshare · doi:10.6084/m9.figshare.24425800
Cooper, R., Hurst, C., Syddall, H. E., Atkinson, H., Bunn, J. G., Carpinelli, D., Granic, A., Hillman, S. J., Lewis, E. G., McDonald, C., et al. (2026) · medRxiv · doi:10.64898/2026.02.18.26346577
Abbadi, D., Katsara, O., McConnell, R., Walters, B., Blanco, K. G., Canfrán‐Duque, A., Dornbaum, S., Andrews, J. J., & Schneider, R. J. (2026) · Molecular Therapy · doi:10.1016/j.ymthe.2026.02.033
Cooper, R., Hurst, C., Syddall, H. E., Atkinson, H., Bunn, J. G., Carpinelli, D., Granic, A., Hillman, S. J., Lewis, E. G., McDonald, C., et al. (2026) · GeroScience · doi:10.1007/s11357-026-02341-5
Yang, J., Izydore, E. K., Mazan-Mamczarz, K., Tsitsipatis, D., Mattison, J. A., Romero, B., Shi, C., Yang, X., Munk, R. B., Martindale, J. L., et al. (2026) · bioRxiv (Cold Spring Harbor Laboratory) · doi:10.64898/2026.07.05.736613
Self-citationObesity, Ageing, and Longevity: Overview of Obesity Prevalence, Phenotypes and Paradoxes
Kaur, G. (2026) · Healthy ageing and longevity · doi:10.1007/978-3-032-24097-2_1
Perin, L., Sacco, S. D., Liu, Y., Brent, G. A., & Milanesi, A. (2026) · Frontiers in Immunology · doi:10.3389/fimmu.2026.1906969
Wooten, S. V., Brandt, A., Amini, B., Livingston, J. A. A., Roth, M. E., Kleinerman, E. S., & Hildebrandt, M. A. T. (2026) · Journal of Adolescent and Young Adult Oncology · doi:10.1177/21565333261481969
Reed, X., Weller, C. A., Sáez-Atiénzar, S., Beilina, A. G., Solaiman, S., Portley, M., Kaileh, M., Roy, R., Ding, J., Moore, A. Z., et al. (2026) · PLoS ONE · doi:10.1371/journal.pone.0356501 · Cited by 3
Self-citationLiu, X., Li, Z., Yuan, Y., Si, N., & Yin, N. (2026) · International Journal of Molecular Sciences · doi:10.3390/ijms27188283
Giacomello, E., Giraudi, P. J., Rosso, N., Gazzin, S., Tiribelli, C., & Toniolo, L. (2026) · Nutrients · doi:10.3390/nu18203354
Ledesma-Gallardo, S. D., López-Espinosa, E., Ortega-Meléndez, A. I., Ramírez-Salazar, E. G., Patiño, N., Paredez, B. R., Velázquez‐Cruz, R., Hidalgo‐Bravo, A., & Jiménez-Ortega, R. F. (2026) · Cell Biochemistry and Biophysics · doi:10.1007/s12013-026-02200-2
Metadata
- Authors
- Tumasian, R. A., Harish, A., Kundu, G., Yang, J.-H., Ubaida-Mohien, C., Gonzalez-Freire, M., Kaileh, M., Zukley, L. M., Chia, C. W., Lyashkov, A., Wood, W. H., Piao, Y., Coletta, C., Ding, J., Gorospe, M., Sen, R., De, S., & Ferrucci, L.
- Affiliations
- National Institutes of Health (US)
- Corresponding author
- Ferrucci, Luigi
- ORCID
- Venue
- Nature Communications
- Published
- 2021-04-01
- Volume
- 12
- Issue
- 1
- Pages
- 2014-2014
- ISSN
- 2041-1723 (ISSN-L)
- PMC
- PMC8016876
- OpenAlex
- W3142606313
- Cited by
- 126
- References
- 107
- Citations by year
- 2026: 24 · 2025: 26 · 2024: 26 · 2023: 22 · 2022: 23 · 2021: 5
- FWCI
- 5.96
- Type
- journal article
- Language
- en
- Open access
- gold
- doi.org
- Locations
- Nature Communications (publishedVersion, cc-by)
- PubMed Central (publishedVersion, cc-by)
- PubMed (publishedVersion)
- RePEc: Research Papers in Economics (submittedVersion)
- DOAJ (DOAJ: Directory of Open Access Journals) (submittedVersion, cc-by-sa)
- Funders
- U.S. Department of Health & Human Services | National Institutes of Health (Z01-AG000996)
- Topics
- Life Sciences › Biochemistry, Genetics and Molecular Biology › Molecular Biology › Muscle Physiology and Disorders
- Life Sciences › Biochemistry, Genetics and Molecular Biology › Aging › Genetics, Aging, and Longevity in Model Organisms
- Health Sciences › Medicine › Physiology (medical) › Nutrition and Health in Aging
- Keywords
- skeletal muscle, healthy aging, transcriptome, gene expression, age-related changes, cellular senescence, insulin signaling, myogenesis, mRNA isoforms, oxidative phosphorylation, adipogenesis, muscle damage, muscle homeostasis, non-coding RNA
- MeSH terms
- Healthy Aging, Adult, Aged, Aged, 80 and over, Female, Homeostasis, Humans, Male, Middle Aged, Muscular Diseases, RNA, Messenger, Muscle, Skeletal, Gene Expression Profiling, RNA, Untranslated, Young Adult, RNA Isoforms, Transcriptome
About these checks
Registry, retraction, Cites and statistics results are computed, not judged, with one exception: a printed reference that no index lists is read once by a model before it counts as a citation error. Claims are extracted by a model and kept only when their quote appears verbatim in the text; each cited source is then checked, with a model’s help, for whether it says what the claim relies on. Those verdicts can be wrong — read the claim’s quote and the cited source before relying on one.
Statistics and arithmetic are recomputed, not judged.
Confidence bands are shown only for fields calibrated on our annotated test set. None is calibrated yet, so no band is shown.
What counts as a claim ›How we measure confidence ›How we check this ›
Are you an author, or do you see a problem with this page? Request a review
