

The DOI matches its Crossref record; 50 of the 57 references it cites were found in a registry or an index.
COVID-19 pathophysiology may be driven by an imbalance in the renin-angiotensin-aldosterone system
Open accessPublished version of a preprint
Abstract
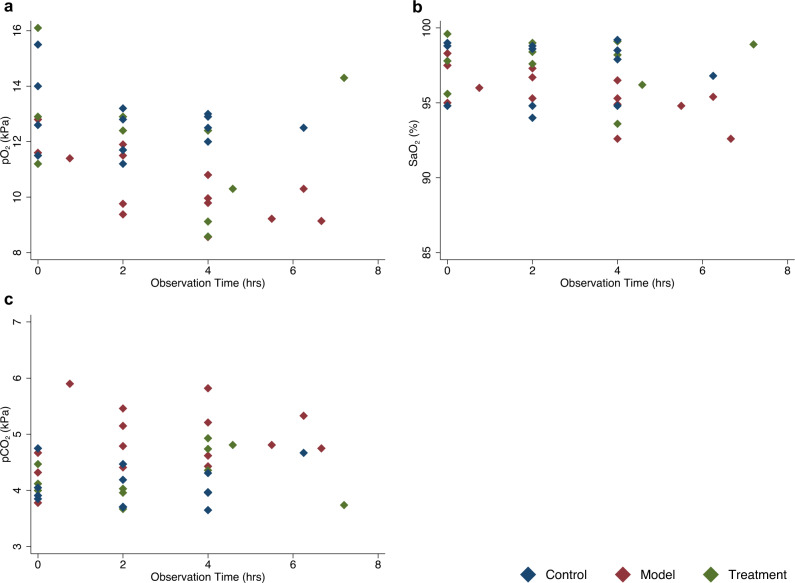
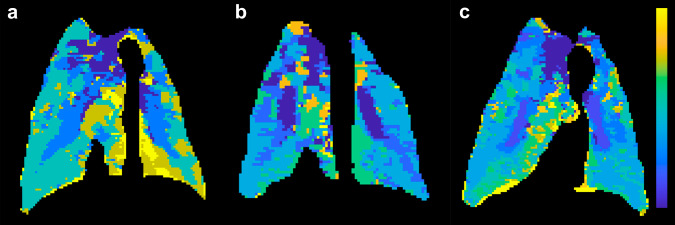
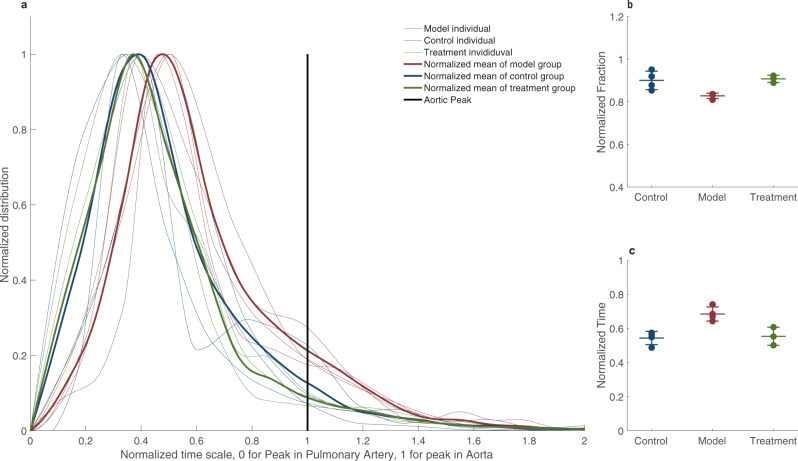
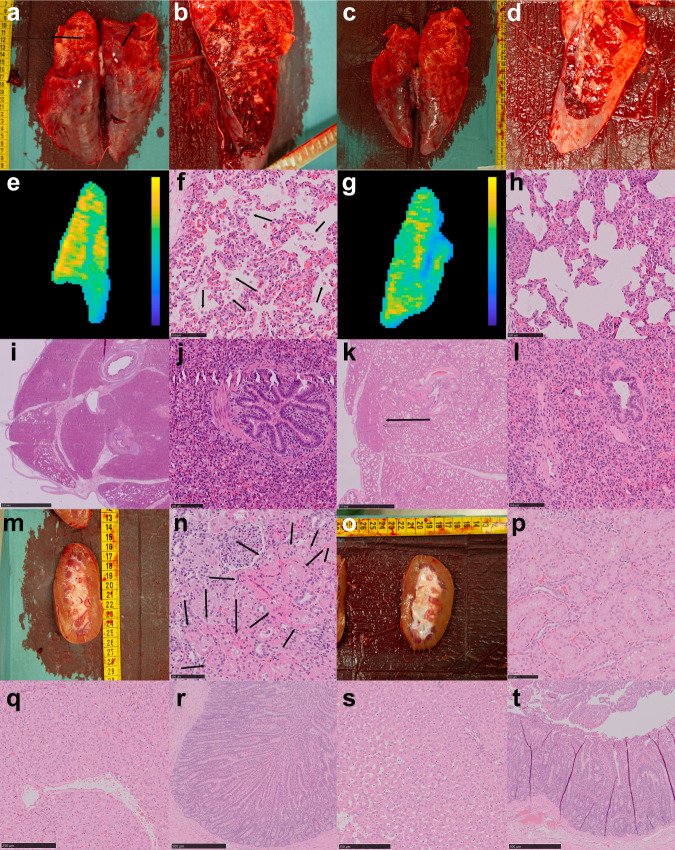
Abstract SARS-CoV-2 enters the cell through the ACE2 receptor, which is considered one of the main inhibitors in the Renin-Angiotensin-Aldosterone System (RAAS).1 ,2 The virus has been shown to downregulate the ACE2 receptor, leading to a subsequent increase in the vasopressoragentangiotensinII.3 Evidently,criticalcoronavirusdisease2019(COVID-19)is thought to be due to a dysregulated immune response, causing a cytokine-release syndrome eventually leading to acute respiratory distress syndrome (ARDS).4 ,5 However, several reports on clinical laboratory features and case-descriptions of critically ill patients with COVID-19 show discrepancies compared to typical ARDS. Here, we show that infusing swines with angiotensin II induces a pathophysiological syndrome closely resembling that of patients with RT-PCR-positive COVID-19. By using multimodal clinical imaging of patients, comparing laboratory data and translational histological features, we show that it is highly likely that an increase in RAAS is one, if not the main, pathogenic feature in critical COVID-19. Furthermore, it is plausible that this large animal model can be used to screen for potential new treatments for patients with severe COVID-19 and that MRI lung perfusion can be used to evaluate the outcome of potential treatments targeting the pathophysiological syndrome.
Overview
The claims and statistics of this paper haven’t been checked yet.
Run the check — free, no account needed. It reads the open-access text and checks the sources it cites.
Integrity signals
Registry
Cites
Statistics
Figures
Verification
Claims the paper makes
The claims and statistics of this paper haven’t been checked yet.
Run the check — free, no account needed. It reads the open-access text and checks the sources it cites.
Claims other papers make about this one
Each is checked against this paper’s own text: does it say what the citing paper says it does?
In the citing paper
“Increased levels of Ang-II and reduced production of Ang-1-7 due to the lower ACE2 activity could provoke multiple COVID-19 symptoms, including vasoconstriction, thrombosis, inflammation, and potentially fatal respiratory failure.14,18, 19, 20, 21”
Self-check
Percentages, sums and reported differences re-computed from the paper’s own numbers.
The self-check needs the paper’s full text.
Citations
Cites
Clinical features of patients infected with 2019 novel coronavirus in Wuhan, China
Huang, C., Wang, Y., Li, X., Ren, L., Zhao, J., Hu, Y., Zhang, L., Fan, G., Xu, J., Gu, X., et al. (2020) · The Lancet · doi:10.1016/s0140-6736(20)30183-5 · Cited by 48,884
Chen, Y., Wang, L., Kang, Q., Zhang, X., Yu, G., Wan, X., Wang, J., & Zhu, K. (2017) · Cellular Physiology and Biochemistry · doi:10.1159/000477308 · Cited by 10,730
COVID-19: consider cytokine storm syndromes and immunosuppression
Mehta, P., McAuley, D. F., Brown, M., Sanchez, E., Tattersall, R. S., & Manson, J. J. (2020) · The Lancet · doi:10.1016/s0140-6736(20)30628-0 · Cited by 9,664
Acute Respiratory Distress Syndrome
Ards Definition Task Force (2012) · JAMA · doi:10.1001/jama.2012.5669 · Cited by 9,066
Endothelial cell infection and endotheliitis in COVID-19
Varga, Z., Flammer, A. J., Steiger, P., Haberecker, M., Andermatt, R., Zinkernagel, A. S., Mehra, M. R., Schuepbach, R. A., Ruschitzka, F., & Moch, H. (2020) · The Lancet · doi:10.1016/s0140-6736(20)30937-5 · Cited by 6,358
Pulmonary Vascular Endothelialitis, Thrombosis, and Angiogenesis in Covid-19
Ackermann, M., Verleden, S. E., Kuehnel, M., Haverich, A., Welte, T., Laenger, F., Vanstapel, A., Werlein, C., Stark, H., Tzankov, A., et al. (2020) · New England Journal of Medicine · doi:10.1056/nejmoa2015432 · Cited by 5,613
Incidence of thrombotic complications in critically ill ICU patients with COVID-19
Klok, F. A., Kruip, M. J. H. A., van der Meer, N. J. M., Arbous, M. S., Gommers, D. A. M. P. J., Kant, K. M., Kaptein, F. H. J., van Paassen, J., Stals, M. A. M., Huisman, M. V., et al. (2020) · Thrombosis Research · doi:10.1016/j.thromres.2020.04.013 · Cited by 5,028
Dysregulation of Immune Response in Patients With Coronavirus 2019 (COVID-19) in Wuhan, China
Qin, C., Zhou, L., Hu, Z., Zhang, S., Yang, S., Tao, Y., Xie, C., Ma, K., Shang, K., Wang, W., et al. (2020) · Clinical Infectious Diseases · doi:10.1093/cid/ciaa248 · Cited by 4,775
Structural basis of receptor recognition by SARS-CoV-2
Shang, J., Ye, G., Shi, K., Wan, Y., Luo, C., Aihara, H., Geng, Q., Auerbach, A., & Li, F. (2020) · Nature · doi:10.1038/s41586-020-2179-y · Cited by 3,661
A crucial role of angiotensin converting enzyme 2 (ACE2) in SARS coronavirus–induced lung injury
Kuba, K., Imai, Y., Rao, S., Gao, H., Guo, F., Guan, B., Huan, Y., Yang, P., Zhang, Y., Deng, W., et al. (2005) · Nature Medicine · doi:10.1038/nm1267 · Cited by 3,445
Cited by
Sorted by citations
Items 101–111 of 111
Application and mechanism of natural products and nutrient elements in COVID-19
Zhou, L., Tan, Y., Shi, L., Bai, W., & Li, X. (2024) · Journal of Functional Foods · doi:10.1016/j.jff.2024.106561
Shafique, R., Zahra, A., Butt, M. H., Khan, S. H., Ali, W. R., Arshad, M. I., & Shamim, A. (2025) · Journal of Biomolecular Structure and Dynamics · doi:10.1080/07391102.2025.2472170
Recent Advances in Fermented Functional Foods
Mohedano, M. L., Zarour, K., Diez‐Ozaeta, I., Dueñas, M. T., López, P., & Russo, P. (2025) · Royal Society of Chemistry eBooks · doi:10.1039/9781837673292-00030
Forsberg, F., Ruge, T., Larsson, A. O., Wändell, P. E., Carlsson, A. C., Nilsson, P. M., & Swärd, P. (2025) · Scientific Reports · doi:10.1038/s41598-025-96640-0
Chen, F., Chen, Y., Ke, Q., Wang, Y., Gong, Z., Chen, X., Cai, Y., Li, S., Sun, Y., Peng, X., et al. (2024) · Figshare · doi:10.6084/m9.figshare.26567585
Lange, T. T., Tuvia, N., Lazar, S. E., Farajh, Y., Bernstine, T., Abassi, Z. A., Edelstein, M., & Jabal, K. A. (2026) · BMC Infectious Diseases · doi:10.1186/s12879-026-12527-z
Pleguezuelos, E., Carmen, A. D., Sánchez-Nuño, S., Serra‐Payá, N., Moreno, E., Molina-Raya, L., Molina, C. J., Farrés, M. G., Castizo-Olier, J., Biurrún-Garrido, A., et al. (2026) · Frontiers in Nutrition · doi:10.3389/fnut.2026.1715783
Ariani, Y., Gunawan, I., Susanto, A. D., & Sutarto, R. (2026) · PLoS ONE · doi:10.1371/journal.pone.0344371
Immune context unmasks regulatory effects of Neanderthal and Denisovan introgressionPreprint
Li, Z., Kerner, G., Mendoza‐Revilla, J., Inoue, F., Fishilevich, S., Patin, É., Gokhman, D., Quintana‐Murci, L., & Rotival, M. (2026) · bioRxiv (Cold Spring Harbor Laboratory) · doi:10.64898/2026.05.29.727880
Mechanisms and impact of long COVID: pathophysiology, neuropsychiatric effects and vaccination
Ponnachan, P., Dhawlarker, A., Yasmin, H., Shah, A., Malhotra, A., Shastri, A., al-Ramadi, B. K., & Kishore, U. (2026) · Frontiers in Immunology · doi:10.3389/fimmu.2026.1710777 · Cited by 1
Solopov, P. A., Biancatelli, R. M. L. C., Sharlow, E. R., Lazo, J. S., & Catravas, J. D. (2026) · Frontiers in Pharmacology · doi:10.3389/fphar.2026.1862783
Metadata
- Authors
- Rysz, S., Al-Saadi, J., Sjöström, A., Farm, M., Campoccia Jalde, F., Plattén, M., Eriksson, H., Klein, M., Vargas-Paris, R., Nyrén, S., Abdula, G., Ouellette, R., Granberg, T., Jonsson Fagerlund, M., & Lundberg, J.
- Affiliations
- Karolinska University Hospital (SE)
- Corresponding author
- Lundberg, Johan
- ORCID
- Venue
- Nature Communications
- Published
- 2021-04-23
- Volume
- 12
- Issue
- 1
- Pages
- 2417-2417
- ISSN
- 2041-1723 (ISSN-L)
- PMC
- PMC8065208
- OpenAlex
- W3152933878
- Cited by
- 111
- References
- 57
- Citations by year
- 2026: 9 · 2025: 9 · 2024: 17 · 2023: 26 · 2022: 30 · 2021: 17
- FWCI
- 7.12
- Type
- journal article
- Language
- en
- Open access
- gold
- doi.org
- Locations
- Nature Communications (publishedVersion, cc-by)
- Research Square (acceptedVersion, cc-by)
- PubMed Central (publishedVersion, cc-by)
- PubMed (publishedVersion)
- RePEc: Research Papers in Economics (submittedVersion)
- DOAJ (DOAJ: Directory of Open Access Journals) (submittedVersion, cc-by-sa)
- Funders
- Stockholm Region Clinical Post doc and ALF
- Stockholm Region Clinical Post Doc, Tedde Jeansson Sr and, MedTechLabs.
- Topics
- Health Sciences › Medicine › Infectious Diseases › COVID-19 Clinical Research Studies
- Health Sciences › Medicine › Cardiology and Cardiovascular Medicine › Renin-Angiotensin System Studies
- Health Sciences › Medicine › Infectious Diseases › SARS-CoV-2 and COVID-19 Research
- Keywords
- COVID-19 pandemic, SARS-CoV-2, renin-angiotensin-aldosterone system, ACE2, angiotensin II, pulmonary embolism, pulmonary artery pressure, pulmonary blood flow, coagulation, acute tubular necrosis, diffuse alveolar damage, angiotensin receptor blockers, low molecular weight heparin, porcine model, pathophysiology
- MeSH terms
- Angiotensin-Converting Enzyme 2, COVID-19, SARS-CoV-2, Angiotensin II, Animals, Female, Humans, Lung, Magnetic Resonance Imaging, Protein Binding, Renin-Angiotensin System, Retrospective Studies, Swine, Virus Internalization, Angiotensin Receptor Antagonists, Spike Glycoprotein, Coronavirus
About these checks
Registry, retraction, Cites and statistics results are computed, not judged, with one exception: a printed reference that no index lists is read once by a model before it counts as a citation error. Claims are extracted by a model and kept only when their quote appears verbatim in the text; each cited source is then checked, with a model’s help, for whether it says what the claim relies on. Those verdicts can be wrong — read the claim’s quote and the cited source before relying on one.
Statistics and arithmetic are recomputed, not judged.
Confidence bands are shown only for fields calibrated on our annotated test set. None is calibrated yet, so no band is shown.
What counts as a claim ›How we measure confidence ›How we check this ›
Are you an author, or do you see a problem with this page? Request a review
