

The DOI matches its Crossref record; 75 of the 75 references it cites were found in a registry or an index.
ICAM1 initiates CTC cluster formation and trans-endothelial migration in lung metastasis of breast cancer
Open accessAbstract
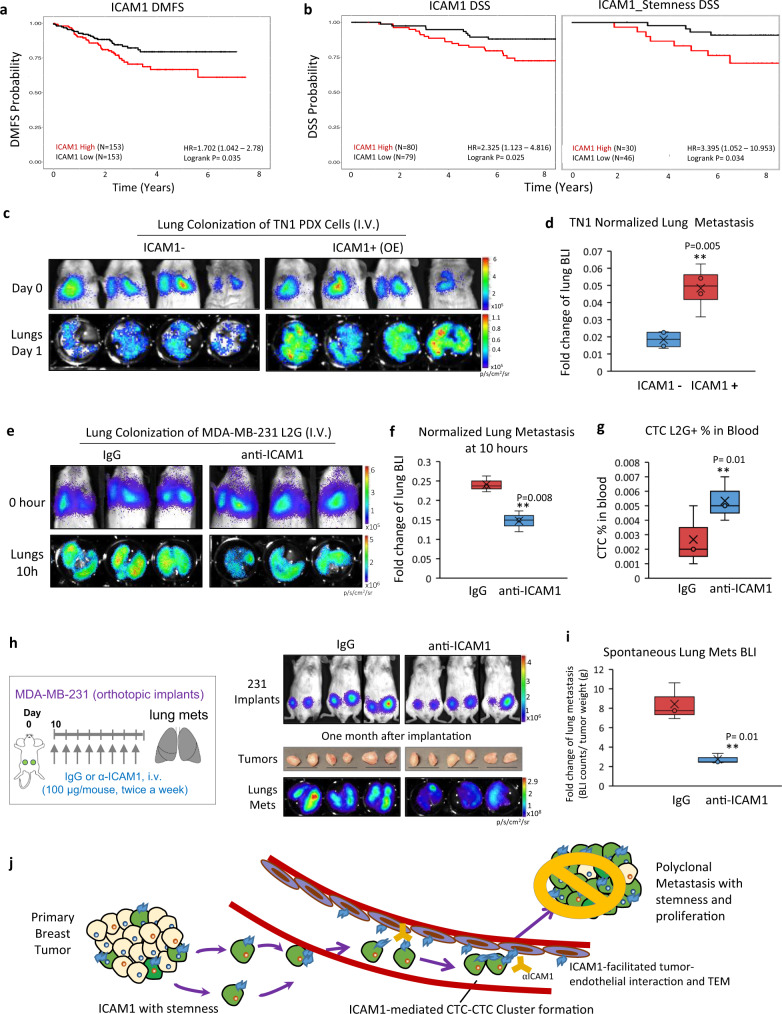
Circulating tumor cell (CTC) clusters mediate metastasis at a higher efficiency and are associated with lower overall survival in breast cancer compared to single cells. Combining single-cell RNA sequencing and protein analyses, here we report the profiles of primary tumor cells and lung metastases of triple-negative breast cancer (TNBC). ICAM1 expression increases by 200-fold in the lung metastases of three TNBC patient-derived xenografts (PDXs). Depletion of ICAM1 abrogates lung colonization of TNBC cells by inhibiting homotypic tumor cell-tumor cell cluster formation. Machine learning-based algorithms and mutagenesis analyses identify ICAM1 regions responsible for homophilic ICAM1-ICAM1 interactions, thereby directing homotypic tumor cell clustering, as well as heterotypic tumor-endothelial adhesion for trans-endothelial migration. Moreover, ICAM1 promotes metastasis by activating cellular pathways related to cell cycle and stemness. Finally, blocking ICAM1 interactions significantly inhibits CTC cluster formation, tumor cell transendothelial migration, and lung metastasis. Therefore, ICAM1 can serve as a novel therapeutic target for metastasis initiation of TNBC.
Overview
The claims and statistics of this paper haven’t been checked yet.
Run the check — free, no account needed. It reads the open-access text and checks the sources it cites.
Integrity signals
Registry
Cites
Statistics
Figures
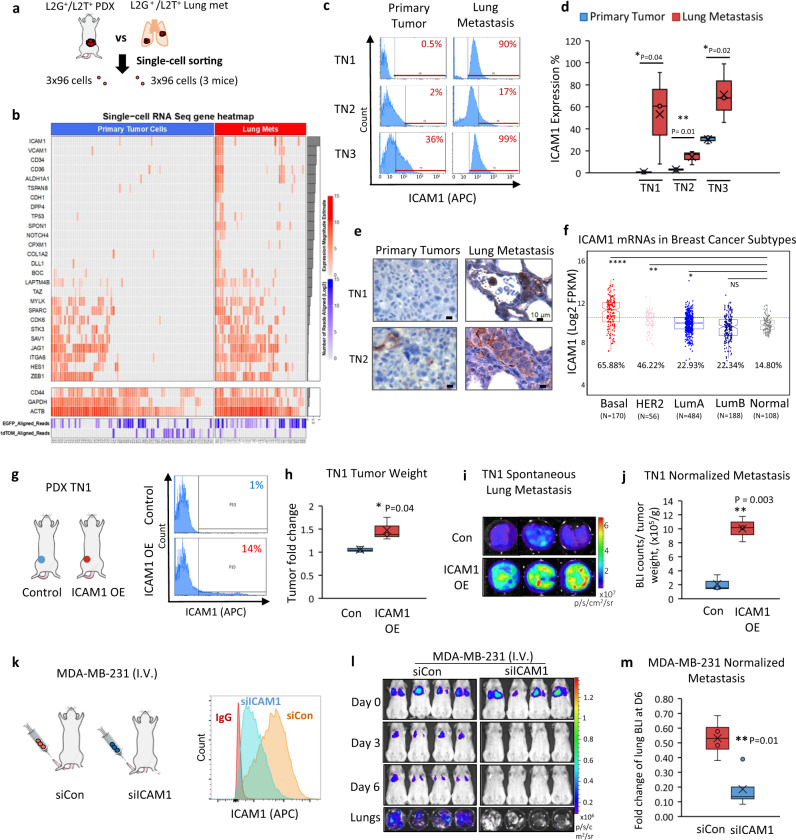
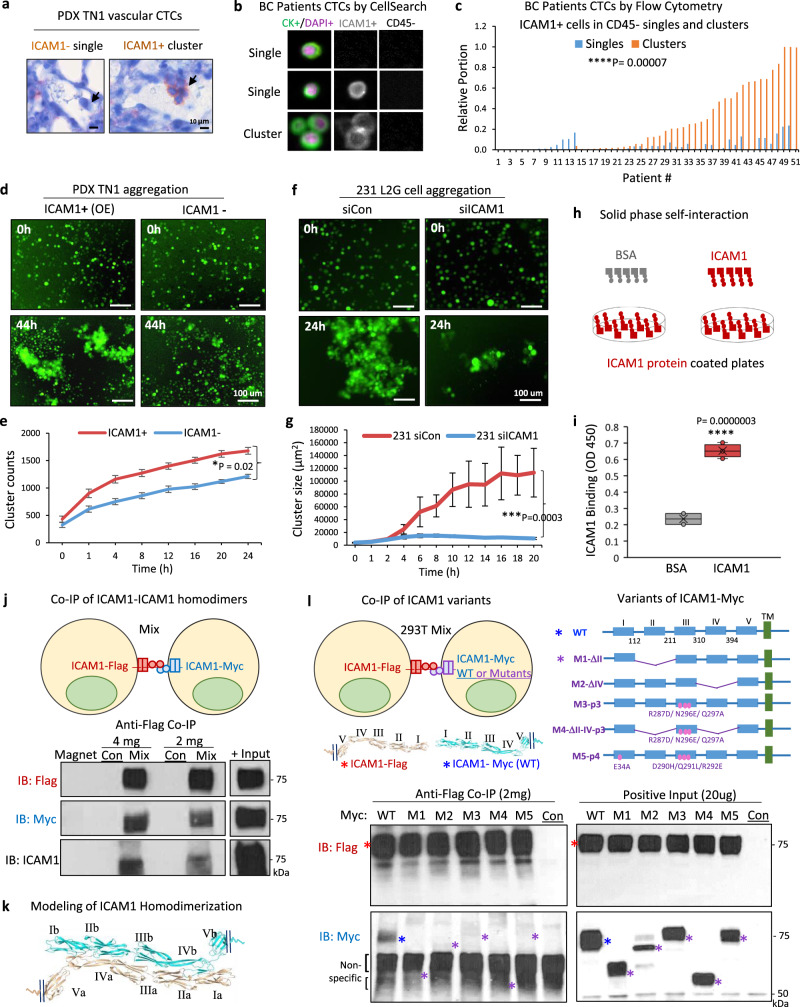
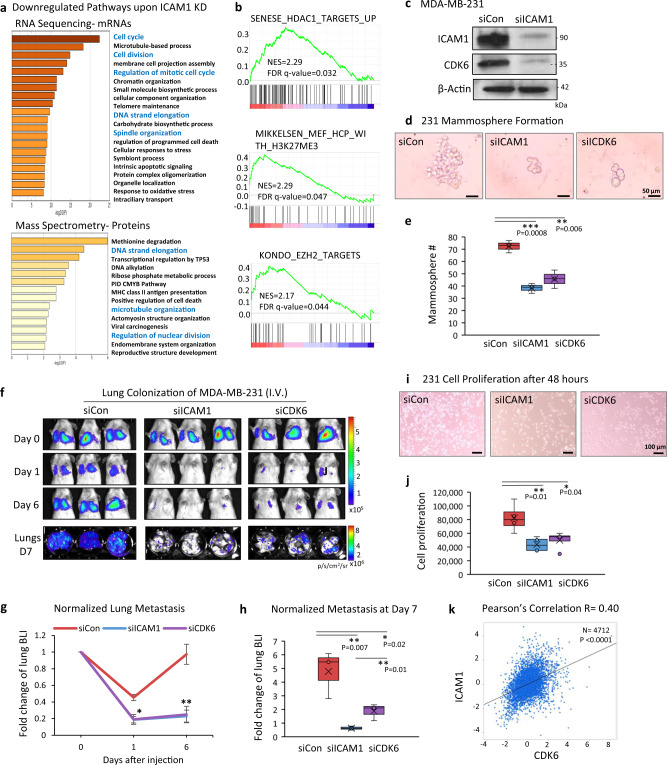
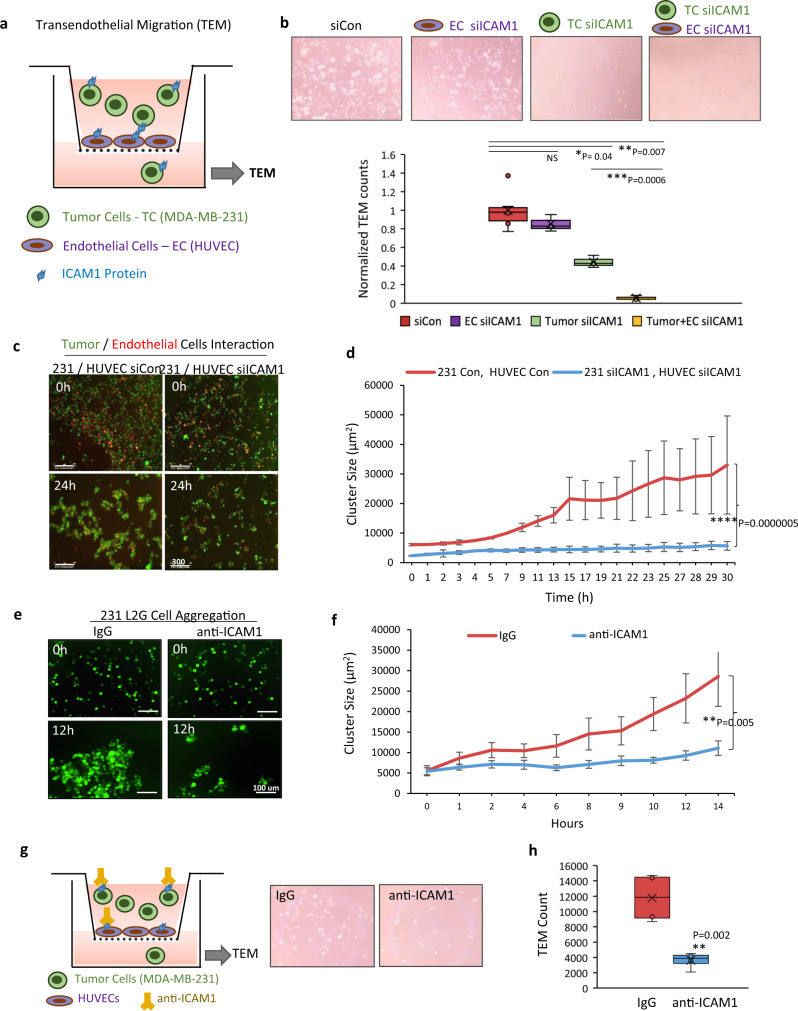
Verification
Claims the paper makes
The claims and statistics of this paper haven’t been checked yet.
Run the check — free, no account needed. It reads the open-access text and checks the sources it cites.
Self-check
Percentages, sums and reported differences re-computed from the paper’s own numbers.
The self-check needs the paper’s full text.
Citations
Cites
Moderated estimation of fold change and dispersion for RNA-seq data with DESeq2
Love, M. I., Huber, W., & Anders, S. (2014) · Genome Biology · doi:10.1186/s13059-014-0550-8 · Cited by 95,106
Subramanian, A., Tamayo, P., Mootha, V. K., Mukherjee, S., Ebert, B. L., Gillette, M. A., Paulovich, A., Pomeroy, S. L., Golub, T. R., Lander, E. S., et al. (2005) · Proceedings of the National Academy of Sciences · doi:10.1073/pnas.0506580102 · Cited by 53,625
STAR: ultrafast universal RNA-seq aligner
Dobin, A., Davis, C. A., Schlesinger, F., Drenkow, J., Zaleski, C., Jha, S., Batut, P., Chaisson, M., & Gingeras, T. R. (2013) · Bioinformatics · doi:10.1093/bioinformatics/bts635 · Cited by 51,709
HTSeq—a Python framework to work with high-throughput sequencing data
Anders, S., Pyl, P. T., & Huber, W. (2015) · Bioinformatics · doi:10.1093/bioinformatics/btu638 · Cited by 21,464
Siegel, R. L., Miller, K. D., & Jemal, A. (2018) · CA A Cancer Journal for Clinicians · doi:10.3322/caac.21442 · Cited by 16,632
Molecular portraits of human breast tumours
Perou, C., Sørlie, T., Eisen, M., van de Rijn, M., Jeffrey, S., Rees, C. A., Pollack, J., Ross, D., Johnsen, H., Akslen, L., et al. (2000) · Nature · doi:10.1038/35021093 · Cited by 16,551
Tissue-based map of the human proteome
Uhlén, M., Fagerberg, L., Hallström, B. M., Lindskog, C., Oksvold, P., Mardinoglu, A., Sivertsson, Å., Kampf, C., Sjöstedt, E., Asplund, A., et al. (2015) · Science · doi:10.1126/science.1260419 · Cited by 15,286
Nishimura, R., Osako, T., Nishiyama, Y., Tashima, R., Nakano, M., Fujisue, M., Toyozumi, Y., & Arima, N. (2013) · Oncology · doi:10.1159/000353099 · Cited by 13,239
Sørlie, T., Perou, C. M., Tibshirani, R. J., Aas, T., Geisler, S. B., Johnsen, H., Hastie, T. J., Eisen, M. B., van de Rijn, M., Jeffrey, S. S., et al. (2001) · Proceedings of the National Academy of Sciences · doi:10.1073/pnas.191367098 · Cited by 11,506
Prospective identification of tumorigenic breast cancer cells
Al‐Hajj, M., Wicha, M. S., Benito‐Hernández, A., Morrison, S. J., & Clarke, M. F. (2003) · Proceedings of the National Academy of Sciences · doi:10.1073/pnas.0530291100 · Cited by 10,579
Cited by
Sorted by citations
Items 101–200 of 261
Next‐generation liquid biopsy instruments: Challenges and opportunities
Zhu, S., Fang, Y., Guo, K., Ni, Z., & Xiang, N. (2023) · Electrophoresis · doi:10.1002/elps.202200169 · Cited by 11
Suppression of Tumor Aggression Through Metabolic Reprogramming via Oxamate Targeting LDHA
Stepanov, Y. V., Solyanik, G. I., Yakshibaeva, Y., Kolesnik, D. L., Stepanova, L. I., & Golovynska, I. (2026) · International Journal of Molecular Sciences · doi:10.3390/ijms27073245 · Cited by 11
Dual implication of endothelial adhesion molecules in tumor progression and cancer immunity
Chriqui, L.-E., Cavin, S., & Perentes, J. Y. (2025) · Cell Adhesion & Migration · doi:10.1080/19336918.2025.2472308 · Cited by 11
Wu, M., Huang, Y., Zhou, Y., Zhao, H., Lan, Y., Yu, Z., Jia, C., Cong, H., & Zhao, J. (2022) · Small Methods · doi:10.1002/smtd.202200226 · Cited by 11
Basu, J., Madhulika, S., Murmu, K. C., Mohanty, S., Samal, P., Das, A., Mahapatra, S., Saha, S., Sinha, I., & Prasad, P. (2023) · Frontiers in Cell and Developmental Biology · doi:10.3389/fcell.2023.1060537 · Cited by 11
Modvig, S., Jeyakumar, J., Marquart, H. V., & Christensen, C. (2023) · Cancers · doi:10.3390/cancers15092504 · Cited by 14
ICAM-1-suPAR-CD11b Axis Is a Novel Therapeutic Target for Metastatic Triple-Negative Breast Cancer
Li, D., Hemati, H., Park, Y.-H., Taftaf, R., Zhang, Y., Liu, J., Cristofanilli, M., & Liu, X. (2023) · Cancers · doi:10.3390/cancers15102734 · Cited by 11
Self-citationNishimura, S., Nishida, K., Shiomoto, S., & Tanaka, M. (2022) · Materials Advances · doi:10.1039/d2ma00129b · Cited by 10
Lu, Z., Wang, T., Xu, X., Hu, Q., Wang, L., & Jin, Y. (2025) · Journal of Nanobiotechnology · doi:10.1186/s12951-025-03539-z · Cited by 10
Wang, Y., Qiu, W., Chen, J., Meng, W., Zhao, R., Lin, W., Mei, P., Diao, M., Han, X., & Liao, Y. (2023) · International Journal of Cancer · doi:10.1002/ijc.34563 · Cited by 10
Growth signaling autonomy in circulating tumor cells aids metastatic seeding
Sinha, S., Farfel, A. P., Luker, K. E., Parker, B. A., Yeung, K. T., Luker, G. D., & Ghosh, P. (2024) · PNAS Nexus · doi:10.1093/pnasnexus/pgae014 · Cited by 9
Molavand, M., Montazer, M., Ghareghomi, S., Yousefi, B., & Majidinia, M. (2025) · Expert Review of Anticancer Therapy · doi:10.1080/14737140.2025.2519860 · Cited by 11
Ward, M. P., Lewis, F., O’Gorman, C., Norris, L., Lochrin, S. E., Kane, L. E., Kelly, T. E., Mohamed, B. M., Ramesh, A., O’Connor, R., et al. (2025) · British Journal of Cancer · doi:10.1038/s41416-025-03227-7 · Cited by 9
Endothelial Pim3 kinase protects the vascular barrier during lung metastasis
Santio, N. M., Ganesh, K., Kaipainen, P. P., Halme, A., Seyednasrollah, F., Arbash, E., Hänninen, S., Kivelä, R., Carpen, O., & Saharinen, P. (2024) · Nature Communications · doi:10.1038/s41467-024-54445-1 · Cited by 9
Uong, T. N. T., Yoon, M., Chung, I., Nam, T., Ahn, S., Jeong, J., Song, J., Kim, Y.-H., Nguyen, H. P. Q., Cho, D., et al. (2023) · International Journal of Radiation Oncology*Biology*Physics · doi:10.1016/j.ijrobp.2023.11.023 · Cited by 8
Xu, Y., Hu, X., Yuan, Y., Liu, W., Wang, J., Yang, C., Shi, X., Qin, W., Wen, L., Lin, M., et al. (2025) · Advanced Science · doi:10.1002/advs.202508878 · Cited by 9
Preclinical models of breast cancer metastasis: strengths, limitations, and clinical relevance
Aouad, P., Halabi, K., Hayar, B., Sflomos, G., Brisken, C., Metcalfe, C., & Darwiche, N. (2026) · npj Breast Cancer · doi:10.1038/s41523-026-00928-x · Cited by 8
Quantitative imaging of vesicle–protein interactions reveals close cooperation among proteins
Cha, M., Jeong, S. H., Jung, J.-H., Baeg, Y., Park, S., Bae, S., Lim, C. S., Park, J. H., Lee, J., Gho, Y. S., et al. (2023) · Journal of Extracellular Vesicles · doi:10.1002/jev2.12322 · Cited by 8
New advances in circulating tumor cell‑mediated metastasis of breast cancer (Review)
Zhou, J.-S., Liu, Z., Chen, Y., Liu, Y., Shen, H., Hou, L.-J., & Ding, Y. (2023) · Molecular and Clinical Oncology · doi:10.3892/mco.2023.2667 · Cited by 8
Role of ICAM-1 in triple-negative breast cancer
Zhang, Y., Fan, J., Wang, X., Wu, Z., Ma, W., & Ma, B. (2024) · Open Medicine · doi:10.1515/med-2024-0969 · Cited by 8
Self-citationLiang, F., You, Q., Wang, H., Liu, J., Yang, Q., Lu, D., Ma, X., Wang, C., He, Z., Yang, Y., et al. (2024) · Advanced Functional Materials · doi:10.1002/adfm.202408006 · Cited by 8
Ma, R., Zheng, Y., Wang, J., Xu, H., Zhang, R., Xie, Z., Zhang, L., & Zhao, R. (2024) · Frontiers in Oncology · doi:10.3389/fonc.2024.1387860 · Cited by 8
Analysis of diagnostic value of CTC and CTDNA in early lung cancer
Yao, H., Wen, L., Li, Z., & Xia, C. (2023) · Cellular and Molecular Biology · doi:10.14715/cmb/2023.69.6.9 · Cited by 8
Zhou, S., Li, W., Zhao, D., Zhang, Q., Liu, H., Jin, T., & Pan, Y. (2024) · Journal of Pharmaceutical Analysis · doi:10.1016/j.jpha.2024.101100 · Cited by 7
Self-citationCancer treatments as paradoxical catalysts of tumor awakening in the lung
Nicolas, É., Kośmider, B., Cukierman, E., Borghaei, H., Golemis, E. A., & Borriello, L. (2024) · Cancer and Metastasis Reviews · doi:10.1007/s10555-024-10196-5 · Cited by 7
Models to study CTCs and CTC culture methods
Fernández-Santiago, C., López‐López, R., & Piñeiro, R. (2023) · International review of cytology · doi:10.1016/bs.ircmb.2023.07.007 · Cited by 8
CTC-5: A novel digital pathology approach to characterise circulating tumour cell biodiversity
Ffrench, B., Kashdan, E., Huang, Y., Spillane, C. D., Cocchiglia, S., Charmsaz, S., Varešlija, D., O’Brien, C. P., Scholz, D., Martin, C. M., et al. (2023) · Heliyon · doi:10.1016/j.heliyon.2023.e13044 · Cited by 7
Recent advances in photothermal nanomaterials-mediated detection of circulating tumor cells
Ouyang, R., Geng, C., Li, J., Jiang, Q., Shen, H., Zhang, Y., Liu, X., Liu, B., Wu, J., & Miao, Y. (2024) · RSC Advances · doi:10.1039/d4ra00548a · Cited by 6
Self-citationICAM1 (CD54) Contributes to the Metastatic Capacity of Gastric Cancer Stem Cells
Tinajero-Rodríguez, J. M., Ramírez-Vidal, L., Becerril-Rico, J., Alvarado-Ortiz, E., Romero‐Rodríguez, D. P., López‐Casillas, F., Hernández‐Sotelo, D., Fernández‐Ramírez, F., Contreras‐Paredes, A., & Ortíz-Sánchez, E. (2024) · International Journal of Molecular Sciences · doi:10.3390/ijms25168865 · Cited by 6
2D Nano‐Photosensitizer Facilitates Proximity Labeling for Living Cells Surfaceome Deciphering
Jiang, Q., Wang, H., Yang, K., Zhao, B., Zhen, L., Yukui, Z., Jiang, B., & Zhang, L. (2024) · Small · doi:10.1002/smll.202407240 · Cited by 6
A growing entourage for heterotypic circulating tumor cell clusters
Gvozdenovic, A., & Aceto, N. (2025) · Trends in cancer · doi:10.1016/j.trecan.2025.10.006 · Cited by 6
The covert symphony: cellular and molecular accomplices in breast cancer metastasis
Si, H., Esquivel, M., Mendoza, E. M., & Roarty, K. P. (2023) · Frontiers in Cell and Developmental Biology · doi:10.3389/fcell.2023.1221784 · Cited by 6
Circulating tumor cells in pancreatic cancer: more than liquid biopsy
Li, Z., Qin, C. Y., Zhao, B., Li, T., Zhao, Y., Zhang, X., & Wang, W. (2024) · Therapeutic Advances in Medical Oncology · doi:10.1177/17588359241284935 · Cited by 7
Xu, J., Pu, J., Chen, H., Sun, L., Fei, S., Han, Z., Tao, J., Ju, X., Wang, Z., Tan, R., et al. (2025) · Renal Failure · doi:10.1080/0886022x.2025.2458749 · Cited by 6
Liu, X., Mi, S., Li, W., Zhang, J., Augustino, S. M. A., Zhang, Z., Zhang, R., Xiao, W., & Yu, Y. (2023) · BMC Genomics · doi:10.1186/s12864-023-09466-3 · Cited by 6
Self-citationChen, S., Zhang, S., Shi, Y. K., & Liu, X. (2025) · Chinese Medical Journal · doi:10.1097/cm9.0000000000003738 · Cited by 5
Self-citationReceptors and Host Factors for Enterovirus Infection: Implications for Cancer Therapy
Alekseeva, O. N., Hoa, L. T. K., Vorobyev, P. O., Кочетков, Д. В., Gumennaya, Y. D., Naberezhnaya, E. R., Chuvashov, D. O., Ivanov, A. V., Chumakov, P. M., & Lipatova, A. V. (2024) · Cancers · doi:10.3390/cancers16183139 · Cited by 5
Premetastatic niche mechanics and organotropism in breast cancer
Libring, S., & Reinhart‐King, C. A. (2025) · npj Biological Physics and Mechanics. · doi:10.1038/s44341-025-00015-5 · Cited by 5
Beninato, T., Russo, G. L., Leporati, R., Roz, L., & Bertolini, G. (2024) · International review of cytology · doi:10.1016/bs.ircmb.2024.03.001 · Cited by 4
Zhai, C., Xie, X., Li, X., Fan, W., Tang, S., Shi, Z., Jin, K., Cai, K., & Zhang, J. (2025) · Nano Research · doi:10.26599/nr.2025.94907753 · Cited by 4
Kwon, D., Park, H. W., Min, B. S., & Choi, J. (2025) · Scientific Reports · doi:10.1038/s41598-025-13309-4 · Cited by 4
Tang, R., Sun, Y., Deng, A., Liu, J., Dai, P., Chen, J., Deng, C., Liu, H., Hai, Y., Tong, Y., et al. (2025) · 癌症:英文版 · doi:10.1002/cac2.70072 · Cited by 4
Self-citationCirculating tumor cells: Biological features and survival mechanisms
LI, X., ZHENG, J., ZHU, J., Huang, X., ZHU, H., & Chen, B. (2023) · Biocell · doi:10.32604/biocell.2023.028343 · Cited by 4
Fang, Z., Bunston, C., Xu, Y., Ruge, F., Sui, L., Liu, M., Al-Sarireh, B., Griffiths, P., Murphy, K., Pugh, M., et al. (2024) · Cancers · doi:10.3390/cancers16162893 · Cited by 4
Feng, H., Ju, Y., Yin, X., Qiu, W., & Zhang, X. (2024) · Briefings in Functional Genomics · doi:10.1093/bfgp/elae048 · Cited by 4
Molecular mechanisms and signaling pathways related to brain metastasis in breast cancer
Liang, Z., Mo, Y., Zhang, Y., Yu, Y. P., & Ji, Y. (2025) · Frontiers in Pharmacology · doi:10.3389/fphar.2025.1585668 · Cited by 4
Self-citationZou, J., Chen, Q., He, Y. Z., Pan, Y., Zhao, H., Shi, J., Wei, Z., Yu, S., Zhao, Y. W., Han, X., et al. (2024) · BMC Cancer · doi:10.1186/s12885-024-12214-9 · Cited by 4
Singh, A., Liu, H., & El-Shennawy, L. (2024) · International review of cytology · doi:10.1016/bs.ircmb.2024.03.009 · Cited by 4
Self-citationImpact of Polypyridyl Ru Complexes on Angiogenesis—Contribution to Their Antimetastatic Activity
Gurgul, I., Mazuryk, O., Stachyra, K., Olszanecki, R., Lekka, M., Łomzik, M., Suzenet, F., Gros, P. C., & Brindell, M. (2022) · International Journal of Molecular Sciences · doi:10.3390/ijms23147708 · Cited by 4
Hu, P., Xu, L., Liu, Y., Zhang, X., Li, Z., Li, Y., & Qiu, H. (2023) · Frontiers in Immunology · doi:10.3389/fimmu.2023.1187108 · Cited by 5
Kojima, M., & Hiyama, E. (2023) · Anticancer Research · doi:10.21873/anticanres.16627 · Cited by 4
Zheng, Q., Lu, C., Lian, Y., Zhan, Y., & Chen, Z. (2024) · Heliyon · doi:10.1016/j.heliyon.2024.e27473 · Cited by 4
Two-color diffuse in vivo flow cytometer
Strawbridge, R. R., Davis, S. C., & Niedre, M. J. (2024) · Journal of Biomedical Optics · doi:10.1117/1.jbo.29.6.065003 · Cited by 4
Dietrich, N., Castellanos-Martínez, R., Kemmling, J., Heuser, A., Michael Schnoor, A., Schinner, C., & Spindler, V. (2024) · Scientific Reports · doi:10.1038/s41598-024-68493-6 · Cited by 4
Schuster, E. J., Dashzeveg, N. K., Jia, Y., Golam, K., Zhang, T., Hoffman, A., Zhang, Y., Zheng, C., Ramos, E. K., Taftaf, R., et al. (2023) · bioRxiv (Cold Spring Harbor Laboratory) · doi:10.1101/2023.04.10.536233 · Cited by 4
Self-citationJi, J., Zeng, P., Yang, J., Deng, F., Wang, F., Xiong, Y., Li, H., Chen, X., Mao, C., & Zhang, P. (2025) · Chemical Engineering Journal · doi:10.1016/j.cej.2025.170982 · Cited by 3
Zou, J., Shi, J., Chen, Q., Zhu, Z., Hu, T., Zhang, Z., Pan, Z., Xu, F., Zhu, Y., Wu, Y., et al. (2025) · Experimental & Molecular Medicine · doi:10.1038/s12276-025-01598-8 · Cited by 3
Circulating Tumor Cells for the Monitoring of Lung Cancer Therapies
Chrzempiec, M., & Oleksiewicz, U. (2025) · International Journal of Molecular Sciences · doi:10.3390/ijms27010384 · Cited by 3
ICAM1 mRNA entraps ILF2/ILF3 to inhibit transcription of EIF4E and global protein synthesis
Jiang, S., Sun, J., Gao, Y., Zhang, H., He, Y., Zhang, Y., Xu, Z., Cheng, S., Yan, H., Duan, L., et al. (2026) · Molecular Cell · doi:10.1016/j.molcel.2025.12.017 · Cited by 3
Self-citationGlucose deprivation drives LIF-dependent lung cancer
Luciano‐Mateo, F., Moreno‐Càceres, J., Hernández-Madrigal, M., Püschel, F., Collado-Rodríguez, L., Favaro, F., Hijazo‐Pechero, S., Cruz‐Rodríguez, M., Jiménez-Hernández, F., Villagrasa-Araya, V., et al. (2026) · Nature Metabolism · doi:10.1038/s42255-025-01437-0 · Cited by 3
Application and Prospect of Single-Cell Sequencing in Cancer Metastasis
Zheng, Y., & Yang, X. (2022) · Future Oncology · doi:10.2217/fon-2022-0156 · Cited by 3
Liquid Biopsies: Flowing Biomarkers
Hyenne, V., Goetz, J. G., & Osmani, N. (2022) · Advances in experimental medicine and biology · doi:10.1007/978-3-031-04039-9_14 · Cited by 3
Hassanin, A. A. I., & Ramos, K. S. (2024) · International Journal of Molecular Sciences · doi:10.3390/ijms251910674 · Cited by 2
Chen, M., Zhou, Y., Fu, Z., & Wu, C. (2024) · Acta Biochimica et Biophysica Sinica · doi:10.3724/abbs.2024237 · Cited by 2
Bisht, D., Kumar, V., Gupta, S., & Sachan, M. (2025) · Biochimica et Biophysica Acta (BBA) - Reviews on Cancer · doi:10.1016/j.bbcan.2025.189384 · Cited by 2
Heterogeneity Landscape of Circulating Tumor Cells in Clinical Utility
Alam, M. K., Yanjun, L., Khoo, B. L., Si, T., Zou, H., & Yang, M. (2025) · Advanced Therapeutics · doi:10.1002/adtp.202400438 · Cited by 3
Detection and indications of circulating tumor cells in hepatocellular carcinoma
Liu, L., Qu, L., Wu, X., Wang, Z., He, S., Liu, Z., Zhang, T., Wang, J., Zhao, S., & Lin, J. (2025) · Analytical Methods · doi:10.1039/d5ay01320h · Cited by 2
Li, M., Xie, W., Hu, K., Li, T., Li, X., Shun, L., Xu, X., Chen, J., & Xu, H. (2025) · Oncogene · doi:10.1038/s41388-025-03621-8 · Cited by 2
Fan, M., Gao, X., Lin, J., Chen, W., Han, Z., Xiao, H., Zhou, C., Dong, Q., Liu, S., Tan, W., et al. (2025) · Journal of Translational Medicine · doi:10.1186/s12967-025-07515-x · Cited by 2
Wang, X., Zhou, Q., Wang, P., Bao, S., Wei, X., Zhao, X., Hou, R., Li, S., Guan, Z., Ma, W., et al. (2025) · Breast Cancer Research · doi:10.1186/s13058-025-02193-5 · Cited by 2
Wang, L., Wang, H.-H., Doan, D. T. T., Lin, Y.-F., Liao, C., Hsu, P., Chang, C.-C., Yen, M.-L., Liu, K., Sytwu, H.-K., et al. (2026) · Biomaterials · doi:10.1016/j.biomaterials.2026.123998 · Cited by 2
Is cancer the result of uncontrolled cellular growth? a glance into the tumorigenic process
Castro‐Oropeza, R., Chávez‐González, A., Mantilla, A., Tachiquín, M. E. R., Mayani, H., & Piña-Sánchez, P. (2026) · Cancer Cell International · doi:10.1186/s12935-026-04253-y · Cited by 3
Chen, S., Zhu, S., PANG, S., Shi, H., Li, S., Liu, T., Li, M., Li, M., Guo, R., & He, Q. (2026) · Journal of Controlled Release · doi:10.1016/j.jconrel.2026.114876 · Cited by 2
Guo, Q., Satthawiwat, N., Sano, A., Meroueh, C., Hamdi, A., 戴新, Warasnhe, K., Washington, A. M., Starlinger, P. P., Krivonos, A., et al. (2026) · Hepatology · doi:10.1097/hep.0000000000001742 · Cited by 2
Chalwe, J. M., Grobler, C. J., & Oldewage-Theron, W. H. (2022) · IntechOpen eBooks · doi:10.5772/intechopen.100486 · Cited by 2
Li, M., Zhang, R., Huang, X., Jian, M., Qi, H., Chen, X., Deng, J., Chen, W., Feng, C., Dong, Q., et al. (2025) · Analytica Chimica Acta · doi:10.1016/j.aca.2025.343871 · Cited by 2
He, P., Liu, Z., Qi, J., Shan, J., & Sheng, J. (2023) · Cancer Biomarkers · doi:10.3233/cbm-230143 · Cited by 2
Decoding Metastasis: From Cell Death to Fusion in Cancer Progression
Кайгородова, Е. В., Kozik, A. V., & Grishchenko, M. Y. (2024) · Current Cancer Drug Targets · doi:10.2174/0115680096308596240620055942 · Cited by 2
Scholten, D., El-Shennawy, L., Jia, Y., Zhang, Y., Hyun, E., Reduzzi, C., Hoffmann, A. D., Almubarak, H. F., Tong, F., Dashzeveg, N. K., et al. (2025) · bioRxiv (Cold Spring Harbor Laboratory) · doi:10.1101/2025.04.01.646421 · Cited by 2
Self-citationXu, S., Chen, C., Liu, H., Jiang, S., Li, Z., & Wu, Y. (2025) · Molecular Carcinogenesis · doi:10.1002/mc.70007 · Cited by 1
Self-citationCirculating tumour cells for the prediction of the response to radiation therapy in prostate cancer
Landry, C., Klusa, D., Cochonneau, D., Supiot, S., & Heymann, D. (2025) · British Journal of Radiology · doi:10.1093/bjr/tqaf224 · Cited by 1
Song, N., Xi, X., Zhang, K., Li, Z., Kuan, Y., & Pei, C. (2025) · Journal of Translational Medicine · doi:10.1186/s12967-025-07338-w · Cited by 1
Li, X., Gao, X., Guo, D., Shen, J., Li, S., Wang, N., Wen, X., Liang, J.-Y., Wang, H.-J., & Wang, Z. Z. (2025) · Journal of Translational Medicine · doi:10.1186/s12967-025-07578-w · Cited by 1
Targeting the Akt–EphA2 axis and cell–cell adhesion enhances anoikis sensitivity in cancer cells
Vivante, A. G., Dwivedi, N., Sheetz, M. P., & Nir, G. (2026) · Scientific Reports · doi:10.1038/s41598-026-37327-y · Cited by 3
Suppressing Cell Migration through Discoidal Bottlebrush Copolymer Nanocarriers
Zeng, P., Zeng, H., Baek, J., Yoo, B., Kim, B., & Müllner, M. (2026) · JACS Au · doi:10.1021/jacsau.6c00206 · Cited by 1
Wang, X.-Z., Jiang, J.-X., Li, Y., Liu, Y., Ye, S., Liu, W., Chi, D., He, S., Wei, P.-P., Huang, H.-Q., et al. (2026) · Cell Death and Differentiation · doi:10.1038/s41418-026-01719-4 · Cited by 1
The vascular niche: an orchestrator of the spatiotemporal dynamics of distant metastasis
Miao, Q., Chen, R., Zhang, D.-M., Zhang, J.-Q., & Chen, M.-F. (2026) · Acta Pharmacologica Sinica · doi:10.1038/s41401-026-01820-x · Cited by 1
Wu, S.-D., Wang, X., Yan-meng, Z., Hu, B., Wang, K., Yan, C.-J., Zhu, H.-Y., Li, H., Wang, X.-C., Wang, H., et al. (2026) · Metabolism · doi:10.1016/j.metabol.2026.156712 · Cited by 1
Chen, Y., Ouyang, W., Lv, H., & Chen, W. (2025) · Ecotoxicology and Environmental Safety · doi:10.1016/j.ecoenv.2024.117660 · Cited by 1
Circulation tumor cell isolation and enrichment technologies
Zhang, Y., Scholten, D., Qiang, W., Platanias, L. C., Gradishar, W. J., Kelley, S. O., & Liu, H. (2025) · International review of cytology · doi:10.1016/bs.ircmb.2025.01.009 · Cited by 2
Self-citationLiu, X., Li, D., Hemati, H., Park, Y.-H., Taftaf, R., Zhang, Y., Liu, J., & Cristofanilli, M. (2022) · Research Square · doi:10.21203/rs.3.rs-2076549/v1 · Cited by 1
Self-citationA spatial multi-omic portrait of survival outcome for clear cell renal cell carcinomaPreprint
Meyer, L., Engler, S., Lutz, M., Schraml, P., Rutishauser, D., Bertolini, A., Lienhard, M., Beisel, C., Singer, F., de Souza, N., et al. (2026) · medRxiv · doi:10.64898/2026.03.02.26347390 · Cited by 1
Guo, H., & Wang, M. (2022) · Research Square · doi:10.21203/rs.3.rs-1606037/v1
The Effects of Angiotensin-Converting Enzyme Inhibitors on Metastasis-Associated Myeloid Cells
Vallejo-Ardila, D. L., Parra-Medina, R. S., Cómbita, A. L., Cardona, A. F., & Paquet‐Fifield, S. (2022) · Interdisciplinary cancer research · doi:10.1007/16833_2022_91
Data from Cell–Cell Interactions Drive Metastasis of Circulating Tumor Microemboli
Tao, J., Zhu, L., Yakoub, M., Reißfelder, C., Loges, S., & Schölch, S. (2023) · doi:10.1158/0008-5472.c.6514137.v1
Międzybrodzka, A., Kawczyk‐Krupka, A., Aebisher, D., Cieślar, G., & Czuba, Z. P. (2023) · European Journal of Clinical and Experimental Medicine · doi:10.15584/ejcem.2023.2.2
Distal Onco-sphere: Cluster Metastasis
Saw, P. E., & Song, E. (2023) · Springer eBooks · doi:10.1007/978-981-99-1183-7_15
Chen, W., Zou, J., Chen, Q., Pan, Y., He, Y., Zhao, H. Q., Yang, G., Wei, Z., Yu, S., Zhao, Y., et al. (2023) · Research Square · doi:10.21203/rs.3.rs-3178689/v1
Dashzeveg, N. K., Jia, Y., Zhang, Y., Gerratana, L., Patel, P. A., Shajahan, A., Dandar, T., Ramos, E. K., Almubarak, H. F., Adorno-Cruz, V., et al. (2023) · doi:10.1158/2159-8290.c.6781914.v1
Self-citationDashzeveg, N. K., Jia, Y., Zhang, Y., Gerratana, L., Patel, P. A., Shajahan, A., Dandar, T., Ramos, E. K., Almubarak, H. F., Adorno-Cruz, V., et al. (2023) · doi:10.1158/2159-8290.c.6781914.v2
Self-citation
Metadata
- Authors
- Taftaf, R., Liu, X., Singh, S., Jia, Y., Dashzeveg, N. K., Hoffmann, A. D., El-Shennawy, L., Ramos, E. K., Adorno-Cruz, V., Schuster, E. J., Scholten, D., Patel, D., Zhang, Y., Davis, A. A., Reduzzi, C., Cao, Y., D’Amico, P., Shen, Y., Cristofanilli, M., Muller, W. A., Varadan, V., & Liu, H.
- Affiliations
- Northwestern University (US)
- Case Comprehensive Cancer Center (US)
- Texas A&M University System (US)
- Corresponding author
- Liu, Huiping
- ORCID
- Taftaf, Rokana
- Liu, Xia
- Singh, Salendra
- Jia, Yuzhi
- Dashzeveg, Nurmaa K.
- Hoffmann, Andrew D.
- El-Shennawy, Lamiaa
- Ramos, Erika K.
- Adorno-Cruz, Valery
- Schuster, Emma J.
- Scholten, David
- Patel, Dhwani
- Zhang, Youbin
- Davis, Andrew A.
- Reduzzi, Carolina
- D’Amico, Paolo
- Shen, Yang
- Cristofanilli, Massimo
- Muller, William A.
- Varadan, Vinay
- Liu, Huiping
- Venue
- Nature Communications
- Published
- 2021-08-11
- Volume
- 12
- Issue
- 1
- Pages
- 4867-4867
- ISSN
- 2041-1723 (ISSN-L)
- PMC
- PMC8358026
- OpenAlex
- W3189505974
- Cited by
- 261
- References
- 75
- Citations by year
- 2026: 42 · 2025: 54 · 2024: 57 · 2023: 67 · 2022: 38 · 2021: 3
- FWCI
- 15.10
- Type
- journal article
- Language
- en
- Open access
- gold
- doi.org
- Locations
- Nature Communications (publishedVersion, cc-by)
- PubMed Central (publishedVersion, cc-by)
- PubMed (publishedVersion)
- Digital Commons@Becker (Washington University School of Medicine) (submittedVersion, cc-by)
- RePEc: Research Papers in Economics (submittedVersion)
- DOAJ (DOAJ: Directory of Open Access Journals) (submittedVersion, cc-by-sa)
- Funders
- U.S. Department of Health & Human Services | National Institutes of Health (CA080621-15, R35GM124952)
- Susan G. Komen (CCR18548501)
- U.S. Department of Health & Human Services | NIH | National Cancer Institute (R01CA245699)
- U.S. Department of Health & Human Services | NIH | NCI | Division of Cancer Epidemiology and Genetics, National Cancer Institute (R00CA160638)
- Topics
- Health Sciences › Medicine › Oncology › Cancer Cells and Metastasis
- Health Sciences › Medicine › Immunology and Allergy › Cell Adhesion Molecules Research
- Life Sciences › Biochemistry, Genetics and Molecular Biology › Molecular Biology › Mechanisms of cancer metastasis
- Keywords
- ICAM-1, circulating tumor cell clusters, triple-negative breast cancer, lung metastasis, transendothelial migration, homotypic cell adhesion, metastasis initiation, therapeutic target, cell cycle, stemness, patient-derived xenografts
- MeSH terms
- Animals, Cell Aggregation, Cell Cycle, Cell Transformation, Neoplastic, Humans, Lung Neoplasms, Neoplastic Cells, Circulating, Biomarkers, Tumor, Signal Transduction, Intercellular Adhesion Molecule-1, Mice, Protein Interaction Domains and Motifs, Transendothelial and Transepithelial Migration, Triple Negative Breast Neoplasms
About these checks
Registry, retraction, Cites and statistics results are computed, not judged, with one exception: a printed reference that no index lists is read once by a model before it counts as a citation error. Claims are extracted by a model and kept only when their quote appears verbatim in the text; each cited source is then checked, with a model’s help, for whether it says what the claim relies on. Those verdicts can be wrong — read the claim’s quote and the cited source before relying on one.
Statistics and arithmetic are recomputed, not judged.
Confidence bands are shown only for fields calibrated on our annotated test set. None is calibrated yet, so no band is shown.
What counts as a claim ›How we measure confidence ›How we check this ›
Are you an author, or do you see a problem with this page? Request a review
