

The DOI matches its Crossref record; 84 of the 85 references it cites were found in a registry or an index.
The PEMDAC phase 2 study of pembrolizumab and entinostat in patients with metastatic uveal melanoma
Open accessAbstract
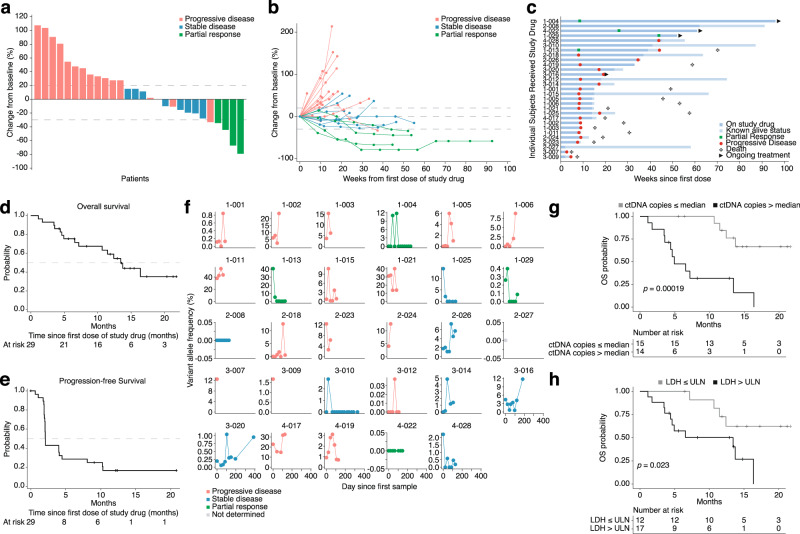
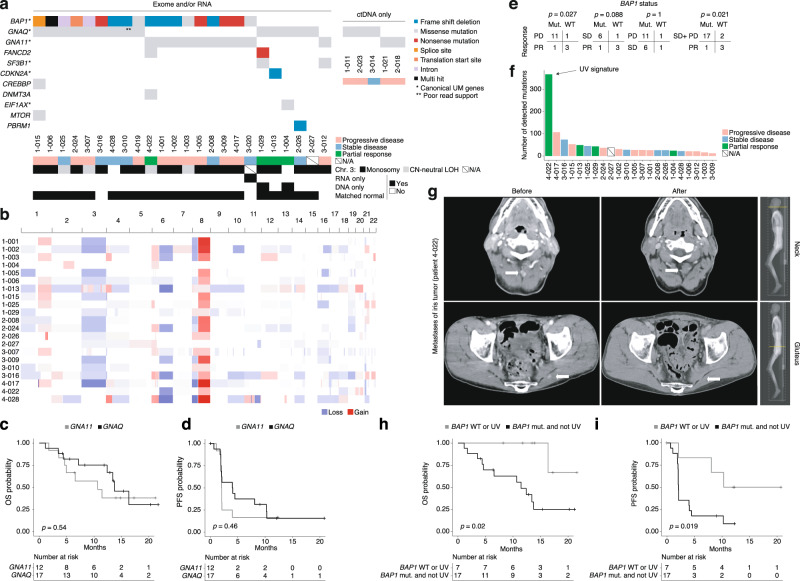
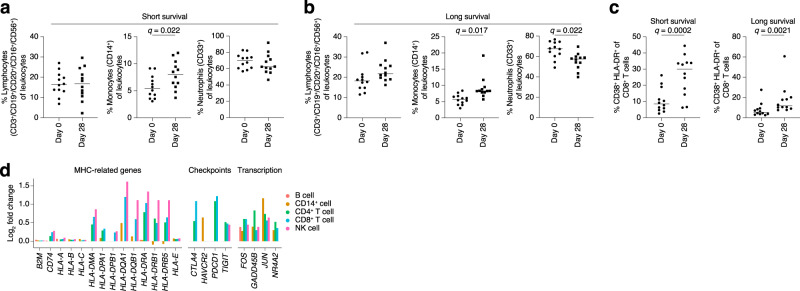
Preclinical studies have suggested that epigenetic therapy could enhance immunogenicity of cancer cells. We report the results of the PEMDAC phase 2 clinical trial ( n = 29; NCT02697630) where the HDAC inhibitor entinostat was combined with the PD-1 inhibitor pembrolizumab in patients with metastatic uveal melanoma (UM). The primary endpoint was objective response rate (ORR), and was met with an ORR of 14%. The clinical benefit rate at 18 weeks was 28%, median progression free survival was 2.1 months and the median overall survival was 13.4 months. Toxicities were manageable, and there were no treatment-related deaths. Objective responses and/or prolonged survival were seen in patients with BAP1 wildtype tumors, and in one patient with an iris melanoma that exhibited a UV signature. Longer survival also correlated with low baseline ctDNA levels or LDH. In conclusion, HDAC inhibition and anti-PD1 immunotherapy results in durable responses in a subset of patients with metastatic UM. Trial registration ClinicalTrials.gov registration number: NCT02697630 (registered 3 March 2016). EudraCT registration number: 2016–002114-50.
Overview
The claims and statistics of this paper haven’t been checked yet.
Run the check — free, no account needed. It reads the open-access text and checks the sources it cites.
Integrity signals
Registry
Cites
Statistics
Figures
Verification
Claims the paper makes
The claims and statistics of this paper haven’t been checked yet.
Run the check — free, no account needed. It reads the open-access text and checks the sources it cites.
Claims other papers make about this one
Each is checked against this paper’s own text: does it say what the citing paper says it does?
In the citing paper
“The preliminary results (NCT02697630) showed that entinostat plus pembrolizumab induced durable responses in some patients with metastatic uveal melanoma, and more entinostat-involved combination regimes such as entinostat plus avelumab (NCT02915523), nivolumab (NCT03838042), or M7824 (NCT04708470) are still in clinical evaluation [332].”
From Combination strategies with PD-1/PD-L1 blockade: current advances and future directions (2022) · cites this paper as [332]
Self-check
Percentages, sums and reported differences re-computed from the paper’s own numbers.
The self-check needs the paper’s full text.
Citations
Cites
The Sequence Alignment/Map format and SAMtools
Li, H., Handsaker, B., Wysoker, A., Fennell, T., Ruan, J., Homer, N., Marth, G., Abecasis, G., Durbin, R., & 1000 Genome Project Data Processing Subgroup (2009) · Bioinformatics · doi:10.1093/bioinformatics/btp352 · Cited by 62,041
Fast and accurate short read alignment with Burrows-Wheeler transform
Li, H., & Durbin, R. (2009) · Bioinformatics · doi:10.1093/bioinformatics/btp324 · Cited by 58,607
STAR: ultrafast universal RNA-seq aligner
Dobin, A., Davis, C. A., Schlesinger, F., Drenkow, J., Zaleski, C., Jha, S., Batut, P., Chaisson, M., & Gingeras, T. R. (2013) · Bioinformatics · doi:10.1093/bioinformatics/bts635 · Cited by 51,709
PD-1 and PD-L1 Immune Checkpoint Blockade to Treat Breast Cancer
Hartkopf, A. D., Taran, F., Wallwiener, M., Walter, C. B., Krämer, B., Grischke, E., & Brucker, S. Y. (2016) · Breast Care · doi:10.1159/000453569 · Cited by 30,989
New response evaluation criteria in solid tumours: revised RECIST guideline (version 1.1)
Eisenhauer, E. A., Therasse, P., Bogaerts, J., Schwartz, L. H., Sargent, D., Ford, R., Dancey, J., Arbuck, S., Gwyther, S., Mooney, M., et al. (2009) · European Journal of Cancer · doi:10.1016/j.ejca.2008.10.026 · Cited by 29,534
The Genome Analysis Toolkit: A MapReduce framework for analyzing next-generation DNA sequencing data
McKenna, A., Hanna, M., Banks, E., Sivachenko, A., Cibulskis, K., Kernytsky, A., Garimella, K., Altshuler, D., Gabriel, S., Daly, M., et al. (2010) · Genome Research · doi:10.1101/gr.107524.110 · Cited by 27,895
HTSeq—a Python framework to work with high-throughput sequencing data
Anders, S., Pyl, P. T., & Huber, W. (2015) · Bioinformatics · doi:10.1093/bioinformatics/btu638 · Cited by 21,464
A global reference for human genetic variation
The 1000 Genomes Project Consortium, authors, C., Auton, A., Abecasis, G. R., Steering committee, Altshuler, D. M., Durbin, R. M., Abecasis, G. R., Bentley, D. R., Chakravarti, A., et al. (2015) · Nature · doi:10.1038/nature15393 · Cited by 18,247
Adverse Renal Effects of Immune Checkpoint Inhibitors: A Narrative Review
Wanchoo, R., Karam, S., Uppal, N. N., Barta, V. S., Deray, G., Devoe, C., Launay‐Vacher, V., Jhaveri, K. D., & on behalf of Cancer and Kidney International Network Workgroup on Immune Checkpoint Inhibitors (2017) · American Journal of Nephrology · doi:10.1159/000455014 · Cited by 15,320
Integrating single-cell transcriptomic data across different conditions, technologies, and species
Butler, A., Hoffman, P., Smibert, P., Papalexi, E., & Satija, R. (2018) · Nature Biotechnology · doi:10.1038/nbt.4096 · Cited by 13,174
Cited by
Sorted by citations
Items 101–177 of 177
Zhang, T., Zhang, C., Fu, Z., & Gao, Q. (2022) · Pharmaceutics · doi:10.3390/pharmaceutics14091768 · Cited by 8
Uveal Melanoma: Molecular and Genetic Mechanisms of Development and Therapeutic Approaches
Zhilnikova, M., Troitskaya, O. S., Novak, D. D., Atamanov, V. V., & Koval, O. A. (2024) · Molecular Biology · doi:10.1134/s0026893324020183 · Cited by 7
The cGAS-STING signaling pathway: emerging targets and challenges in breast cancer immunotherapy
Sun, L., Chen, J., & Zeng, S. (2026) · Frontiers in Immunology · doi:10.3389/fimmu.2025.1685931 · Cited by 7
Sah, V. R., Jespersen, H., Karlsson, J. W., Nilsson, L. M., Bergqvist, M., Johansson, I., Carneiro, A., Helgadóttir, H., Levin, M., Ullenhag, G. J., et al. (2023) · Cancer Research Communications · doi:10.1158/2767-9764.crc-22-0490 · Cited by 7
Self-citationJoerger, M., Koster, K., Janik, T., & de Jong, F. (2024) · Cancer Management and Research · doi:10.2147/cmar.s464245 · Cited by 6
Xu, G., Zheng, M., Wu, Z., Xie, T., Li, Y., Hu, G., Fang, S., Zhang, J., Diao, W., Zhao, W., et al. (2025) · Drug Resistance Updates · doi:10.1016/j.drup.2025.101343 · Cited by 6
Current Therapies and Potential Strategies for Uveal Melanoma
Scoles, S., Ganesh, S., & Yamada, K. H. (2025) · Drugs and Drug Candidates · doi:10.3390/ddc4020014 · Cited by 5
Ren, H., Deng, Z., Lu, S., Zhang, J., Liu, W., & Tan, J. (2026) · Advanced Science · doi:10.1002/advs.202521183 · Cited by 5
Protein acylations in cancer immunity: effects and therapeutic opportunities
Lai, J.-C., Jiang, Y., Liu, S., Wang, S., Cui, W., & Wang, L. (2025) · Trends in Pharmacological Sciences · doi:10.1016/j.tips.2025.05.011 · Cited by 5
Targeted Therapy for Melanomas Without BRAF V600 Mutation
Choi, J. S., & Chandra, S. (2022) · Current Oncology Reports · doi:10.1007/s11912-022-01306-z · Cited by 5
Berluti, F., Baselious, F., Hagemann, S., Hilscher, S., Schmidt, M., Hüttelmaier, S., Schutkowski, M., Sippl, W., & Ibrahim, H. S. (2024) · Archiv der Pharmazie · doi:10.1002/ardp.202400437 · Cited by 5
Grigoruţă, M., Kong, X., & Qin, Y. W. (2025) · Journal of Clinical Medicine · doi:10.3390/jcm14145137 · Cited by 4
Ramelyte, E., Kött, J., Lawless, A. R., Ciernik, A., Heidrich, I., Zellweger, C., Montazeri, K., Mangana, J., Smit, D. J., Freiberger, S. N., et al. (2025) · Clinical Cancer Research · doi:10.1158/1078-0432.ccr-25-2274 · Cited by 5
Fu, S., & Li, C. (2025) · Frontiers in Oncology · doi:10.3389/fonc.2025.1661889 · Cited by 4
Recent advances in the molecular genetic mechanisms and immune microenvironment of uveal melanoma
Yang, K., & Wu, D. (2026) · Melanoma Research · doi:10.1097/cmr.0000000000001089 · Cited by 4
Sundaramurthi, H., Giricz, Z., & Kennedy, B. N. (2022) · International Journal of Molecular Sciences · doi:10.3390/ijms23169378 · Cited by 3
Mattila, K., Mäkelä, S., Kytölä, S. I., Andersson, E. I., Vihinen, P., Ramadan, S., Skyttä, T., Tiainen, L., Vuoristo, M., Tyynelä-Korhonen, K., et al. (2022) · Acta Oncologica · doi:10.1080/0284186x.2022.2137693 · Cited by 4
Moskalenko, Y. (2024) · Regulatory Mechanisms in Biosystems · doi:10.15421/022412 · Cited by 5
Alam, B., Akbari, A. R., Ageed, A., & Duffy, R. (2025) · Journal of Clinical Medicine · doi:10.3390/jcm14030885 · Cited by 4
Waninger, J. J., Fecher, L. A., Lao, C. D., Yentz, S. E., Green, M. D., & Demirci, H. (2022) · Cancers · doi:10.3390/cancers14235789 · Cited by 4
Karlsson, J. W., Sah, V. R., Bagge, R. O., Kuznetsova, I., Iqba, M., Alsén, S., Stenqvist, S., Saxena, A., Ny, L., Nilsson, L. M., et al. (2023) · eLife · doi:10.7554/elife.91705 · Cited by 7
Self-citationBoe, M., Vicari, S., Boccatonda, A., & Piscaglia, F. (2024) · Journal of Ultrasound · doi:10.1007/s40477-024-00909-5 · Cited by 3
Immunotherapy in Ophthalmic Oncology: Current Trends and Future Directions
Masalkhi, M., Wahoud, N., Moran, B., & Elhassadi, E. (2025) · Journal of Clinical & Translational Ophthalmology · doi:10.3390/jcto3010001 · Cited by 3
Hallab, E., Durham, J. N., Walker, R., Cope, L., Charmsaz, S., Groß, N., Sidiropoulos, D. N., Hernandez, A., Leatherman, J., Mitchell, S., et al. (2025) · Epigenetics Communications · doi:10.1186/s43682-025-00037-z · Cited by 3
Targeting pattern recognition receptors for cancer therapy: Mechanisms and strategies
Ouyang, D., Chen, R., Xie, H., Yang, X., Li, Q., & Chen, J. (2025) · Acta Pharmaceutica Sinica B · doi:10.1016/j.apsb.2025.09.007 · Cited by 3
HDAC/σ1R Dual-Ligand as a Targeted Melanoma Therapeutic
Leotta, C. G., Barbaraci, C., Fiorito, J., Coco, A., di Giacomo, V., Amata, E., Marrazzo, A., & Pitari, G. M. (2025) · Pharmaceuticals · doi:10.3390/ph18020179 · Cited by 3
Role of Histone Deacetylases in Drug-Resistant Melanoma: Mechanisms and Therapeutic Implications
Kalal, B. S. (2025) · Kinases and Phosphatases · doi:10.3390/kinasesphosphatases3020008 · Cited by 2
Ng, C., Luckett, T., Mulhern, B. J., Kee, D., Lai-Kwon, J. E., & Joshua, A. M. (2024) · Melanoma Research · doi:10.1097/cmr.0000000000000961 · Cited by 3
Seetharam, D., Chandar, J. S., Ramsoomair, C. K., Desgraves, J., Medina, A. A., Hudson, A. J., Amidei, A., Castro, J., Govindarajan, V., Wang, S., et al. (2024) · bioRxiv (Cold Spring Harbor Laboratory) · doi:10.1101/2024.10.13.618076 · Cited by 3
Uveal Melanoma: Biology, Prognostication, and Emerging Therapies to Outsmart an Immune-Cold Melanoma
Brazel, D., & Buchbinder, E. I. (2026) · Cancers · doi:10.3390/cancers18030432 · Cited by 2
Cell Death of Tumor Melanocytes and Treatment Options
Koval, O. A., Zhilnikova, M., Balantaeva, M., Biryukov, M., & Atamanov, V. V. (2025) · Biocell · doi:10.32604/biocell.2025.059987 · Cited by 2
Blood-Based Cell-Free DNA in Ophthalmic Oncology
Francis, J. H., & Abramson, D. H. (2025) · Translational Vision Science & Technology · doi:10.1167/tvst.14.10.7 · Cited by 2
HDACi induces apoptosis of osteosarcoma cells by inhibiting the MAPK pathway
Qin, C., Lin, T.-T., Lin, Y.-M., Zhang, Y., Hong, S. D., Jia, X. W., & Liu, W. (2026) · Scientific Reports · doi:10.1038/s41598-025-34356-x · Cited by 1
Nelson, A., Riise, R. E., Alsén, S., Wong, A., Carlson, P., Edman, S., Holgersson, J., Bagge, R. O., Johansson, I., Sadik, M., et al. (2026) · Journal for ImmunoTherapy of Cancer · doi:10.1136/jitc-2025-014401 · Cited by 1
Self-citationEpigenetic remodeling in sarcoma promotes T-cell infiltration via modulation of the Hippo pathway
Santos, M. C. D. L., Chen, Y., Zárate, A. G. D., Sorteberg, A. L., Zhao, H., Vázquez-Cabrera, G., bigdeli, N., Kolbeinsdóttir, S., Mannion, A. J., Baldran-Groves, L., et al. (2026) · Journal for ImmunoTherapy of Cancer · doi:10.1136/jitc-2025-014601 · Cited by 2
Zhang, W., Kong, D., Li, G., Yang, Z., Cheng, S., Li, H., Feng, L., & Zhang, K. (2023) · Heliyon · doi:10.1016/j.heliyon.2023.e16478 · Cited by 1
Emerick, C., Silva, L. C., Jang, Y., Vargas, P. A., SQUARIZE, C. H., & CASTILHO, R. M. (2025) · BMC Cancer · doi:10.1186/s12885-025-14739-z · Cited by 1
Quels traitements pour le mélanome uvéal ?
Papasotiriou, E. C., Chessel, E., Costa, C., Daniel, L., Deridder, I., Garyga, S., Gineste, C., & Nahon‐Estève, S. (2022) · médecine/sciences · doi:10.1051/medsci/2022112 · Cited by 1
Zhang, P., Du, Y., Bai, H., Wang, Z., Duan, J., Wang, X., Zhong, J. Y., Wan, R., Xu, J., He, X., et al. (2022) · Research Square · doi:10.21203/rs.3.rs-1331646/v1 · Cited by 1
Sundaramurthi, H., García‐Mulero, S., Slater, K., Marcone, S., Piulats, J. M., Watson, R. W. G., Tobin, D. J., Jensen, L. D., & Kennedy, B. N. (2021) · bioRxiv (Cold Spring Harbor Laboratory) · doi:10.1101/2021.10.28.466226
Păsărică, M. A., Maria, D. C. D., Gruia, I., Murgoi, G., Schmitzer, S., & Grigorescu, A. C. (2021) · Oncolog-Hematolog ro · doi:10.26416/onhe.57.4.2021.5796
Pu, Z., Liu, Z., Jiang, C., Inoue, K., Ruan, Z., Zhu, L., Kikuchi, H., Matsui, A., Huang, P., & Duda, D. G. (2022) · bioRxiv (Cold Spring Harbor Laboratory) · doi:10.1101/2022.06.23.497362
Alexeeva, M., Roalsø, M. T. T., & Søreide, K. (2022) · Elsevier eBooks · doi:10.1016/b978-0-323-91909-8.00027-x
Data from Integrated, Longitudinal Analysis of Cell-free DNA in Uveal Melanoma
Wong, D., Luo, P., Znassi, N., Arteaga, D. P., Gray, D., Danesh, A., Han, M., Stutheit-Zhao, E. Y., Pedersen, S., Prokopec, S. D., et al. (2023) · doi:10.1158/2767-9764.c.6551108.v1
Karlsson, J. W., Sah, V. R., Bagge, R. O., Kuznetsova, I., Iqbal, M. M., Alsén, S., Stenqvist, S., Saxena, A., Ny, L., Nilsson, L. M., et al. (2023) · bioRxiv (Cold Spring Harbor Laboratory) · doi:10.1101/2023.05.16.540908
Self-citationKarlsson, J. W., Sah, V. R., Bagge, R. O., Iqbal, M. M., Alsén, S., Stenqvist, S., Saxena, A., Ny, L., Nilsson, L. M., & Nilsson, J. A. (2023) · eLife · doi:10.7554/elife.91705.1
Self-citationKarlsson, J. W., Sah, V. R., Bagge, R. O., Iqbal, M. M., Alsén, S., Stenqvist, S., Saxena, A., Ny, L., Nilsson, L. M., & Nilsson, J. A. (2023) · eLife · doi:10.7554/elife.91705.1.sa3
Self-citationKarlsson, J., Sah, V. R., Bagge, R. O., et al. (2024) · eLife · doi:10.7554/elife.91705.2.sa2
Karlsson, J. W., Sah, V. R., Bagge, R. O., Kuznetsova, I., Iqbal, M. M., Alsén, S., Stenqvist, S., Saxena, A., Ny, L., Nilsson, L. M., et al. (2024) · eLife · doi:10.7554/elife.91705.2
Self-citationKarlsson, J. W., Sah, V. R., Bagge, R. O., Kuznetsova, I., Iqbal, M. M., Alsén, S., Stenqvist, S., Saxena, A., Ny, L., Nilsson, L. M., et al. (2024) · eLife · doi:10.7554/elife.91705.2.sa0
Self-citationKarlsson, J., Sah, V. R., Bagge, R. O., et al. (2024) · eLife · doi:10.7554/elife.91705.2.sa1
Meckler, J. F., Levis, D. J., Kong, Y., OʼDonnell, R. T., Vang, D. P., & Tuscano, J. M. (2024) · International Journal of Molecular Sciences · doi:10.3390/ijms25147866
Zhao, K., Hai, Z., Shang, R., Liang, H., Wang, C., Zhu, M., & Chen, W. (2024) · Research Square · doi:10.21203/rs.3.rs-4733991/v1
Uveal melanoma: molecular-genetic mechanisms of arising and the therapeutic approaches
Zhilnikova, M., Troitskaya, O. S., Novak, D. D., Atamanov, V. V., & Koval, O. A. (2024) · Molecular Biology · doi:10.31857/s0026898424020017
Biomarkers in Uveal Melanoma: Current and Emerging Applications
Dickinson, K., Cloutier, E., & Burnier, J. V. (2025) · Springer eBooks · doi:10.1007/978-3-031-81354-2_26
Ye, Y., Liao, Y., Zhang, Y., Zhang, J., Luo, M., Yang, Q., Zhai, Q., Xu, Z., Wang, Y., Wen, H., et al. (2025) · The Journal of Pathology · doi:10.1002/path.6481
Kadefors, M., Nelson, A., Blomberg, E., Ståhlberg, A., Ny, L., & Bagge, R. O. (2025) · Immuno-Oncology Technology · doi:10.1016/j.iotech.2025.101079
Self-citationStrianese, D., Laezza, M. P., Passaro, M. L., Elefante, A., D’Aponte, A., Barbato, C., Formisano, L., Iuliano, A., Costagliola, C., & Matarazzo, F. (2025) · American Journal of Ophthalmology Case Reports · doi:10.1016/j.ajoc.2025.102473
Sidhom, S. S., Hrabak, C., Shabbir, Z., Chang, S. J., Kazemeini, S., Akbar, S., Madappallil, J., Whitely, A., & Fraiser, K. (2025) · Research Square · doi:10.21203/rs.3.rs-7794706/v1
Chen, Z., Yang, X., Chen, Z., Li, M., Wang, W., Yang, R., Wang, Z., Ma, Y., Xu, Y., Ao, S., et al. (2024) · Figshare · doi:10.6084/m9.figshare.24439498
Cui, J., Xu, F., Bai, W., Zhao, T., Hong, J., & Zuo, W. (2023) · Figshare · doi:10.6084/m9.figshare.22607609
Baretti, M., Murphy, A. G., Zahurak, M., Gianino, N., Parkinson, R. M., Walker, R., Lopez-Vidal, T. Y., Zheng, L., Rosner, G., Ahuja, N., et al. (2023) · Figshare · doi:10.6084/m9.figshare.22723024
Cui, J., Xu, F., Bai, W., Zhao, T., Hong, J., & Zuo, W. (2023) · Figshare · doi:10.6084/m9.figshare.22607612
Stratification of immunotherapy responses by adaptive immune receptor repertoires
Biró, B., Llamas-Covarrubias, M. A., Sengupta, A., & Standley, D. M. (2026) · Trends in Molecular Medicine · doi:10.1016/j.molmed.2025.12.007
Clonal determinants of organotropism and survival in metastatic uveal melanoma
Jones, B. S. C. L., Hammes, E. A., Demkowicz, P. C., Matesva, M., Pointdujour‐Lim, R., Sinard, J. H., Bacchiocchi, A., Halaban, R., Bosenberg, M., Sznol, M., et al. (2026) · npj Precision Oncology · doi:10.1038/s41698-026-01274-8
Liguori, L., Polcaro, G., Pagliara, V., Feo, R. D., Cattaneo, G., Ventin, M., Camillo, C., Quattrocchi, E., Qi, M., Zhang, L., et al. (2026) · Current Oncology Reports · doi:10.1007/s11912-026-01749-8
Epigenetic modulators in cancer therapy: Treatment and beyond
Sharma, K., Chib, S., Chauhan, K., Amanat, M., Tariq, M., Srivastava, S., Sahu, R., Sharma, N., & Behl, T. (2026) · Elsevier eBooks · doi:10.1016/b978-0-443-31592-3.00018-2
Lu, L., Zhang, Y., Tan, J., Zhong, B., Liu, Y., Tian, X., Gong, W., Li, X., Chen, L., Xia, Y., et al. (2026) · BMC Cancer · doi:10.1186/s12885-026-15911-9
Functional genomics characterization of genetic predisposing factors in uveal melanoma
Derrien, A. (2021) · theses.fr (ABES) · doi:10.70675/a794a7dfz4352z46f0zb97az064f9ea78e46
Vlašić, D., Zagorec, M. K., Jakovčević, A., Gaćina, D. L., Ćorić, M., & Jukić, T. (2026) · Cancers · doi:10.3390/cancers18081211
Chen, Q., Zhou, J., Zhou, H., Wang, H., & Li, J. (2026) · Frontiers in Oncology · doi:10.3389/fonc.2026.1811719
Narayana, R. V. L., Lanier, A. L., Wajapeyee, N., & Gupta, R. (2026) · Journal of Investigative Dermatology · doi:10.1016/j.jid.2026.03.036
Wang, C., Shang, R., Liang, H., Zhu, M., Chen, W., & Zhao, K. (2026) · Translational Oncology · doi:10.1016/j.tranon.2026.102912
Pandey, P. K., Tripathi, D., Mittal, K., & Rathi, N. (2026) · Onco · doi:10.3390/onco6030040
Therapy-induced immunoediting and the evolution of cancer immune escape
Meng, S., & Wang, Z. (2026) · Frontiers in Immunology · doi:10.3389/fimmu.2026.1936590 · Cited by 1
Minnar, C. M., Miyamoto, M., Khelifa, A. S., Lui, G., Lothstein, K. E., Meler, A., Maldonado, M. D. M., Hamilton, D. H., Poppe, L. K., Roller, N., et al. (2026) · Journal for ImmunoTherapy of Cancer · doi:10.1136/jitc-2026-015228
Metadata
- Authors
- Ny, L., Jespersen, H., Karlsson, J., Alsén, S., Filges, S., All-Eriksson, C., Andersson, B., Carneiro, A., Helgadottir, H., Levin, M., Ljuslinder, I., Olofsson Bagge, R., Sah, V. R., Stierner, U., Ståhlberg, A., Ullenhag, G., Nilsson, L. M., & Nilsson, J. A.
- Affiliations
- Sahlgrenska University Hospital (SE)
- Akershus University Hospital (NO)
- The University of Western Australia (AU)
- Lund University (SE)
- University Hospital of Umeå (SE)
- Uppsala University Hospital (SE)
- Corresponding author
- Ny, Lars
- Nilsson, Jonas A.
- ORCID
- Venue
- Nature Communications
- Published
- 2021-08-27
- Volume
- 12
- Issue
- 1
- Pages
- 5155-5155
- ISSN
- 2041-1723 (ISSN-L)
- PMC
- PMC8397717
- OpenAlex
- W3196177384
- Cited by
- 177
- References
- 85
- Citations by year
- 2026: 19 · 2025: 36 · 2024: 37 · 2023: 42 · 2022: 34 · 2021: 9
- FWCI
- 27.61
- Type
- journal article
- Language
- en
- Open access
- gold
- doi.org
- Locations
- Nature Communications (publishedVersion, cc-by)
- Europe PMC (PubMed Central) (publishedVersion, other-oa)
- PubMed Central (publishedVersion, cc-by)
- PubMed (publishedVersion)
- UWA Profiles and Research Repository (UWA) (submittedVersion, cc-by)
- RePEc: Research Papers in Economics (submittedVersion)
- DOAJ (DOAJ: Directory of Open Access Journals) (submittedVersion, cc-by-sa)
- Lund University Publications (Lund University) (submittedVersion)
- Funders
- Merck
- Knut och Alice Wallenbergs Stiftelse
- Cancerfonden
- Vetenskapsrådet
- Familjen Erling-Perssons Stiftelse
- Topics
- Health Sciences › Medicine › Ophthalmology › Ocular Oncology and Treatments
- Health Sciences › Medicine › Ophthalmology › Ocular Diseases and Behçet’s Syndrome
- Health Sciences › Medicine › Oncology › Cancer Immunotherapy and Biomarkers
- Keywords
- pembrolizumab, entinostat, metastatic uveal melanoma, histone deacetylase inhibitors, PD-1 inhibitors, epigenetic therapy, combination immunotherapy, objective response rate, circulating tumor DNA, lactate dehydrogenase, iris melanoma, progression-free survival, overall survival
- MeSH terms
- Progression-Free Survival, Uveal Melanoma, Benzamides, Humans, Melanoma, Pyridines, Uveal Neoplasms, Tumor Suppressor Proteins, Ubiquitin Thiolesterase, Antibodies, Monoclonal, Humanized
About these checks
Registry, retraction, Cites and statistics results are computed, not judged, with one exception: a printed reference that no index lists is read once by a model before it counts as a citation error. Claims are extracted by a model and kept only when their quote appears verbatim in the text; each cited source is then checked, with a model’s help, for whether it says what the claim relies on. Those verdicts can be wrong — read the claim’s quote and the cited source before relying on one.
Statistics and arithmetic are recomputed, not judged.
Confidence bands are shown only for fields calibrated on our annotated test set. None is calibrated yet, so no band is shown.
What counts as a claim ›How we measure confidence ›How we check this ›
Are you an author, or do you see a problem with this page? Request a review
