

The DOI matches its Crossref record; 68 of the 70 references it cites were found in a registry or an index.
Embodied intelligence via learning and evolution
Open accessAbstract
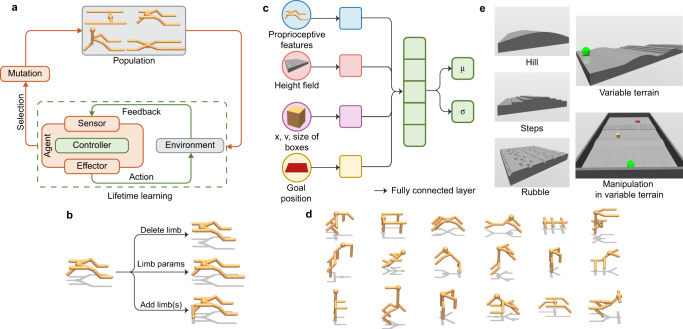
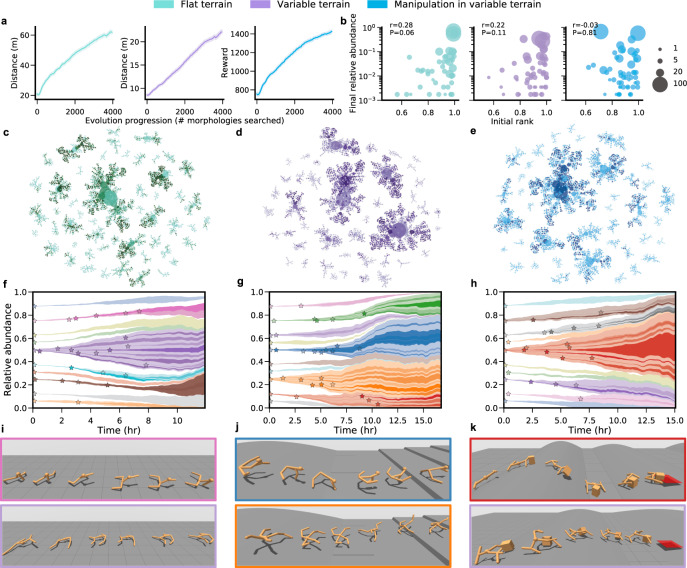
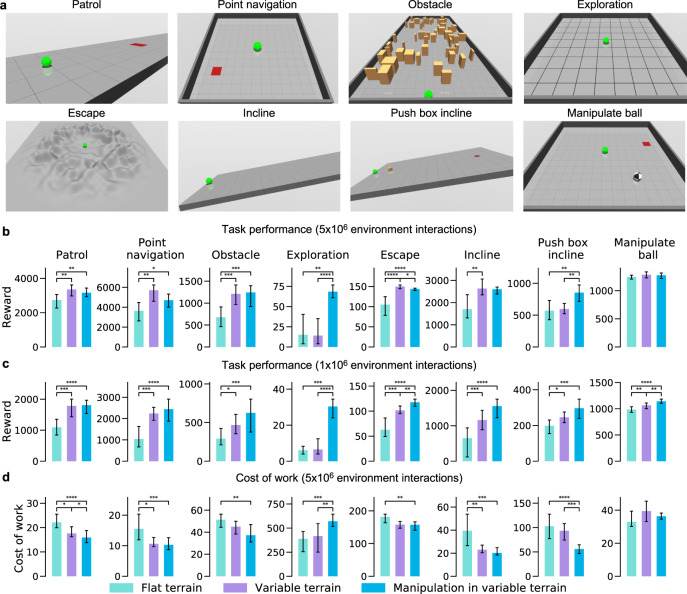
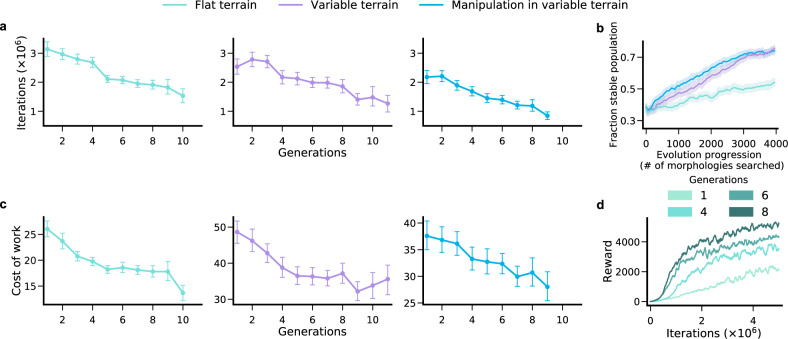
The intertwined processes of learning and evolution in complex environmental niches have resulted in a remarkable diversity of morphological forms. Moreover, many aspects of animal intelligence are deeply embodied in these evolved morphologies. However, the principles governing relations between environmental complexity, evolved morphology, and the learnability of intelligent control, remain elusive, because performing large-scale in silico experiments on evolution and learning is challenging. Here, we introduce Deep Evolutionary Reinforcement Learning (DERL): a computational framework which can evolve diverse agent morphologies to learn challenging locomotion and manipulation tasks in complex environments. Leveraging DERL we demonstrate several relations between environmental complexity, morphological intelligence and the learnability of control. First, environmental complexity fosters the evolution of morphological intelligence as quantified by the ability of a morphology to facilitate the learning of novel tasks. Second, we demonstrate a morphological Baldwin effect i.e., in our simulations evolution rapidly selects morphologies that learn faster, thereby enabling behaviors learned late in the lifetime of early ancestors to be expressed early in the descendants lifetime. Third, we suggest a mechanistic basis for the above relationships through the evolution of morphologies that are more physically stable and energy efficient, and can therefore facilitate learning and control.
Overview
The claims and statistics of this paper haven’t been checked yet.
Free: it reads the open-access text and checks the first 5 claims that cite a source we can check. Create a free account to check every claim.
Integrity signals
Registry
Cites
Statistics
Figures
Verification
Claims the paper makes
The claims and statistics of this paper haven’t been checked yet.
Free: it reads the open-access text and checks the first 5 claims that cite a source we can check. Create a free account to check every claim.
Claims other papers make about this one
Each is checked against this paper’s own text: does it say what the citing paper says it does?
The source backs part of the claim, not all of it — or backs it for a different population, condition or comparison.
In the citing paper
“our approach uniquely evolves embodied agents with both eyes and behaviors together”
From What if eye...? Computationally recreating vision evolution (2025) · cites this paper as [40]
Experimental — accuracy not yet measuredThe source backs part of the claim, not all of it — or backs it for a different population, condition or comparison.
In the citing paper
“Spatial cognition, the ability to acquire, organize, exploit, and update knowledge about external space, is fundamental to both human beings and artificial intelligence (AI)1,2.”
From Brain-inspired spatial intelligence for embodied agents (2026) · cites this paper as [1]
Experimental — accuracy not yet measured
Self-check
Percentages, sums and reported differences re-computed from the paper’s own numbers.
The self-check needs the paper’s full text.
Citations
Cites
Deep Residual Learning for Image Recognition
He, K., Zhang, X., Ren, S., & Sun, J. (2016) · 2016 IEEE Conference on Computer Vision and Pattern Recognition (CVPR) · doi:10.1109/cvpr.2016.90 · Cited by 235,474
Language Models are Few-Shot Learners
Brown, T. B., Mann, B., Ryder, N., Subbiah, M., Kaplan, J., Dhariwal, P., Neelakantan, A., Shyam, P., Sastry, G., Askell, A., et al. (2020) · arXiv · doi:10.48550/arxiv.2005.14165 · Cited by 23,372 · cited 2×
“In contrast, the field of artificial intelligence (AI) has focused primarily on disembodied cognition, for example in domains of language 6 , vision 7 or games 8 .”
BackgroundMastering the game of Go with deep neural networks and tree search
Silver, D., Huang, A., Maddison, C. J., Guez, A., Sifre, L., van den Driessche, G., Schrittwieser, J., Antonoglou, I., Panneershelvam, V., Lanctot, M., et al. (2016) · Nature · doi:10.1038/nature16961 · Cited by 15,612 · cited 2×
“2i-k, 7, 8).”
BackgroundMomentum Contrast for Unsupervised Visual Representation Learning
He, K., Fan, H., Wu, Y., Xie, S., & Girshick, R. (2020) · 2020 IEEE/CVF Conference on Computer Vision and Pattern Recognition (CVPR) · doi:10.1109/cvpr42600.2020.00975 · Cited by 13,347
A simple framework for contrastive learning of visual representations
Chen, T., Kornblith, S., Norouzi, M., & Hinton, G. (2020) · arXiv · doi:10.48550/arxiv.2002.05709 · Cited by 10,857
Proximal Policy Optimization Algorithms
Schulman, J., Wolski, F., Dhariwal, P., Radford, A., & Klimov, O. (2017) · arXiv · doi:10.48550/arxiv.1707.06347 · Cited by 10,625 · cited 4×
“1b) that are learned via proximal policy optimization (PPO) 28 .”
BackgroundMethodInfluentialScaling Laws for Neural Language Models
Kaplan, J., McCandlish, S., Henighan, T., Brown, T. B., Chess, B., Child, R., Gray, S., Radford, A., Wu, J., & Amodei, D. (2020) · arXiv · doi:10.48550/arxiv.2001.08361 · Cited by 9,550
Design, fabrication and control of soft robots
Rus, D., & Tolley, M. T. (2015) · Nature · doi:10.1038/nature14543 · Cited by 5,825
MuJoCo: A physics engine for model-based control
Todorov, E., Erez, T., & Tassa, Y. (2012) · 2012 IEEE/RSJ International Conference on Intelligent Robots and Systems · doi:10.1109/iros.2012.6386109 · Cited by 4,767
Neural Architecture Search with Reinforcement Learning
Zoph, B., & Le, Q. V. (2016) · arXiv (Cornell University) · doi:10.48550/arxiv.1611.01578 · Cited by 3,974
Research works printed but not linked: 15
- Darwin, C. On the Origin of Species by Means of Natural Selection, Vol. 167 (John Murray, London, 1859).
- Wang, T., Zhou, Y., Fidler, S. & Ba, J. In International Conference on Learning Representations (2019).
- Luck, K. S., Amor, H. B. & Calandra, R. Data-efficient co-adaptation of morphology and behaviour with deep reinforcement learning. in Conference on Robot Learning, 854–869 (PMLR, 2020).
- Zoph, B. & Le, Q. V. In International Conference on Learning Representations (2017).
- Sutton, R. S. & Barto, A. G. Reinforcement Learning: An Introduction (MIT Press, 2018).
- Turney, P. D. In ICML Workshop on Evolutionary Computation and Machine Learning, 135–142 (1996).
- Hinton, G. E. & Nowlan, S. J. How learning can guide evolution. Complex Syst. 1, 495–502 (1987).
- Ackley, D. & Littman, M. Interactions between learning and evolution. Artif. life II 10, 487–509 (1991).
- Bongard, J. C. & Paul, C. in From Animals to Animats: The Sixth International Conference on the Simulation of Adaptive Behaviour (Citeseer, 2000).
- Wang, T., Liao, R., Ba, J. & Fidler, S. In International Conference on Learning Representations (2018).
- Pathak, D., Lu, C., Darrell, T., Isola, P. & Efros, A. A. In Advances in Neural Information Processing Systems (eds Wallach, H. et al.) Vol. 32 (Curran Associates, Inc., 2019).
- Huang, W., Mordatch, I. & Pathak, D. One policy to control them all: shared modular policies for agent-agnostic control. In International Conference on Machine Learning, 4455–4464 (PMLR, 2020).
- Schulman, J., Moritz, P., Levine, S., Jordan, M. & Abbeel, P. In Proceedings of the International Conference on Learning Representations (ICLR) (2016).
- Henderson, P. et al. In Thirty-Second AAAI Conference on Artificial Intelligence (2018).
- Siciliano, B. & Khatib, O. In Springer Handbooks (2016).
Cited by
Artificial intelligence for geoscience: Progress, challenges, and perspectives
Zhao, T., Wang, S., Ouyang, C., Chen, M., Liu, C., Zhang, J., Yu, L., Wang, F., Xie, Y., Li, J., et al. (2024) · The Innovation · doi:10.1016/j.xinn.2024.100691 · Cited by 360
“165 Moreover, the deep integration of large AI models withdrones,autonomousvehicles,andmobilemonitoringdevicesonthesurface orunderground,coupledwithsatellitedata,isfacilitatingmoreef fi cient andauto-mated complex actions in geoscience, including spatiotemporal data collection, processing, and…”
BackgroundCatalyzing next-generation Artificial Intelligence through NeuroAI
Zador, A., Escola, S., Richards, B., Ölveczky, B., Bengio, Y., Boahen, K., Botvinick, M., Chklovskii, D., Churchland, A., Clopath, C., et al. (2023) · Nature Communications · doi:10.1038/s41467-023-37180-x · Cited by 300
Self-citationDiffusion Models in Low-Level Vision: A Survey
He, C., Shen, Y., Fang, C., Xiao, F., Tang, L., Zhang, Y., Zuo, W., Guo, Z., & Li, X. (2025) · IEEE Transactions on Pattern Analysis and Machine Intelligence · doi:10.1109/tpami.2025.3545047 · Cited by 203
“Noting that GSAD [105] and PyDiff [96] employ the ”gt mean” strategy, which involves fine-tuning the brightness of the generated results using the ground truth, thus producing much more impressive results than others in PSNR and SSIM.”
Embodied Intelligence: A Synergy of Morphology, Action, Perception and Learning
Liu, H., Guo, D., & Cangelosi, A. (2025) · ACM Computing Surveys · doi:10.1145/3717059 · Cited by 200
“Currently, the work in this area mainly includes the optimization of morphological parameters and structure, and the methods used mainly include reinforcement learning [63, 65] and genetic optimization [71].”
Li, P., Hao, J., Tang, H., Fu, X., Zheng, Y., & Tang, K. (2024) · IEEE Transactions on Evolutionary Computation · doi:10.1109/tevc.2024.3443913 · Cited by 153
“The hybrid algorithms in this area include EvoGym (GA) [43], HERD [44], AIEA [45], DERL [46], and TAME [47].”
Metadata
- Authors
- Gupta, A., Savarese, S., Ganguli, S., & Fei-Fei, L.
- Affiliations
- Stanford University (US)
- Corresponding author
- Gupta, Agrim
- Fei-Fei, Li
- Venue
- Nature Communications
- Published
- 2021-10-06
- Volume
- 12
- Issue
- 1
- Pages
- 5721-5721
- ISSN
- 2041-1723 (ISSN-L)
- PMC
- PMC8494941
- OpenAlex
- W3127203205
- Cited by
- 352
- References
- 70
- Citations by year
- 2026: 97 · 2025: 111 · 2024: 65 · 2023: 47 · 2022: 26 · 2021: 6
- FWCI
- 12.61
- Type
- journal article
- Language
- en
- Open access
- gold
- doi.org
- Licence
- cc-by
- creativecommons.org/licenses/by/4.0 (tdm)
- creativecommons.org/licenses/by/4.0 (vor)
- Locations
- Nature Communications (publishedVersion, cc-by)
- Europe PMC (PubMed Central) (publishedVersion, other-oa)
- PubMed Central (publishedVersion, cc-by)
- PubMed (publishedVersion)
- arXiv (Cornell University) (submittedVersion)
- RePEc: Research Papers in Economics (submittedVersion)
- DOAJ (DOAJ: Directory of Open Access Journals) (submittedVersion, cc-by-sa)
- arXiv (Cornell University) (cc-by)
- Funders
- United States Department of Defense | United States Navy | Office of Naval Research (N00014-16-1-2127)
- Topics
- Physical Sciences › Computer Science › Artificial Intelligence › Reinforcement Learning in Robotics
- Physical Sciences › Computer Science › Artificial Intelligence › Evolutionary Algorithms and Applications
- Life Sciences › Biochemistry, Genetics and Molecular Biology › Genetics › Evolution and Genetic Dynamics
- Keywords
- embodied AI, morphological evolution, environmental complexity, locomotion, manipulation tasks, morphological stability, energy efficiency
- MeSH terms
- Deep Learning, Animals, Computer Simulation, Biological Evolution, Reward
About these checks
Registry, retraction, Cites and statistics results are computed, not judged, with one exception: a printed reference that no index lists is read once by a model before it counts as a citation error. Claims are extracted by a model and kept only when their quote appears verbatim in the text; each cited source is then checked, with a model’s help, for whether it says what the claim relies on. Those verdicts can be wrong — read the claim’s quote and the cited source before relying on one.
Statistics and arithmetic are recomputed, not judged.
Confidence bands are shown only for fields calibrated on our annotated test set. None is calibrated yet, so no band is shown.
What counts as a claim ›How we measure confidence ›How we check this ›
Are you an author, or do you see a problem with this page? Request a review
How to cite
Cite CoChat for the checks on this page, and the paper for its own findings.
- This page
- CoChat. (2026). Citation check: Embodied intelligence via learning and evolution. https://app.cochat.ai/papers/10.1038/s41467-021-25874-z
- The paper
- Gupta, A., Savarese, S., Ganguli, S., & Fei-Fei, L. (2021). Embodied intelligence via learning and evolution. Nature Communications. https://doi.org/10.1038/s41467-021-25874-z
Data sources
Bibliographic data: Semantic Scholar, OpenAlex, Crossref.
Contains information from the Semantic Scholar Academic Graph Datasets, made available under the ODC Attribution License (ODC-BY 1.0).
Semantic Scholar’s data is described in: Kinney, R., et al. (2023). The Semantic Scholar Open Data Platform. arXiv:2301.10140.
