

The DOI matches its Crossref record; 81 of the 84 references it cites were found in a registry or an index.
Neuronal ribosomes exhibit dynamic and context-dependent exchange of ribosomal proteins
Open accessPublished version of a preprint
Abstract
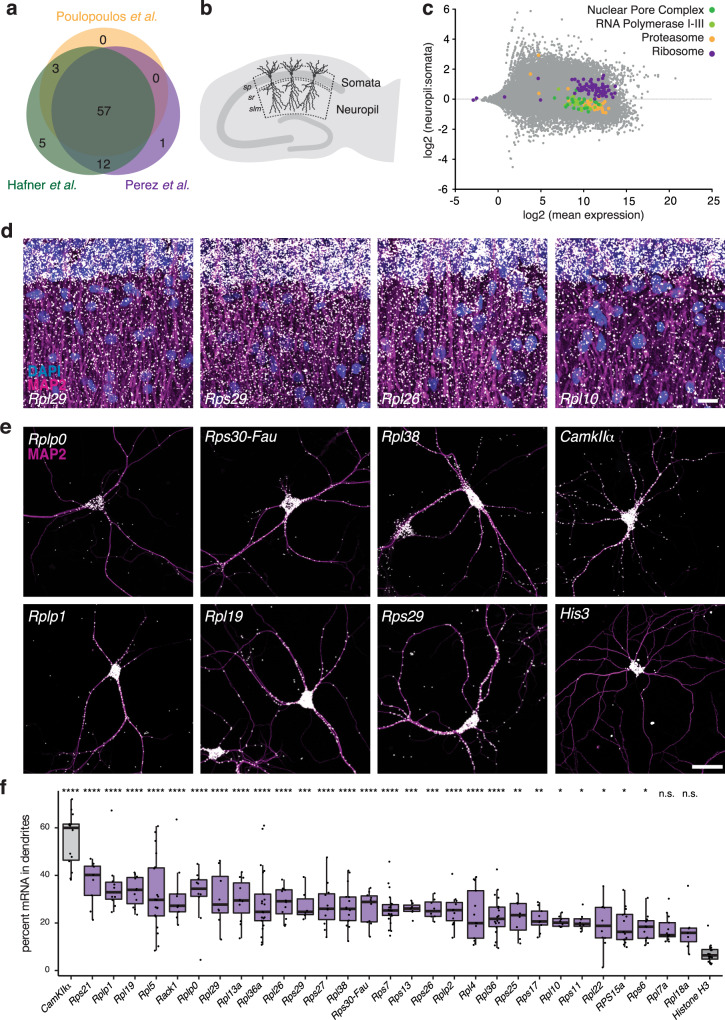
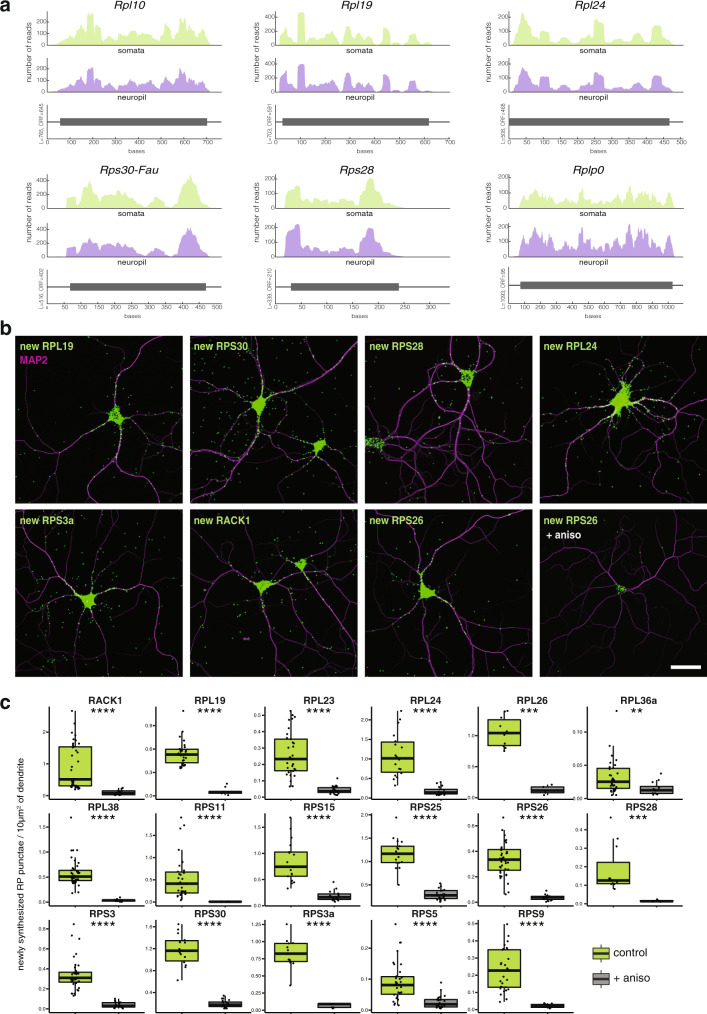
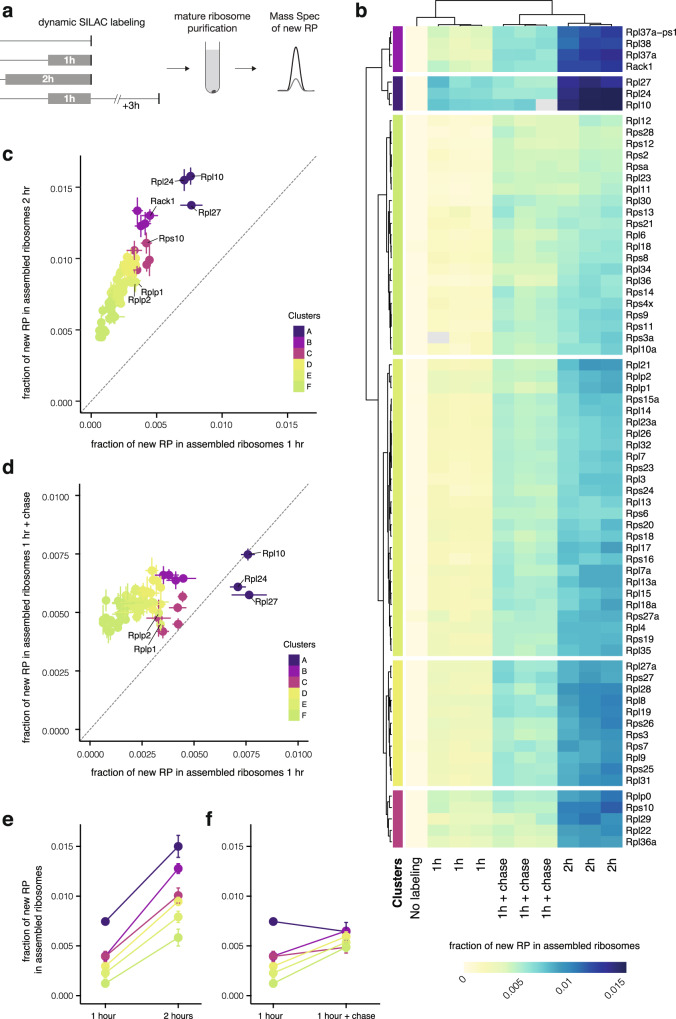
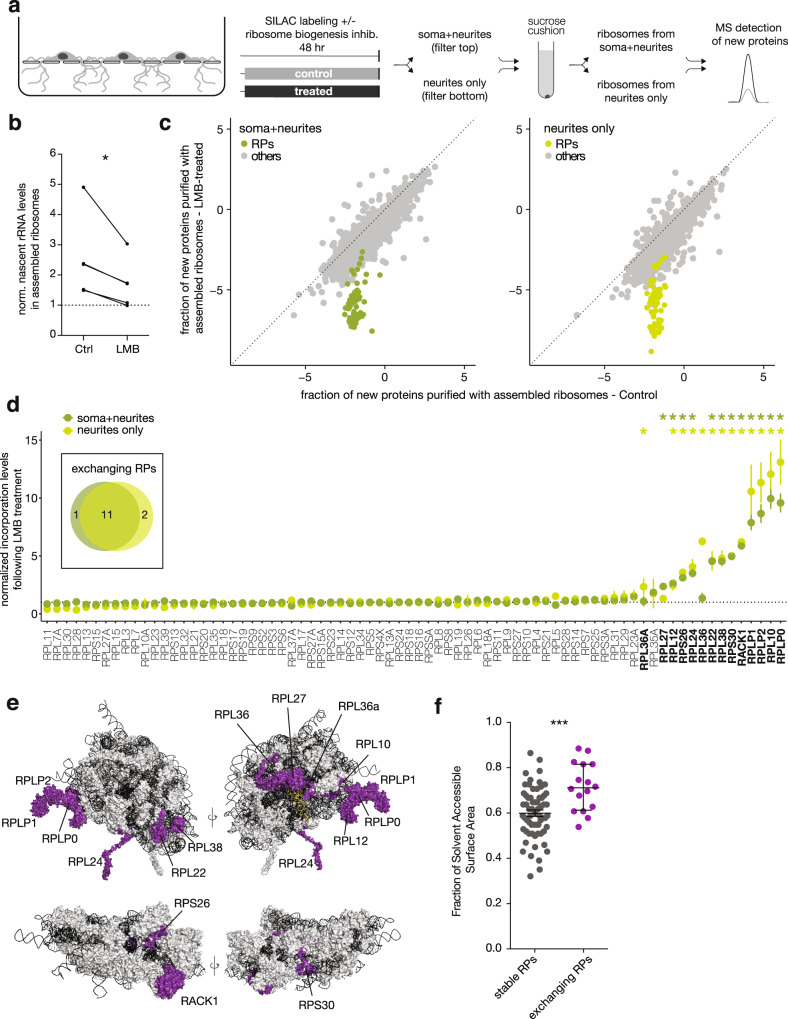
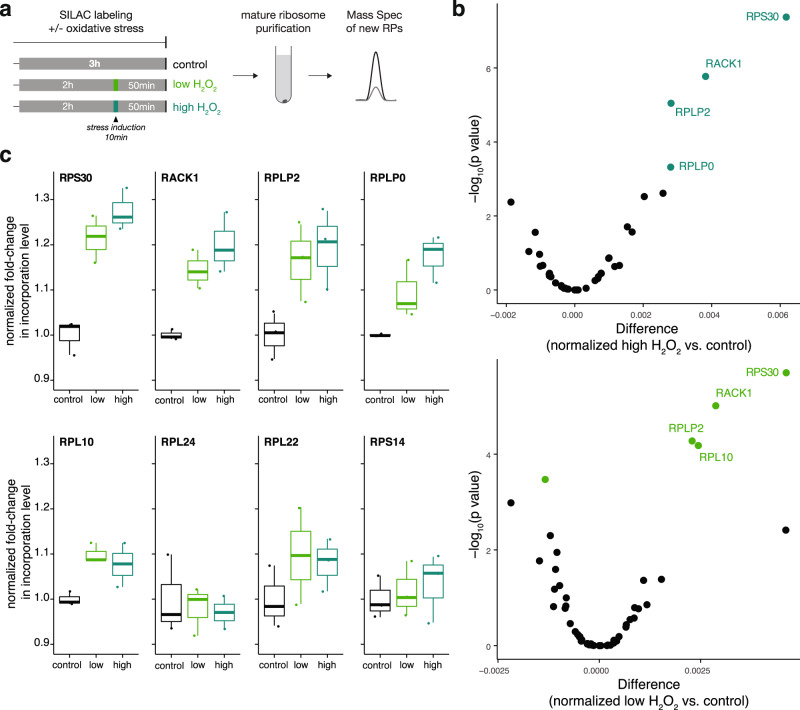
Owing to their morphological complexity and dense network connections, neurons modify their proteomes locally, using mRNAs and ribosomes present in the neuropil (tissue enriched for dendrites and axons). Although ribosome biogenesis largely takes place in the nucleus and perinuclear region, neuronal ribosomal protein (RP) mRNAs have been frequently detected remotely, in dendrites and axons. Here, using imaging and ribosome profiling, we directly detected the RP mRNAs and their translation in the neuropil. Combining brief metabolic labeling with mass spectrometry, we found that a group of RPs rapidly associated with translating ribosomes in the cytoplasm and that this incorporation was independent of canonical ribosome biogenesis. Moreover, the incorporation probability of some RPs was regulated by location (neurites vs. cell bodies) and changes in the cellular environment (following oxidative stress). Our results suggest new mechanisms for the local activation, repair and/or specialization of the translational machinery within neuronal processes, potentially allowing neuronal synapses a rapid means to regulate local protein synthesis.
Overview
The claims and statistics of this paper haven’t been checked yet.
Run the check — free, no account needed. It reads the open-access text and checks the sources it cites.
Integrity signals
Registry
Cites
Statistics
Figures
Verification
Claims the paper makes
The claims and statistics of this paper haven’t been checked yet.
Run the check — free, no account needed. It reads the open-access text and checks the sources it cites.
Self-check
Percentages, sums and reported differences re-computed from the paper’s own numbers.
The self-check needs the paper’s full text.
Citations
Cites
Cox, J., & Mann, M. (2008) · Nature Biotechnology · doi:10.1038/nbt.1511 · Cited by 14,855
Universal sample preparation method for proteome analysis
Wiśniewski, J. R., Zougman, A., Nagaraj, N., & Mann, M. (2009) · Nature Methods · doi:10.1038/nmeth.1322 · Cited by 8,352
Global quantification of mammalian gene expression control
Schwanhäusser, B., Busse, D., Li, N., Dittmar, G., Schuchhardt, J., Wolf, J., Chen, W., & Selbach, M. (2011) · Nature · doi:10.1038/nature10098 · Cited by 6,566
Pérez-Riverol, Y., Csordas, A., Bai, J.-W., Bernal-Llinares, M., Hewapathirana, S., Kundu, D. J., Inuganti, A., Griss, J., Mayer, G., Eisenacher, M., et al. (2018) · Nucleic Acids Res. · doi:10.1093/nar/gky1106 · Cited by 6,216
The MaxQuant computational platform for mass spectrometry-based shotgun proteomics
Tyanova, S., Temu, T., & Cox, J. (2016) · Nature Protocols · doi:10.1038/nprot.2016.136 · Cited by 4,858
Skyline: an open source document editor for creating and analyzing targeted proteomics experiments
MacLean, B., Tomazela, D. M., Shulman, N., Chambers, M., Finney, G. L., Frewen, B., Kern, R., Tabb, D. L., Liebler, D. C., & MacCoss, M. J. (2010) · Bioinformatics · doi:10.1093/bioinformatics/btq054 · Cited by 4,697
Rappsilber, J., Mann, M., & Ishihama, Y. (2007) · Nature Protocols · doi:10.1038/nprot.2007.261 · Cited by 4,641
The economics of ribosome biosynthesis in yeast
Warner, J. R. (1999) · Trends in Biochemical Sciences · doi:10.1016/s0968-0004(99)01460-7 · Cited by 1,933
Peterson, A. C., Russell, J. D., Bailey, D. J., Westphall, M. S., & Coon, J. J. (2012) · Molecular & Cellular Proteomics · doi:10.1074/mcp.o112.020131 · Cited by 1,288
Cajigas, I. J., Tushev, G., Will, T. J., tom Dieck, S., Fuerst, N., & Schuman, E. M. (2012) · Neuron · doi:10.1016/j.neuron.2012.02.036 · Cited by 709
Self-citationHeterogeneous Ribosomes Preferentially Translate Distinct Subpools of mRNAs Genome-wide
Shi, Z., Fujii, K., Kovary, K. M., Genuth, N. R., Röst, H. L., Teruel, M. N., & Barna, M. (2017) · Molecular Cell · doi:10.1016/j.molcel.2017.05.021 · Cited by 671
Structures of the human and Drosophila 80S ribosome
Anger, A. M., Armache, J., Berninghausen, O., Habeck, M., Subklewe, M. S., Wilson, D. N., & Beckmann, R. (2013) · Nature · doi:10.1038/nature12104 · Cited by 665
Reactive Oxygen Species in the Regulation of Synaptic Plasticity and Memory
Massaad, C. A., & Klann, E. (2011) · Antioxidants & Redox Signaling · doi:10.1089/ars.2010.3208 · Cited by 635
Dynamic visualization of local protein synthesis in hippocampal neurons
Aakalu, G., Smith, W. B., Nguyen, N., Jiang, C., & Schuman, E. M. (2001) · Neuron · doi:10.1016/s0896-6273(01)00295-1 · Cited by 611
Self-citationBurgin, K., Waxham, M., Rickling, S., Westgate, S., Mobley, W. C., & Kelly, P. (1990) · Journal of Neuroscience · doi:10.1523/jneurosci.10-06-01788.1990 · Cited by 564
Transcriptome-wide measurement of translation by ribosome profiling
McGlincy, N. J., & Ingolia, N. T. (2017) · Methods · doi:10.1016/j.ymeth.2017.05.028 · Cited by 533
Miller, S., Yasuda, M., Coats, J., Jones, Y., Martone, M. E., & Mayford, M. R. (2002) · Neuron · doi:10.1016/s0896-6273(02)00978-9 · Cited by 520
The discovery of ribosome heterogeneity and its implications for gene regulation and organismal life
Genuth, N. R., & Barna, M. (2018) · Molecular Cell · doi:10.1016/j.molcel.2018.07.018 · Cited by 511
Local translation in neurons: visualization and function
Holt, C., Martin, K. C., & Schuman, E. (2019) · Nature Structural & Molecular Biology · doi:10.1038/s41594-019-0263-5 · Cited by 463
Self-citationDynamic Axonal Translation in Developing and Mature Visual Circuits
Shigeoka, T., Jung, H., Jung, J., Turner-Bridger, B., Ohk, J., Lin, J. Q., Amieux, P. S., & Holt, C. E. (2016) · Cell · doi:10.1016/j.cell.2016.05.029 · Cited by 462
Local protein synthesis is a ubiquitous feature of neuronal pre- and postsynaptic compartments
Hafner, A.-S., Donlin-Asp, P. G., Leitch, B., Herzog, E., & Schuman, E. M. (2019) · Science · doi:10.1126/science.aau3644 · Cited by 431
Self-citationGlobal Translational Responses to Oxidative Stress Impact upon Multiple Levels of Protein Synthesis
Shenton, D., Smirnova, J. B., Selley, J. N., Carroll, K. M., Hubbard, S. J., Pavitt, G. D., Ashe, M., & Grant, C. M. (2006) · Journal of Biological Chemistry · doi:10.1074/jbc.m601545200 · Cited by 417
Functions of Ribosomal Proteins in Assembly of Eukaryotic Ribosomes In Vivo
de la Cruz, J., Karbstein, K., & Woolford, J. L. (2015) · Annual Review of Biochemistry · doi:10.1146/annurev-biochem-060614-033917 · Cited by 405
Tushev, G., Glock, C., Heumüller, M., Biever, A., Jovanovic, M., & Schuman, E. M. (2018) · Neuron · doi:10.1016/j.neuron.2018.03.030 · Cited by 377
Self-citationAnalysis of Nucleolar Protein Dynamics Reveals the Nuclear Degradation of Ribosomal Proteins
Lam, Y. W., Lamond, A. I., Mann, M., & Andersen, J. S. (2007) · Current Biology · doi:10.1016/j.cub.2007.03.064 · Cited by 369
Gumy, L. F., Yeo, G. S. H., Tung, Y. L., Zivraj, K. H., Willis, D. E., Coppola, G., Lam, B., Twiss, J. L., Holt, C. E., & Fawcett, J. W. (2010) · RNA · doi:10.1261/rna.2386111 · Cited by 367
Global analysis of cellular protein translation by pulsed SILAC
Schwanhäusser, B., Gossen, M., Dittmar, G., & Selbach, M. (2009) · PROTEOMICS · doi:10.1002/pmic.200800275 · Cited by 356
Fornasiero, E. F., Mandad, S., Wildhagen, H., Alevra, M., Rammner, B., Keihani, S., Opazo, F., Urban, I., Ischebeck, T., Sakib, M. S., et al. (2018) · Nature Communications · doi:10.1038/s41467-018-06519-0 · Cited by 356
Turnover of the Human Proteome: Determination of Protein Intracellular Stability by Dynamic SILAC
Doherty, M. K., Hammond, D. E., Clague, M. J., Gaskell, S. J., & Beynon, R. J. (2009) · Journal of Proteome Research · doi:10.1021/pr800641v · Cited by 340
THE FINE STRUCTURE OF THE AXON AND GROWTH CONE OF THE DORSAL ROOT NEUROBLAST OF THE RABBIT EMBRYO
Tennyson, V. M. (1970) · The Journal of Cell Biology · doi:10.1083/jcb.44.1.62 · Cited by 339
Axonal mRNA in Uninjured and Regenerating Cortical Mammalian Axons
Taylor, A. M., Berchtold, N. C., Perreau, V. M., Tu, C. H., Jeon, N. L., & Cotman, C. W. (2009) · Journal of Neuroscience · doi:10.1523/jneurosci.6130-08.2009 · Cited by 328
RNA regulons in Hox 5′ UTRs confer ribosome specificity to gene regulation
Xue, S., Tian, S., Fujii, K., Kladwang, W., Das, R., & Barna, M. (2014) · Nature · doi:10.1038/nature14010 · Cited by 319
Subcellular Profiling Reveals Distinct and Developmentally Regulated Repertoire of Growth Cone mRNAs
Zivraj, K. H., Tung, Y. C. L., Piper, M., Gumy, L., Fawcett, J. W., Yeo, G. S. H., & Holt, C. E. (2010) · The Journal of Neuroscience · doi:10.1523/jneurosci.1800-10.2010 · Cited by 315
Direct visualization of newly synthesized target proteins in situ
Dieck, S. T., Kochen, L., Hanus, C., Heumüller, M., Bartnik, I., Nassim-Assir, B., Merk, K., Mosler, T., Garg, S., Bunse, S., et al. (2015) · Nature Methods · doi:10.1038/nmeth.3319 · Cited by 301
Self-citationKinetic Analysis of Protein Stability Reveals Age-Dependent Degradation
McShane, E., Sin, C., Zauber, H., Wells, J. N., Donnelly, N., Wang, X., Hou, J., Chen, W., Štorchová, Z., Marsh, J. A., et al. (2016) · Cell · doi:10.1016/j.cell.2016.09.015 · Cited by 301
Wu, C. C., Zinshteyn, B., Wehner, K. A., & Green, R. (2019) · Molecular Cell · doi:10.1016/j.molcel.2018.12.009 · Cited by 298
Monosomes actively translate synaptic mRNAs in neuronal processes
Biever, A., Glock, C., Tushev, G., Ciirdaeva, E., Dalmay, T., Langer, J. D., & Schuman, E. M. (2020) · Science · doi:10.1126/science.aay4991 · Cited by 283
Self-citationUltrastructural Analysis of Hippocampal Neuropil from the Connectomics Perspective
Mishchenko, Y., Hu, T., Špaček, J., Mendenhall, J. M., Harris, K. M., & Chklovskii, D. B. (2010) · Neuron · doi:10.1016/j.neuron.2010.08.014 · Cited by 276
Local and global influences on protein turnover in neurons and glia
Dörrbaum, A. R., Kochen, L., Langer, J. D., & Schuman, E. M. (2018) · eLife · doi:10.7554/elife.34202 · Cited by 249
Self-citationIdentification of Process-Localized mRNAs from Cultured Rodent Hippocampal Neurons
Poon, M. M., Choi, S.-H., Jamieson, C. A. M., Geschwind, D. H., & Martin, K. C. (2006) · Journal of Neuroscience · doi:10.1523/jneurosci.3432-06.2006 · Cited by 225
Differential Stoichiometry among Core Ribosomal Proteins
Slavov, N., Semrau, S., Airoldi, E. M., Budnik, B., & van Oudenaarden, A. (2015) · Cell Reports · doi:10.1016/j.celrep.2015.09.056 · Cited by 201
RACK1 Controls IRES-Mediated Translation of Viruses
Majzoub, K., Hafirassou, M. L., Meignin, C., Goto, A., Marzi, S., Fedorova, A. A., Verdier, Y., Vinh, J., Hoffmann, J. A., Martin, F., et al. (2014) · Cell · doi:10.1016/j.cell.2014.10.041 · Cited by 195
On-Site Ribosome Remodeling by Locally Synthesized Ribosomal Proteins in Axons
Shigeoka, T., Koppers, M., Wong, H. H., Lin, J. Q., Cagnetta, R., Dwivedy, A., Nascimento, J. D. F., van Tartwijk, F. W., Ströhl, F., Cioni, J.-M., et al. (2019) · Cell Reports · doi:10.1016/j.celrep.2019.11.025 · Cited by 192
Thomas, F., & Kutay, U. (2003) · Journal of Cell Science · doi:10.1242/jcs.00464 · Cited by 188
An NGF-responsive element targets myo-inositol monophosphatase-1 mRNA to sympathetic neuron axons
Andreassi, C., Zimmermann, C., Mitter, R., Fusco, S., Vita, S. D., Saiardi, A., & Riccio, A. (2010) · Nature Neuroscience · doi:10.1038/nn.2486 · Cited by 186
Rps26 directs mRNA-specific translation by recognition of Kozak sequence elements
Ferretti, M., Ghalei, H., Ward, E. A., Potts, E. L., & Karbstein, K. (2017) · Nature Structural & Molecular Biology · doi:10.1038/nsmb.3442 · Cited by 184
Subcellular transcriptomes and proteomes of developing axon projections in the cerebral cortex
Poulopoulos, A., Murphy, A. J., Özkan, A., Davis, P. W., Hatch, J. J., Kirchner, R., & Macklis, J. D. (2019) · Nature · doi:10.1038/s41586-018-0847-y · Cited by 177
Global mRNA polarization regulates translation efficiency in the intestinal epithelium
Moor, A. E., Golan, M., Massasa, E. E., Lemze, D., Weizman, T., Shenhav, R., Baydatch, S., Mizrahi, O., Winkler, R., Golani, O., et al. (2017) · Science · doi:10.1126/science.aan2399 · Cited by 174
Moccia, R., Chen, D., Lyles, V., Kapuya, E., Yaping, E., Kalachikov, S. M., Spahn, C. M. T., Frank, J., Kandel, E. R., Barad, M., et al. (2003) · Journal of Neuroscience · doi:10.1523/jneurosci.23-28-09409.2003 · Cited by 172
Proteome Turnover in the Spotlight: Approaches, Applications, and Perspectives
Ross, A. B., Langer, J. D., & Jovanović, M. (2020) · Molecular & Cellular Proteomics · doi:10.1074/mcp.r120.002190 · Cited by 156
Self-citationRapid Cue-Specific Remodeling of the Nascent Axonal Proteome
Cagnetta, R., Frese, C. K., Shigeoka, T., Krijgsveld, J., & Holt, C. E. (2018) · Neuron · doi:10.1016/j.neuron.2018.06.004 · Cited by 152
Temperature sensitive mutations affecting ribosome synthesis in Saccharomyces cerevisiae
Warner, J. R., & Udem, S. A. (1972) · Journal of Molecular Biology · doi:10.1016/0022-2836(72)90280-x · Cited by 126
Kinetics and Mechanism of Mammalian Mitochondrial Ribosome Assembly
Bogenhagen, D. F., Ostermeyer‐Fay, A. G., Haley, J. D., & García–Díaz, M. (2018) · Cell Reports · doi:10.1016/j.celrep.2018.01.066 · Cited by 124
Whole transcriptome profiling reveals the RNA content of motor axons
Briese, M., Saal-Bauernschubert, L., Appenzeller, S., Moradi, M., Baluapuri, A., & Sendtner, M. (2015) · Nucleic Acids Research · doi:10.1093/nar/gkv1027 · Cited by 123
Mardakheh, F. K., Paul, A., Kuemper, S., Sadok, A., Paterson, H., McCarthy, A., Yuan, Y., & Marshall, C. J. (2015) · Developmental Cell · doi:10.1016/j.devcel.2015.10.005 · Cited by 120
Phosphorylation of the Ribosomal Protein RPL12/uL11 Affects Translation during Mitosis
Imami, K., Milek, M., Bogdanow, B., Yasuda, T., Kastelić, N., Zauber, H., Ishihama, Y., Landthaler, M., & Selbach, M. (2018) · Molecular Cell · doi:10.1016/j.molcel.2018.08.019 · Cited by 120
A SUGGESTIVE RELATIONSHIP OF NERVE CELL RNA WITH SPECIFIC SYNAPTIC SITES
Bodian, D. (1965) · Proceedings of the National Academy of Sciences · doi:10.1073/pnas.53.2.418 · Cited by 116
Goeminne, L. J. E., Gevaert, K., & Clement, L. (2017) · Journal of Proteomics · doi:10.1016/j.jprot.2017.04.004 · Cited by 106
Ribosome Abundance Control Via the Ubiquitin–Proteasome System and Autophagy
An, H., & Harper, J. W. (2019) · Journal of Molecular Biology · doi:10.1016/j.jmb.2019.06.001 · Cited by 104
Ribosome Stoichiometry: From Form to Function
Emmott, E., Jovanović, M., & Slavov, N. (2018) · Trends in Biochemical Sciences · doi:10.1016/j.tibs.2018.10.009 · Cited by 102
Saal-Bauernschubert, L., Briese, M., Kneitz, S., Glinka, M., & Sendtner, M. (2014) · RNA · doi:10.1261/rna.047373.114 · Cited by 96
Mazaré, N., Oudart, M., Moulard, J., Cheung, G. T. Y., Tortuyaux, R., Mailly, P., Mazaud, D., Bemelmans, A., Boulay, A.-C., Blugeon, C., et al. (2020) · Cell Reports · doi:10.1016/j.celrep.2020.108076 · Cited by 90
Perez, J. D., Dieck, S. T., Alvarez‐Castelao, B., Tushev, G., Chan, I. C. W., & Schuman, E. M. (2021) · eLife · doi:10.7554/elife.63092 · Cited by 78
Self-citationMiddleton, S. A., Eberwine, J. H., & Kim, J. (2019) · BMC Biology · doi:10.1186/s12915-019-0630-z · Cited by 75
Tsurugi, K., & Ogata, K. (1985) · The Journal of Biochemistry · doi:10.1093/oxfordjournals.jbchem.a135410 · Cited by 74
Identification of yeast oxidized proteins
Mirzaei, H., & Regnier, F. E. (2006) · Journal of Chromatography A · doi:10.1016/j.chroma.2006.11.009 · Cited by 68
Ribosome reactivation by replacement of damaged proteins
Pulk, A., Liiv, A., Peil, L., Maiväli, Ü., Nierhaus, K. H., & Rèmme, J. (2009) · Molecular Microbiology · doi:10.1111/j.1365-2958.2009.07002.x · Cited by 67
Transcriptomic Analysis of Ribosome-Bound mRNA in Cortical Neurites In Vivo
Ouwenga, R., Lake, A. M., O'Brien, D., Mogha, A., Dani, A., & Dougherty, J. D. (2017) · Journal of Neuroscience · doi:10.1523/jneurosci.3044-16.2017 · Cited by 65
Johnson, A. G., Lapointe, C. P., Wang, J., Corsepius, N. C., Choi, J., Fuchs, G., & Puglisi, J. D. (2019) · RNA · doi:10.1261/rna.071217.119 · Cited by 59
Alvarez‐Castelao, B., Dieck, S. T., Fusco, C. M., Donlin-Asp, P., Perez, J. D., & Schuman, E. M. (2020) · eLife · doi:10.7554/elife.52714 · Cited by 57
Self-citationLarburu, N., Montellese, C., O’Donohue, M.-F., Kutay, U., Gleizes, P., & Plisson‐Chastang, C. (2016) · Nucleic Acids Research · doi:10.1093/nar/gkw714 · Cited by 49
Gioio, A. E., Lavina, Z. S., Jurkovičová, D., Zhang, H., Eyman, M., Giuditta, A., & Kaplan, B. B. (2004) · European Journal of Neuroscience · doi:10.1111/j.1460-9568.2004.03538.x · Cited by 47
Conservation of a core neurite transcriptome across neuronal types and species
von Kügelgen, N., & Chekulaeva, M. (2020) · Wiley Interdisciplinary Reviews - RNA · doi:10.1002/wrna.1590 · Cited by 40
Building Ribosomes: Even More Expensive Than Expected?
Granneman, S., & Tollervey, D. W. (2007) · Current Biology · doi:10.1016/j.cub.2007.04.011 · Cited by 39
Different Rates of Synthesis and Turnover of Ribosomal RNA in Rat Brain and Liver
Stoykova, A., Dudov, K. P., Dabeva, M. D., & Hadjiolov, A. A. (1983) · Journal of Neurochemistry · doi:10.1111/j.1471-4159.1983.tb09038.x · Cited by 39
Jin, A., Vetter, I., Dutertre, S., Abraham, N., Emídio, N. B., Inserra, M. C., Murali, S. S., Christie, M. J., Alewood, P. F., & Lewis, R. J. (2013) · Biochemistry · doi:10.1021/bi400882s · Cited by 30
Grimm, A., Cummins, N., & Götz, J. (2018) · iScience · doi:10.1016/j.isci.2018.07.015 · Cited by 26
Molecular Mechanisms of Selective Autophagy
Martens, S., & Behrends, C. (2019) · Journal of Molecular Biology · doi:10.1016/j.jmb.2019.11.010 · Cited by 26
Misra, M., Edmund, H., Ennis, D., Schlueter, M. A., Marot, J., Tambasco, J., Barlow, I. L., Sigurbjörnsdóttir, S., Mathew, R., Vallés, A. M., et al. (2016) · G3 Genes Genomes Genetics · doi:10.1534/g3.116.030353 · Cited by 19
Kang, K. R., & Lee, S. Y. (2001) · Experimental & Molecular Medicine · doi:10.1038/emm.2001.33 · Cited by 12
Bautista-Santos, A., & Zinker, S. (2014) · Biochemistry · doi:10.1021/bi500341w · Cited by 12
Cited by
Sorted by citations
De-centralizing the Central Dogma: mRNA translation in space and time
Bourke, A. M., Schwarz, A., & Schuman, E. M. (2023) · Molecular Cell · doi:10.1016/j.molcel.2022.12.030 · Cited by 106
Self-citationmRNA stability and m6A are major determinants of subcellular mRNA localization in neurons
Loedige, I., Baranovskii, A., Mendonsa, S., Dantsuji, S., Popitsch, N. P., Breimann, L., Zerna, N., Cherepanov, V., Milek, M., Ameres, S. L., et al. (2023) · Molecular Cell · doi:10.1016/j.molcel.2023.06.021 · Cited by 96
Chaperone-directed ribosome repair after oxidative damage
Yang, Y.-M., Jung, Y., Abegg, D., Adibekian, A., Carroll, K. S., & Karbstein, K. (2023) · Molecular Cell · doi:10.1016/j.molcel.2023.03.030 · Cited by 89
Ribosomal RNA 2′-O-methylation dynamics impact cell fate decisions
Häfner, S. J., Jansson, M., Altinel, K., Andersen, K. L., Abay-Nørgaard, Z., Ménard, P., Fontenas, M., Sørensen, D. M., Gay, D. M., Arendrup, F. S., et al. (2023) · Developmental Cell · doi:10.1016/j.devcel.2023.06.007 · Cited by 72
Piol, D., Robberechts, T., & Cruz, S. D. (2023) · Neuron · doi:10.1016/j.neuron.2023.02.028 · Cited by 68
Metadata
- Authors
- Fusco, C. M., Desch, K., Dörrbaum, A. R., Wang, M., Staab, A., Chan, I. C. W., Vail, E., Villeri, V., Langer, J. D., & Schuman, E. M.
- Affiliations
- Max Planck Institute for Brain Research (DE)
- German Center for Neurodegenerative Diseases (DE)
- Université de Bordeaux (FR)
- Max Planck Institute of Biophysics (DE)
- Corresponding author
- Schuman, Erin M.
- ORCID
- Venue
- Nature Communications
- Published
- 2021-10-21
- Volume
- 12
- Issue
- 1
- Pages
- 6127-6127
- ISSN
- 2041-1723 (ISSN-L)
- PMC
- PMC8531293
- OpenAlex
- W3207078712
- Cited by
- 157
- References
- 84
- Citations by year
- 2026: 23 · 2025: 43 · 2024: 38 · 2023: 27 · 2022: 23 · 2021: 3
- FWCI
- 7.38
- Type
- journal article
- Language
- en
- Open access
- gold
- doi.org
- Locations
- Nature Communications (publishedVersion, cc-by)
- bioRxiv (Cold Spring Harbor Laboratory) (acceptedVersion, cc-by-nc-nd)
- PubMed Central (publishedVersion, cc-by)
- PubMed (publishedVersion)
- RePEc: Research Papers in Economics (submittedVersion)
- DOAJ (DOAJ: Directory of Open Access Journals) (submittedVersion, cc-by-sa)
- DZNE Pub (submittedVersion, other-oa)
- Publication Server of Goethe University Frankfurt am Main (Goethe University Frankfurt) (submittedVersion, cc-by)
- Publication Server of Goethe University Frankfurt am Main (Goethe University Frankfurt) (submittedVersion, cc-by-nc-nd)
- Funders
- Deutsche Forschungsgemeinschaft (CRC 1080, DFG-CRC902, CRC902)
- Max-Planck-Gesellschaft (DFG CRC 1080)
- H2020 European Research Council (743216)
- Topics
- Life Sciences › Biochemistry, Genetics and Molecular Biology › Molecular Biology › RNA and protein synthesis mechanisms
- Life Sciences › Biochemistry, Genetics and Molecular Biology › Molecular Biology › RNA Research and Splicing
- Life Sciences › Neuroscience › Cellular and Molecular Neuroscience › Neuroscience and Neuropharmacology Research
- Keywords
- ribosomal proteins, local protein synthesis, dendrites, axons, neuropil, ribosome biogenesis, oxidative stress, translation machinery, ribosome profiling, metabolic labeling
- MeSH terms
- Animals, Axons, Cells, Cultured, Female, Male, Neurons, Ribosomal Proteins, Ribosomes, RNA, Messenger, Protein Biosynthesis, Neurites, Rats, Sprague-Dawley, Neuropil, Rats
About these checks
Registry, retraction, Cites and statistics results are computed, not judged, with one exception: a printed reference that no index lists is read once by a model before it counts as a citation error. Claims are extracted by a model and kept only when their quote appears verbatim in the text; each cited source is then checked, with a model’s help, for whether it says what the claim relies on. Those verdicts can be wrong — read the claim’s quote and the cited source before relying on one.
Statistics and arithmetic are recomputed, not judged.
Confidence bands are shown only for fields calibrated on our annotated test set. None is calibrated yet, so no band is shown.
What counts as a claim ›How we measure confidence ›How we check this ›
Are you an author, or do you see a problem with this page? Request a review
