

The DOI matches its Crossref record; 7 of the 7 references it cites were found in a registry or an index.
Dynamic interactions and Ca2+-binding modulate the holdase-type chaperone activity of S100B preventing tau aggregation and seeding
Abstract
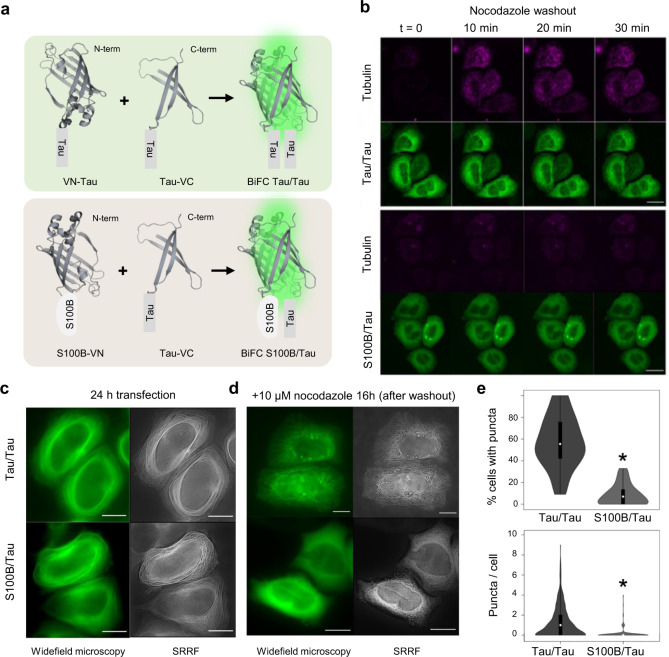
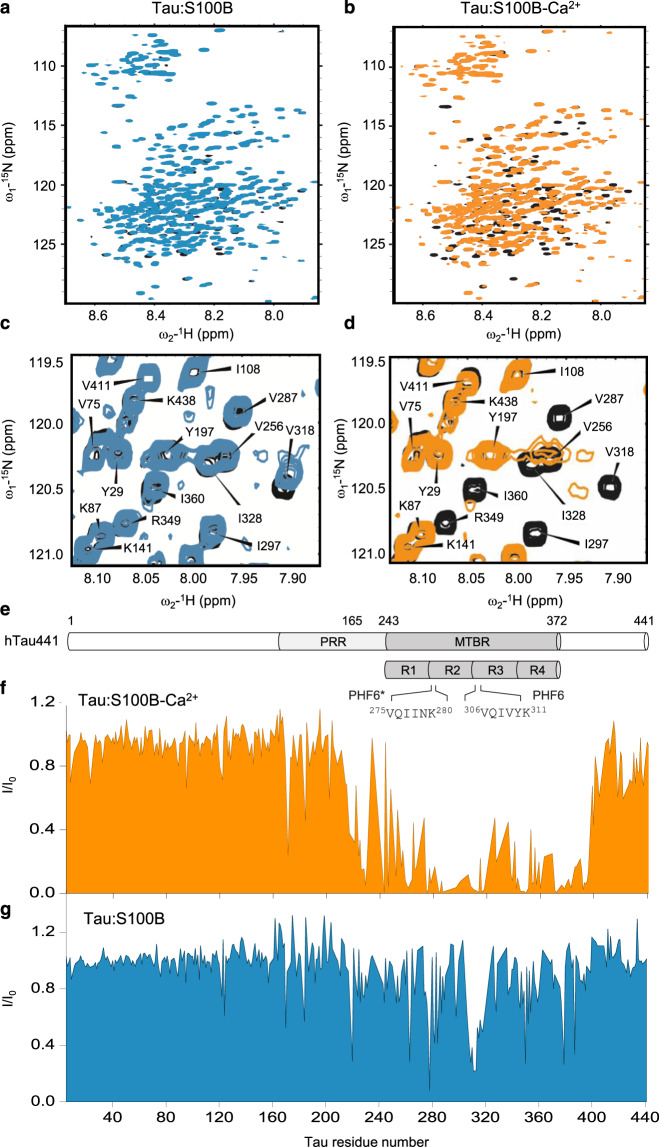
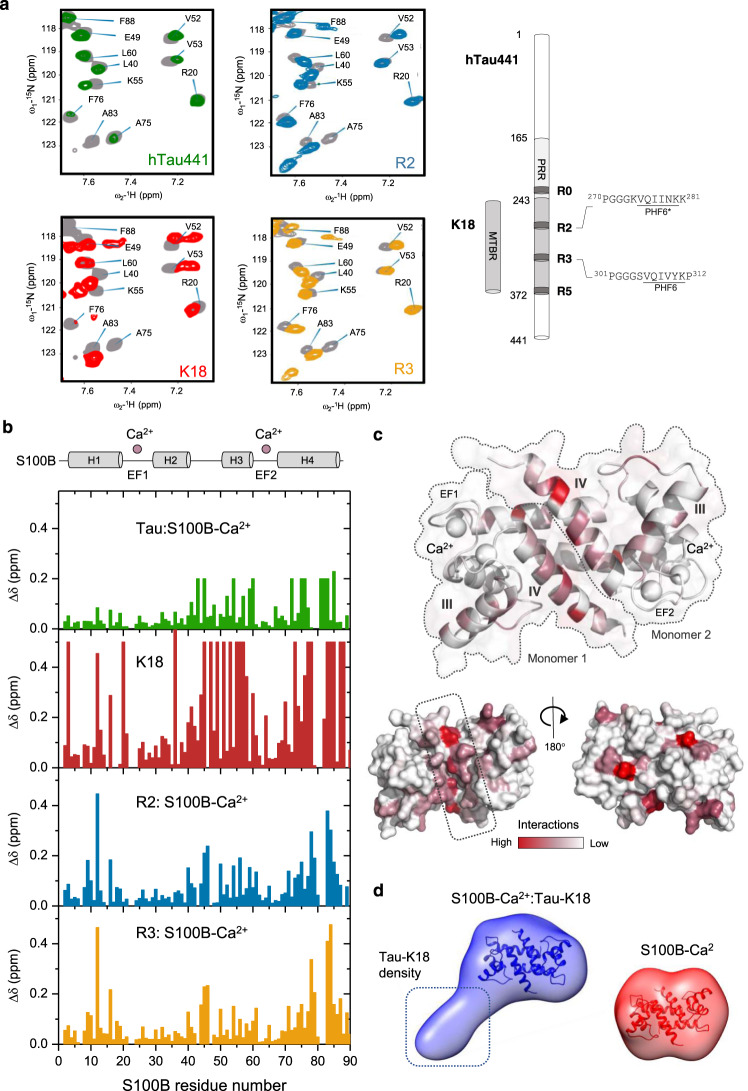
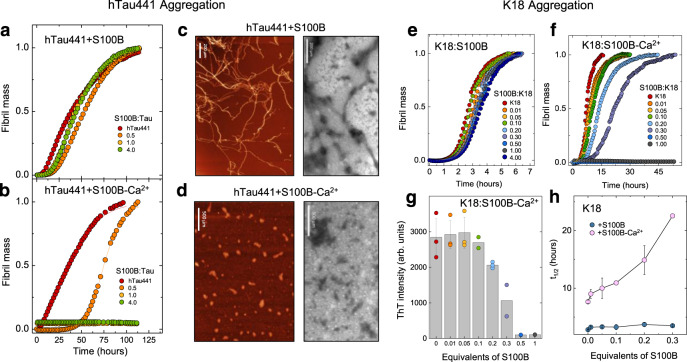
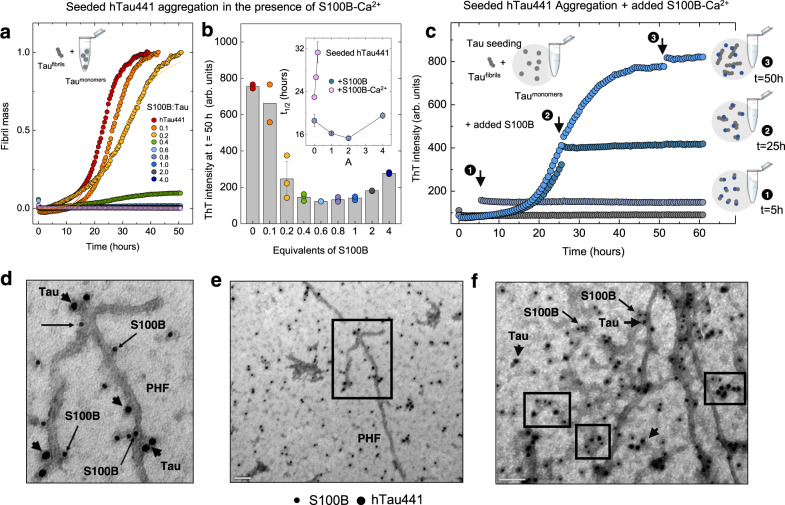
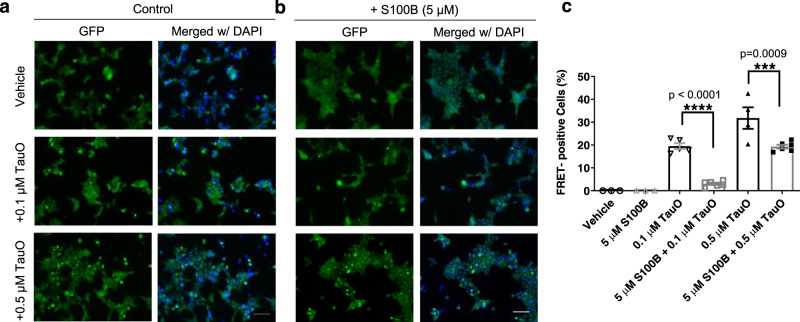
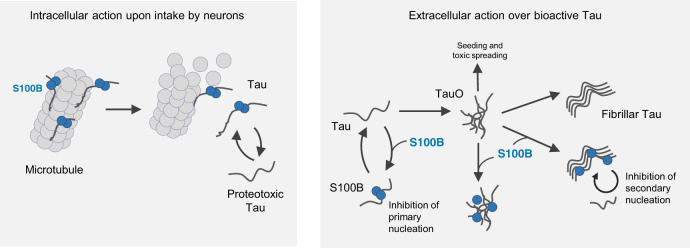
The microtubule-associated protein tau is implicated in the formation of oligomers and fibrillar aggregates that evade proteostasis control and spread from cell-to-cell. Tau pathology is accompanied by sustained neuroinflammation and, while the release of alarmin mediators aggravates disease at late stages, early inflammatory responses encompass protective functions. This is the case of the Ca 2+-binding S100B protein, an astrocytic alarmin which is augmented in AD and which has been recently implicated as a proteostasis regulator, acting over amyloid β aggregation. Here we report the activity of S100B as a suppressor of tau aggregation and seeding, operating at sub-stoichiometric conditions. We show that S100B interacts with tau in living cells even in microtubule-destabilizing conditions. Structural analysis revealed that tau undergoes dynamic interactions with S100B, in a Ca 2+-dependent manner, notably with the aggregation prone repeat segments at the microtubule binding regions. This interaction involves contacts of tau with a cleft formed at the interface of the S100B dimer. Kinetic and mechanistic analysis revealed that S100B inhibits the aggregation of both full-length tau and of the microtubule binding domain, and that this proceeds through effects over primary and secondary nucleation, as confirmed by seeding assays and direct observation of S100B binding to tau oligomers and fibrils. In agreement with a role as an extracellular chaperone and its accumulation near tau positive inclusions, we show that S100B blocks proteopathic tau seeding. Together, our findings establish tau as a client of the S100B chaperone, providing evidence for neuro-protective functions of this inflammatory mediator across different tauopathies.
Overview
The claims and statistics of this paper haven’t been checked yet.
Run the check — free, no account needed. It reads the open-access text and checks the sources it cites.
Integrity signals
Registry
Cites
Statistics
Figures
Verification
Claims the paper makes
The claims and statistics of this paper haven’t been checked yet.
Run the check — free, no account needed. It reads the open-access text and checks the sources it cites.
Claims other papers make about this one
Each is checked against this paper’s own text: does it say what the citing paper says it does?
In the citing paper
“Tau phase separation and tau oligomerization or aggregation have been linked, and an increased potential for nucleation and seeding in the condensed tau state.4,12,16,28”
From A Proline-Rich-Domain-Binding Single Domain Antibody Selectively Inhibits RNA-Induced Phase Separation of Tau (2026) · cites this paper as [28]
Self-check
Percentages, sums and reported differences re-computed from the paper’s own numbers.
The self-check needs the paper’s full text.
Citations
Cites
Protein aggregation and neurodegenerative disease
Ross, C. A., & Poirier, M. A. (2004) · Nature Medicine · doi:10.1038/nm1066 · Cited by 3,454
Tau pathology in Alzheimer disease and other tauopathies
Iqbal, K., del C. Alonso, A., Chen, S., Chohan, M. O., El-Akkad, E., Gong, C.-X., Khatoon, S., Li, B., Liu, F., Rahman, A., et al. (2005) · Biochimica et Biophysica Acta (BBA) - Molecular Basis of Disease · doi:10.1016/j.bbadis.2004.09.008 · Cited by 1,037
Goedert, M., Jakes, R., Spillantini, M. G., Hasegawa, M., Smith, M. J., & Crowther, R. A. (1996) · Nature · doi:10.1038/383550a0 · Cited by 1,036
Ambadipudi, S., Biernat, J., Riedel, D., Mandelkow, E., & Zweckstetter, M. (2017) · Nature Communications · doi:10.1038/s41467-017-00480-0 · Cited by 782
Tau stabilizes microtubules by binding at the interface between tubulin heterodimers
Kadavath, H., Hofele, R. V., Biernat, J., Kumar, S., Tepper, K., Urlaub, H., Mandelkow, E., & Zweckstetter, M. (2015) · Proceedings of the National Academy of Sciences · doi:10.1073/pnas.1504081112 · Cited by 524
Clusterin in Alzheimer’s Disease: Mechanisms, Genetics, and Lessons From Other Pathologies
Foster, E. M., Dangla-Valls, A., Lovestone, S., Ribe, E. M., & Buckley, N. J. (2019) · Frontiers in Neuroscience · doi:10.3389/fnins.2019.00164 · Cited by 381
Synaptic Tau Seeding Precedes Tau Pathology in Human Alzheimer’s Disease Brain
DeVos, S. L., Corjuc, B. T., Oakley, D. H., Nobuhara, C. K., Bannon, R. N., Chase, A., Commins, C., Gonzalez, J. A., Dooley, P. M., Frosch, M. P., et al. (2018) · Frontiers in Neuroscience · doi:10.3389/fnins.2018.00267 · Cited by 285
Research works printed but not linked: 81
- Chung, C. G., Lee, H. & Lee, S. B. Mechanisms of protein toxicity in neurodegenerative diseases. Cell Mol. Life Sci. 75, 3159–3180 (2018). · DOI · Paper page
- Barbier, P. et al. Role of tau as a microtubule-associated protein: structural and functional aspects. Front. Aging Neurosci. 11, 204 (2019). · DOI
- Guo, T., Noble, W. & Hanger, D. P. Roles of tau protein in health and disease. Acta Neuropathol. 133, 665–704 (2017). · DOI · Paper page
- Wang, Y. & Mandelkow, E. Tau in physiology and pathology. Nat. Rev. Neurosci. 17, 5–21 (2016). · DOI · Paper page
- Masters, C. L. et al. Alzheimer’s disease. Nat. Rev. Dis. Prim. 1, 15056 (2015). · DOI · Paper page
- Guzman-Martinez, L. et al. Neuroinflammation as a common feature of neurodegenerative disorders. Front. Pharm. 10, 1008 (2019). · DOI · Paper page
- Heneka, M. T. et al. Neuroinflammation in Alzheimer’s disease. Lancet Neurol. 14, 388–405 (2015). · DOI · Paper page
- Cuello, A. C. Early and late CNS inflammation in Alzheimer’s disease: two extremes of a continuum? Trends Pharm. Sci. 38, 956–966 (2017). · DOI
- Li, C. et al. Astrocytes: implications for neuroinflammatory pathogenesis of Alzheimer’s disease. Curr. Alzheimer Res. 8, 67–80 (2011). · DOI
- Donato, R. et al. S100B’s double life: intracellular regulator and extracellular signal. Biochim. Biophys. Acta 1793, 1008–1022 (2009). · DOI
- Sorci, G. et al. S100B protein, a damage-associated molecular pattern protein in the brain and heart, and beyond. Cardiovasc. Psychiatry Neurol., https://doi.org/10.1155/2010/656481 (2010). · DOI
- Goyal, A. et al. S100b as a prognostic biomarker in outcome prediction for patients with severe traumatic brain injury. J. Neurotrauma 30, 946–957 (2013). · DOI
- Hagmeyer, S. et al. Distribution and relative abundance of S100 proteins in the brain of the APP23 Alzheimer’s disease model mice. Front. Neurosci. 13, 640 (2019). · DOI
- Rothermundt, M., Peters, M., Prehn, J. H. & Arolt, V. S100B in brain damage and neurodegeneration. Microsc. Res. Tech. 60, 614–632 (2003). · DOI
- Hagmeyer, S., et al. Zinc binding to S100B affords regulation of trace metal homeostasis and excitotoxicity in the brain. Front. Mol. Neurosci. 10, 456 (2018). · DOI
- Kapurniotu, A., Gokce, O. & Bernhagen, J. The multitasking potential of alarmins and atypical chemokines. Front. Med. 6, 3 (2019). · DOI
- Donato, R. et al. Functions of S100 proteins. Curr. Mol. Med. 13, 24–57 (2013). · DOI
- Cristovao, J. S. et al. The neuronal S100B protein is a calcium-tuned suppressor of amyloid-beta aggregation. Sci. Adv. 4, eaaq1702 (2018). · DOI
- Sorci, G., Agneletti, A. L. & Donato, R. Effects of S100A1 and S100B on microtubule stability. An in vitro study using triton-cytoskeletons from astrocyte and myoblast cell lines. Neuroscience 99, 773–783 (2000). · DOI
- Donato, R. Calcium-independent, pH-regulated effects of S-100 proteins on assembly-disassembly of brain microtubule protein in vitro. J. Biol. Chem. 263, 106–110 (1988). · DOI
- Garbuglia, M. et al. The calcium-modulated proteins, S100A1 and S100B, as potential regulators of the dynamics of type III intermediate filaments. Braz. J. Med Biol. Res. 32, 1177–1185 (1999). · DOI
- Endo, T. & Hidaka, H. Effect of S-100 protein on microtubule assembly-disassembly. FEBS Lett. 161, 235–238 (1983). · DOI
- Baudier, J. & Cole, R. D. Interactions between the microtubule-associated tau proteins and S100b regulate tau phosphorylation by the Ca2+/calmodulin-dependent protein kinase II. J. Biol. Chem. 263, 5876–5883 (1988). · DOI
- Shoemaker, B. A., Portman, J. J. & Wolynes, P. G. Speeding molecular recognition by using the folding funnel: the fly-casting mechanism. Proc. Natl Acad. Sci. USA 97, 8868–8873 (2000). · DOI
- Blum, D. et al. Mutant huntingtin alters Tau phosphorylation and subcellular distribution. Hum. Mol. Genet. 24, 76–85 (2015). · DOI
- Shin, S., Lim, S., Jeong, H., Kwan, L. T. & Kim, Y. K. Visualization of Tau(-)Tubulin Interaction in a Living Cell Using Bifluorescence Complementation Technique. Int. J. Mol. Sci. 19, https://doi.org/10.3390/ijms19102978 (2018). · DOI
- Gustafsson, N. et al. Fast live-cell conventional fluorophore nanoscopy with ImageJ through super-resolution radial fluctuations. Nat. Commun. 7, 12471 (2016). · DOI
- Vasquez, R. J., Howell, B., Yvon, A. M., Wadsworth, P. & Cassimeris, L. Nanomolar concentrations of nocodazole alter microtubule dynamic instability in vivo and in vitro. Mol. Biol. Cell 8, 973–985 (1997). · DOI
- Sorci, G., Agneletti, A. L., Bianchi, R. & Donato, R. Association of S100B with intermediate filaments and microtubules in glial cells. Biochim Biophys Acta. 1448, 277–289 (1998). · DOI
- Drohat, A. C., Baldisseri, D. M., Rustandi, R. R. & Weber, D. J. Solution structure of calcium-bound rat S100B(ββ) as determined by nuclear magnetic resonance spectroscopy. Biochemistry 37, 2729–2740 (1998). · DOI
- Santamaria-Kisiel, L., Rintala-Dempsey, A. C. & Shaw, G. S. Calcium-dependent and -independent interactions of the S100 protein family. Biochem. J. 396, 201–214 (2006). · DOI
- Mok, S. A. et al. Mapping interactions with the chaperone network reveals factors that protect against tau aggregation. Nat. Struct. Mol. Biol. 25, 384–393 (2018). · DOI
- Baul, U., Chakraborty, D., Mugnai, M. L., Straub, J. E. & Thirumalai, D. Sequence effects on size, shape, and structural heterogeneity in intrinsically disordered proteins. J. Phys. Chem. B 123, 3462–3474 (2019). · DOI
- Mylonas, E. et al. Domain conformation of tau protein studied by solution small-angle X-ray scattering. Biochemistry 47, 10345–10353 (2008). · DOI · Paper page
- Rodrigues, F. E. P., Figueira, A. J., Gomes, C. M. & Machuqueiro, M. Computational analysis of the interactions between the S100B extracellular chaperone and its amyloid β peptide client. Int. J. Mol. Sci. 22, https://doi.org/10.3390/ijms22073629 (2021). · DOI
- von Bergen, M. et al. Assembly of tau protein into Alzheimer paired helical filaments depends on a local sequence motif ((306)VQIVYK(311)) forming beta structure. Proc. Natl Acad. Sci. USA 97, 5129–5134 (2000). · DOI · Paper page
- Ganguly, P. et al. Tau assembly: the dominant role of PHF6 (VQIVYK) in microtubule binding region repeat R3. J. Phys. Chem. B 119, 4582–4593 (2015). · DOI
- Sibille, N. et al. Structural impact of heparin binding to full-length Tau as studied by NMR spectroscopy. Biochemistry 45, 12560–12572 (2006). · DOI
- Moreira, G. G. et al. Zinc binding to tau influences aggregation kinetics and oligomer distribution. Int. J. Mol. Sci. 20, https://doi.org/10.3390/ijms20235979 (2019). · DOI
- Shammas, S. L. et al. A mechanistic model of tau amyloid aggregation based on direct observation of oligomers. Nat. Commun. 6, 7025 (2015). · DOI
- Meisl, G., Yang, X., Dobson, C. M., Linse, S. & Knowles, T. P. J. Modulation of electrostatic interactions to reveal a reaction network unifying the aggregation behaviour of the Abeta42 peptide and its variants. Chem. Sci. 8, 4352–4362 (2017). · DOI
- Crespo, R., Koudstaal, W. & Apetri, A. In vitro assay for studying the aggregation of tau protein and drug screening. J. Vis. Exp., https://doi.org/10.3791/58570 (2018). · DOI
- Furman, J. L., Holmes, B. B. & Diamond, M. I. Sensitive detection of proteopathic seeding activity with FRET flow cytometry. J. Vis. Exp., https://doi.org/10.3791/53205 (2015). · DOI
- Holmes, B. B. et al. Proteopathic tau seeding predicts tauopathy in vivo. Proc. Natl Acad. Sci. USA 111, E4376–E4385 (2014). · DOI · Paper page
- Bittar, A. et al. Neurotoxic tau oligomers after single versus repetitive mild traumatic brain injury. Brain Commun. 1, fcz004 (2019). · DOI · Paper page
- Sengupta, U. et al. Polymorphic alpha-Synuclein Strains modified by dopamine and docosahexaenoic acid interact differentially with tau protein. Mol. Neurobiol. 57, 2741–2765 (2020). · DOI
- Sheng, J. G., Mrak, R. E. & Griffin, W. S. S100 beta protein expression in Alzheimer disease: potential role in the pathogenesis of neuritic plaques. J. Neurosci. Res. 39, 398–404 (1994). · DOI
- Ciechanover, A. & Kwon, Y. T. Protein quality control by molecular chaperones in neurodegeneration. https://doi.org/10.3389/fnins.2017.00185 (2017). · DOI
- Nachman, E. et al. Disassembly of Tau fibrils by the human Hsp70 disaggregation machinery generates small seeding-competent species. J. Biol. Chem. 295, 9676–9690 (2020). · DOI
- Narayan, P. et al. Amyloid-beta oligomers are sequestered by both intracellular and extracellular chaperones. Biochemistry 51, 9270–9276 (2012). · DOI
- Poon, S., Treweek, T. M., Wilson, M. R., Easterbrook-Smith, S. B. & Carver, J. A. Clusterin is an extracellular chaperone that specifically interacts with slowly aggregating proteins on their off-folding pathway. FEBS Lett. 513, 259–266 (2002). · DOI
- Botelho, H. M. et al. S100A6 Amyloid Fibril Formation Is Calcium-modulated and Enhances Superoxide Dismutase-1 (SOD1) Aggregation. J. Biol. Chem. 287, 42233–42242 (2012). · DOI
- Wang, C. et al. S100A9-Driven amyloid-neuroinflammatory cascade in traumatic brain injury as a precursor state for Alzheimer’s disease. Sci. Rep. 8, 12836 (2018). · DOI
- Cristóvão, J. S. et al. The S100B alarmin is a dual-function chaperone suppressing amyloid-β oligomerization through combined zinc chelation and inhibition of protein aggregation. ACS Chem. Neurosci. 11, 2753–2760 (2020). · DOI
- Cristóvão, J. S. et al. Cu(2+)-binding to S100B triggers polymerization of disulfide cross-linked tetramers with enhanced chaperone activity against amyloid-β aggregation. Chem. Commun. 57, 379–382 (2021). · DOI
- Hagmeyer, S. et al. Distribution and relative abundance of S100 proteins in the brain of the APP23 Alzheimer’s disease model mice. Front. Neurosci. 13, https://doi.org/10.3389/fnins.2019.00640 (2019). · DOI
- Sidoryk-Wegrzynowicz, M. et al. Astrocytes in mouse models of tauopathies acquire early deficits and lose neurosupportive functions. Acta Neuropathol. Commun. 5, 89 (2017). · DOI · Paper page
- Yu, W. H. & Fraser, P. E. S100beta interaction with tau is promoted by zinc and inhibited by hyperphosphorylation in Alzheimer’s disease. J. Neurosci. 21, 2240–2246 (2001). · DOI
- Michetti, F. et al. The S100B story: from biomarker to active factor in neural injury. J. Neurochem. 148, 168–187 (2019). · DOI
- Yang, Q. et al. S-100β has a neuronal localisation in the rat hindbrain revealed by an antigen retrieval method. Brain Res. 696, 49–61 (1995). · DOI
- Lasič, E. et al. Time-dependent uptake and trafficking of vesicles capturing extracellular S100B in cultured rat astrocytes. J. Neurochem 139, 309–323 (2016). · DOI
- Santamaria-Kisiel, L., Rintala-Dempsey, A. C. & Shaw, G. S. Calcium-dependent and -independent interactions of the S100 protein family. Biochem. J. 396, 201–214 (2006). · DOI
- Zimmer, D. B., Wright Sadosky, P. & Weber, D. J. Molecular mechanisms of S100-target protein interactions. Microsc. Res. Tech. 60, 552–559 (2003). · DOI
- Rustandi, R. R., Baldisseri, D. M. & Weber, D. J. Structure of the negative regulatory domain of p53 bound to S100B(betabeta). Nat. Struct. Biol. 7, 570–574 (2000). · DOI
- Prez, K. D. & Fan, L. Structural basis for S100B interaction with its target proteins. J. Mol. Genet Med 12, 366 (2018).
- Ostendorp, T. et al. Structural and functional insights into RAGE activation by multimeric S100B. EMBO J. 26, 3868–3878 (2007). · DOI
- He, L. & Hiller, S. Frustrated interfaces facilitate dynamic interactions between native client proteins and holdase chaperones. Chembiochem 20, 2803–2806 (2019). · DOI
- Haj-Yahya, M. et al. Site-specific hyperphosphorylation inhibits, rather than promotes, tau fibrillization, seeding capacity, and its microtubule binding. Angew. Chem. Int. Ed. 59, 4059–4067 (2020). · DOI
- Laptenko, O. & Prives, C. Transcriptional regulation by p53: one protein, many possibilities. Cell death Differ. 13, 951–961 (2006). · DOI
- Fiolka, R., Shao, L., Rego, E. H., Davidson, M. W. & Gustafsson, M. G. L. Time-lapse two-color 3D imaging of live cells with doubled resolution using structured illumination. Proc. Natl Acad. Sci. USA, https://doi.org/10.1073/pnas.1119262109 (2012). · DOI
- McQuin, C. et al. CellProfiler 3.0: next-generation image processing for biology. PLoS Biol. 16, e2005970 (2018). · DOI
- Stauffer, W., Sheng, H. & Lim, H. N. EzColocalization: an ImageJ plugin for visualizing and measuring colocalization in cells and organisms. Sci. Rep. 8, 15764 (2018). · DOI
- Walsh, D. M. et al. A facile method for expression and purification of the Alzheimer’s disease-associated amyloid beta-peptide. FEBS J. 276, 1266–1281 (2009). · DOI
- Smet, C. et al. Accepting its random coil nature allows a partial NMR assignment of the neuronal tau protein. ChemBioChem 5, 1639–1646 (2004). · DOI
- Lippens, G. et al. Proline-directed random-coil chemical shift values as a tool for the NMR assignment of the tau phosphorylation sites. ChemBioChem 5, 73–78 (2004). · DOI
- Grant, T. D. Ab initio electron density determination directly from solution scattering data. Nat. Methods 15, 191–193 (2018). · DOI
- Wriggers, W. & Chacon, P. Using situs for the registration of protein structures with low-resolution bead models from X-ray solution scattering. J. Appl. Crystallogr. 34, 773–776 (2001). · DOI
- Manalastas-Cantos, K. et al. ATSAS 3.0: expanded functionality and new tools for small-angle scattering data analysis. J. Appl. Crystallogr. 54, 343–355 (2021). · DOI
- Pettersen, E. F. et al. UCSF chimera—a visualization system for exploratory research and analysis. J. Comput. Chem. 25, 1605–1612 (2004). · DOI
- Royer, C. A., Mann, C. J. & Matthews, C. R. Resolution of the fluorescence equilibrium unfolding profile of trp aporepressor using single tryptophan mutants. Protein Sci. 2, 1844–1852 (1993). · DOI
- Meisl, G. et al. Molecular mechanisms of protein aggregation from global fitting of kinetic models. Nat. Protoc. 11, 252–272 (2016). · DOI
Cited by
Liquid − liquid phase separation of tau: Driving forces, regulation, and biological implications
Li, P., Chen, J., Wang, X., Su, Z., Gao, M., & Huang, Y. (2023) · Neurobiology of Disease · doi:10.1016/j.nbd.2023.106167 · Cited by 30
Thiou, S., Martin, L., Manousaki, E., Nguyen, M., Mortelecque, J., Heidsieck, L., Cantrelle, F.-X., Blum, D., Buée-Scherrer, V., Buée, L., et al. (2026) · ACS Chemical Neuroscience · doi:10.1021/acschemneuro.6c00110 · Cited by 1
Self-citation
Metadata
- Authors
- Moreira, G. G., Cantrelle, F.-X., Quezada, A., Carvalho, F. S., Cristóvão, J. S., Sengupta, U., Puangmalai, N., Carapeto, A. P., Rodrigues, M. S., Cardoso, I., Fritz, G., Herrera, F., Kayed, R., Landrieu, I., & Gomes, C. M.
- Venue
- Nature Communications
- Published
- 2021-11-01
- Volume
- 12
- Issue
- 1
- ISSN
- 2041-1723
- PMC
- PMC8560819
- Cited by
- 47
- References
- 7
- Language
- en
About these checks
Registry, retraction, Cites and statistics results are computed, not judged, with one exception: a printed reference that no index lists is read once by a model before it counts as a citation error. Claims are extracted by a model and kept only when their quote appears verbatim in the text; each cited source is then checked, with a model’s help, for whether it says what the claim relies on. Those verdicts can be wrong — read the claim’s quote and the cited source before relying on one.
Statistics and arithmetic are recomputed, not judged.
Confidence bands are shown only for fields calibrated on our annotated test set. None is calibrated yet, so no band is shown.
What counts as a claim ›How we measure confidence ›How we check this ›
Are you an author, or do you see a problem with this page? Request a review
How to cite
Cite CoChat for the checks on this page, and the paper for its own findings.
- This page
- CoChat. (2026). Citation check: Dynamic interactions and Ca2+-binding modulate the holdase-type chaperone activity of S100B preventing tau aggregation and seeding. https://app.cochat.ai/papers/10.1038/s41467-021-26584-2
- The paper
- Moreira, G. G., Cantrelle, F.-X., Quezada, A., Carvalho, F. S., Cristóvão, J. S., Sengupta, U., Puangmalai, N., Carapeto, A. P., Rodrigues, M. S., Cardoso, I., Fritz, G., Herrera, F., Kayed, R., Landrieu, I., & Gomes, C. M. (2021). Dynamic interactions and Ca2+-binding modulate the holdase-type chaperone activity of S100B preventing tau aggregation and seeding. Nature Communications. https://doi.org/10.1038/s41467-021-26584-2
Data sources
Bibliographic data: Semantic Scholar, OpenAlex, Crossref.
Contains information from the Semantic Scholar Academic Graph Datasets, made available under the ODC Attribution License (ODC-BY 1.0).
Semantic Scholar’s data is described in: Kinney, R., et al. (2023). The Semantic Scholar Open Data Platform. arXiv:2301.10140.
