

The DOI matches its Crossref record; 108 of the 108 references it cites were found in a registry or an index.
Integrative proteogenomic characterization of hepatocellular carcinoma across etiologies and stages
Open accessAbstract
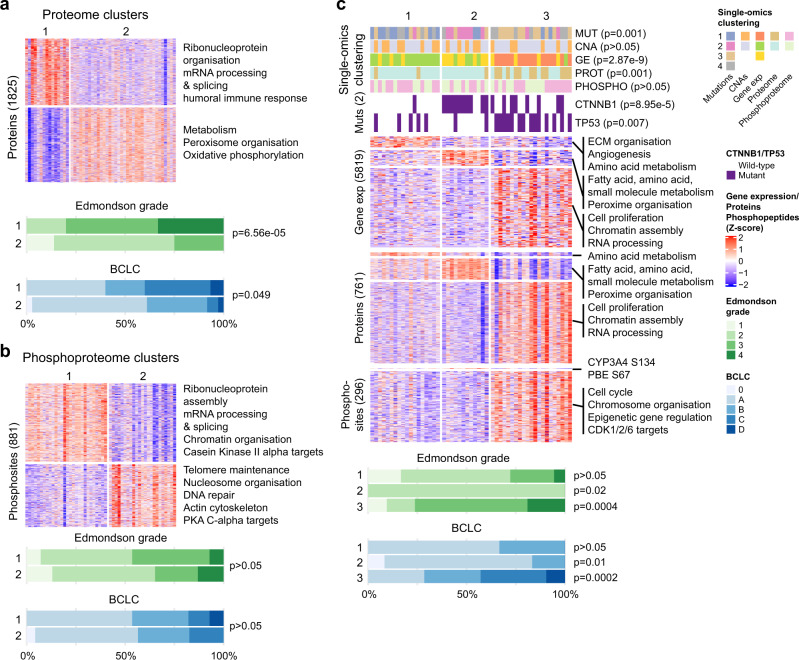
Proteogenomic analyses of hepatocellular carcinomas (HCC) have focused on early-stage, HBV-associated HCCs. Here we present an integrated proteogenomic analysis of HCCs across clinical stages and etiologies. Pathways related to cell cycle, transcriptional and translational control, signaling transduction, and metabolism are dysregulated and differentially regulated on the genomic, transcriptomic, proteomic and phosphoproteomic levels. We describe candidate copy number-driven driver genes involved in epithelial-to-mesenchymal transition, the Wnt-β-catenin, AKT/mTOR and Notch pathways, cell cycle and DNA damage regulation. The targetable aurora kinase A and CDKs are upregulated. CTNNB1 and TP53 mutations are associated with altered protein phosphorylation related to actin filament organization and lipid metabolism, respectively. Integrative proteogenomic clusters show that HCC constitutes heterogeneous subgroups with distinct regulation of biological processes, metabolic reprogramming and kinase activation. Our study provides a comprehensive overview of the proteomic and phophoproteomic landscapes of HCCs, revealing the major pathways altered in the (phospho)proteome.
Overview
The claims and statistics of this paper haven’t been checked yet.
Run the check — free, no account needed. It reads the open-access text and checks the sources it cites.
Integrity signals
Registry
Cites
Statistics
Figures
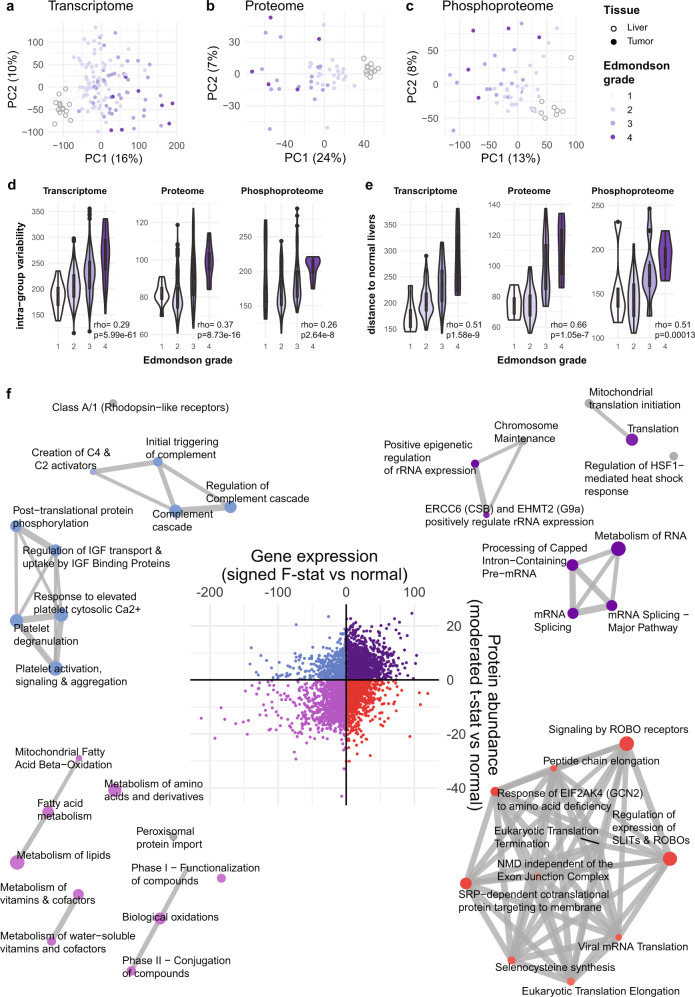
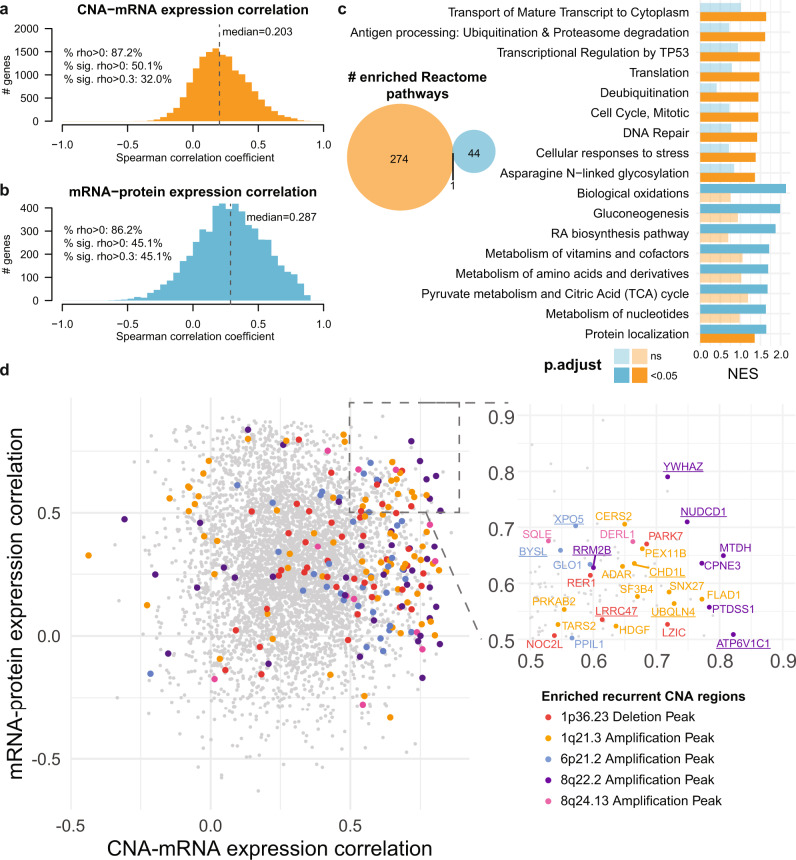
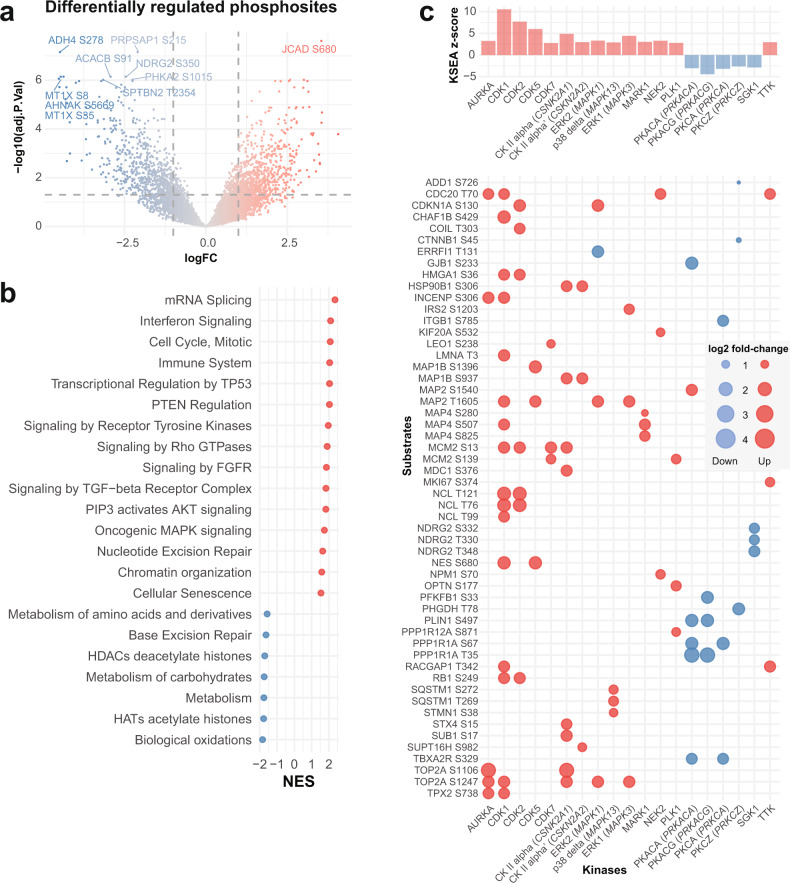
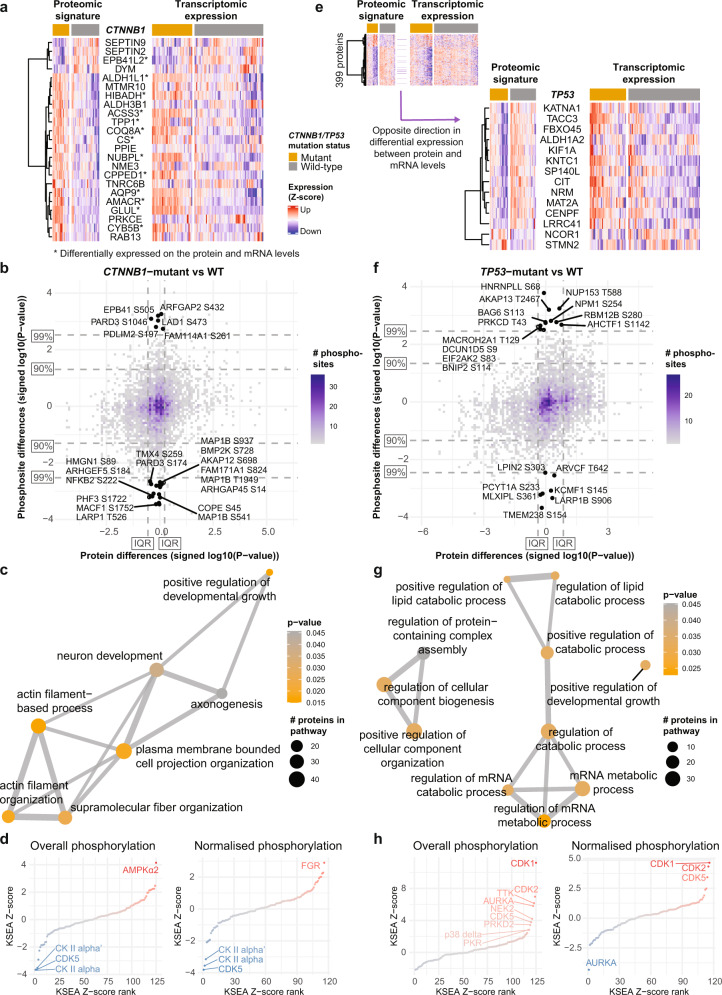
Verification
Claims the paper makes
The claims and statistics of this paper haven’t been checked yet.
Run the check — free, no account needed. It reads the open-access text and checks the sources it cites.
Claims other papers make about this one
Each is checked against this paper’s own text: does it say what the citing paper says it does?
The check wasn’t confident either way, so it gives no verdict — never disputed.
In the citing paper
“in patients with HCC, high PROX1 expression or chromosomal amplifications including PROX1 were both associated with increased survival25–32”
From Active repression of cell fate plasticity by PROX1 safeguards hepatocyte identity and prevents liver tumorigenesis (2025) · cites this paper as [29]
Experimental — accuracy not yet measuredThe check wasn’t confident either way, so it gives no verdict — never disputed.
In the citing paper
“in patients with HCC, high PROX1 expression or chromosomal amplifications including PROX1 were both associated with increased survival25–32”
From Active repression of cell fate plasticity by PROX1 safeguards hepatocyte identity and prevents liver tumorigenesis (2025) · cites this paper as [29]
Experimental — accuracy not yet measured
Self-check
Percentages, sums and reported differences re-computed from the paper’s own numbers.
The self-check needs the paper’s full text.
Citations
Cites
Fast and accurate short read alignment with Burrows-Wheeler transform
Li, H., & Durbin, R. (2009) · Bioinformatics · doi:10.1093/bioinformatics/btp324 · Cited by 58,607
STAR: ultrafast universal RNA-seq aligner
Dobin, A., Davis, C. A., Schlesinger, F., Drenkow, J., Zaleski, C., Jha, S., Batut, P., Chaisson, M., & Gingeras, T. R. (2013) · Bioinformatics · doi:10.1093/bioinformatics/bts635 · Cited by 51,709
Robinson, M. D., McCarthy, D. J., & Smyth, G. K. (2010) · Bioinformatics · doi:10.1093/bioinformatics/btp616 · Cited by 41,364
clusterProfiler: an R Package for Comparing Biological Themes Among Gene Clusters
Yu, G., Wang, L.-G., Han, Y., & He, Q.-Y. (2012) · OMICS: A Journal of Integrative Biology · doi:10.1089/omi.2011.0118 · Cited by 36,259
The Genome Analysis Toolkit: A MapReduce framework for analyzing next-generation DNA sequencing data
McKenna, A., Hanna, M., Banks, E., Sivachenko, A., Cibulskis, K., Kernytsky, A., Garimella, K., Altshuler, D., Gabriel, S., Daly, M., et al. (2010) · Genome Research · doi:10.1101/gr.107524.110 · Cited by 27,895
RSEM: accurate transcript quantification from RNA-Seq data with or without a reference genome
Li, B., & Dewey, C. N. (2011) · BMC Bioinformatics · doi:10.1186/1471-2105-12-323 · Cited by 22,179
Cerami, E., Gao, J., Dogrusoz, U., Gross, B. E., Sumer, S. O., Aksoy, B. A., Jacobsen, A., Byrne, C. J., Heuer, M. L., Larsson, E., et al. (2012) · Cancer Discovery · doi:10.1158/2159-8290.cd-12-0095 · Cited by 17,455
Cox, J., & Mann, M. (2008) · Nature Biotechnology · doi:10.1038/nbt.1511 · Cited by 14,855
EASL Clinical Practice Guidelines: Management of hepatocellular carcinoma
Galle, P. R., Forner, A., Llovet, J. M., Mazzaferro, V., Piscaglia, F., Raoul, J.-L., Schirmacher, P., & Vilgrain, V. (2018) · Journal of Hepatology · doi:10.1016/j.jhep.2018.03.019 · Cited by 11,406
Complex heatmaps reveal patterns and correlations in multidimensional genomic data
Gu, Z., Eils, R., & Schlesner, M. (2016) · Bioinformatics · doi:10.1093/bioinformatics/btw313 · Cited by 10,037
Cited by
Sorted by citations
Precision treatment in advanced hepatocellular carcinoma
Yang, X., Yang, C. G., Zhang, S., Geng, H., Zhu, A. X., Bernards, R., Qin, W., Fan, J., Wang, C., & Gao, Q. (2024) · Cancer Cell · doi:10.1016/j.ccell.2024.01.007 · Cited by 466
Arginine reprograms metabolism in liver cancer via RBM39
Mossmann, D., Müller, C., Park, S., Ryback, B. M., Colombi, M., Ritter, N., Weißenberger, D., Dazert, E., Coto‐Llerena, M., Nuciforo, S., et al. (2023) · Cell · doi:10.1016/j.cell.2023.09.011 · Cited by 309
Self-citationGreig, J. A., Martins, K. M., Breton, C. A., Lamontagne, J., Zhu, Y., He, Z., White, J., Zhu, J., Chichester, J. A., Zheng, Q., et al. (2023) · Nature Biotechnology · doi:10.1038/s41587-023-01974-7 · Cited by 157
Marcondes‐de‐Castro, I. A., Reis‐Barbosa, P. H., Marinho, T. D. S., Águila, M. B., & Mandarim‐de‐Lacerda, C. A. (2023) · Journal of Gastroenterology and Hepatology · doi:10.1111/jgh.16272 · Cited by 110
Gajos-Michniewicz, A., & Czyz, M. (2024) · Genes & Diseases · doi:10.1016/j.gendis.2023.02.050 · Cited by 89
Molecular and immune landscape of hepatocellular carcinoma to guide therapeutic decision-making
Dhanasekaran, R., Suzuki, H., Lemaitre, L., Kubota, N., & Hoshida, Y. (2023) · Hepatology · doi:10.1097/hep.0000000000000513 · Cited by 72
Xing, X., Hu, E., Ouyang, J., Zhong, X., Wang, F., Liu, K., Cai, L., Zhou, Y., Wang, Y., Chen, G., et al. (2023) · Cell Reports Medicine · doi:10.1016/j.xcrm.2023.101315 · Cited by 59
WNT/β-catenin regulatory roles on PD-(L)1 and immunotherapy responses
Mortezaee, K. (2024) · Clinical and Experimental Medicine · doi:10.1007/s10238-023-01274-z · Cited by 57
Comparison of single‑nucleus and single‑cell transcriptomes in hepatocellular carcinoma tissue
Wen, F., Tang, X., Lin, X., & Qu, H. (2022) · Molecular Medicine Reports · doi:10.3892/mmr.2022.12855 · Cited by 51
Wang, Z., Li, Y., Wang, X., Zhang, W., Chen, Y., Lu, X., Jin, C., Tu, L., Jiang, T., Yang, Y., et al. (2025) · Phytomedicine · doi:10.1016/j.phymed.2025.156796 · Cited by 50
Self-citationChen, Y., Deng, X., Li, Y., Han, Y., Peng, Y., Wu, W., Wang, X., Ma, J., Hu, E., Zhou, X., et al. (2024) · Hepatology · doi:10.1097/hep.0000000000000869 · Cited by 44
Self-citationRamirez, C. F. A., Taranto, D., Ando‐Kuri, M., de Groot, M. H. P., Tsouri, E., Huang, Z., de Groot, D., Kluin, R. J. C., Kloosterman, D. J., Verheij, J., et al. (2024) · Nature Communications · doi:10.1038/s41467-024-46835-2 · Cited by 42
Shi, Z., Duan, Y., Cui, F., Wu, Z.-J., Li, M.-P., Song, P., Peng, Q., Ye, W.-T., Yin, K.-L., Kang, M., et al. (2023) · Journal of Experimental & Clinical Cancer Research · doi:10.1186/s13046-023-02716-y · Cited by 43
Lu, Y., Xu, L., Chen, W., Liu, W., Zhang, Y., Zhou, Q., Wang, N., Zhang, Y., Bai, H., Xu, S. Q., et al. (2025) · Cancer Discovery · doi:10.1158/2159-8290.cd-24-1259 · Cited by 36
Self-citationMetabolic primary liver cancer in adults: risk factors and pathogenic mechanisms
Lugari, S., Baldelli, E., & Lonardo, A. (2023) · Metabolism and Target Organ Damage · doi:10.20517/mtod.2022.38 · Cited by 32
Huang, Y., Peng, M., Yu, W., & Li, H. (2024) · International Immunopharmacology · doi:10.1016/j.intimp.2024.112534 · Cited by 33
Transcription factors TEAD2 and E2A globally repress acetyl-CoA synthesis to promote tumorigenesis
Park, S., Mossmann, D., Chen, Q., Wang, X., Dazert, E., Colombi, M., Schmidt, A., Ryback, B. M., Ng, C. K. Y., Terracciano, L., et al. (2022) · Molecular Cell · doi:10.1016/j.molcel.2022.10.027 · Cited by 33
Self-citationYuan, H., Xu, R., Li, S., Zheng, M., Tong, Q., Xiang, M., & Zhang, Y. (2025) · MedComm · doi:10.1002/mco2.70121 · Cited by 36
Trip, D. S. L., van Oostrum, M., Memon, D., Frommelt, F., Baptista, D., Panneerselvam, K., Bradley, G., Licata, L., Hermjakob, H., Orchard, S. E., et al. (2025) · Nature Biotechnology · doi:10.1038/s41587-025-02659-z · Cited by 46
Clinical proteomics towards multiomics in cancer
Creighton, C. J. (2022) · Mass Spectrometry Reviews · doi:10.1002/mas.21827 · Cited by 26
MLL3 regulates the CDKN2A tumor suppressor locus in liver cancer
Soto‐Feliciano, Y. M., Zhu, C., Morris, J. P., Huang, C., Koche, R. P., Ho, Y.-J., Banito, A., Chen, C.-W. D., Shroff, A., Tian, S., et al. (2023) · eLife · doi:10.7554/elife.80854 · Cited by 26
Sequera, C., Grattarola, M., Cannet, F., Dobric, A., Veloso, P. M., Methia, M., Richelme, S., Kaoutari, A. E., Kousteridou, P., Debayle, D., et al. (2025) · Nature Communications · doi:10.1038/s41467-025-62934-0 · Cited by 23
Self-citationPerspectives on the Use of Toxicogenomics to Assess Environmental Risk
Portugal, J., Mansilla, S., & Piña, B. (2022) · Frontiers in Bioscience-Landmark · doi:10.31083/j.fbl2710294 · Cited by 27
Zhang, C., Zeng, Z., Zhuo, M., Luo, J., Zhuang, X.-H., Xu, J.-N., Zeng, J., Ma, J., & Lin, H. (2023) · The Oncologist · doi:10.1093/oncolo/oyad169 · Cited by 20
Jiang, H., Cannella, R., Wu, Z., Bèaufrere, A., Burgio, M. D., Sartoris, R., Wang, Y., Qin, Y., Chen, J., Chen, Y., et al. (2024) · Radiology · doi:10.1148/radiol.233471 · Cited by 19
Lim, B., Kamal, A., Gomez Ramos, B., Adrian Segarra, J. M., Ibarra, I. L., Dignas, L., Kindinger, T., Volz, K., Rahbari, M., Rahbari, N., et al. (2025) · Nature Genetics · doi:10.1038/s41588-025-02081-w · Cited by 17
Zanotti, S., Boot, G. F., Coto‐Llerena, M., Gallon, J., Hess, G. F., Soysal, S. D., Kollmar, O., Ng, C. K. Y., & Piscuoglio, S. (2022) · Frontiers in Medicine · doi:10.3389/fmed.2022.888850 · Cited by 17
Self-citationBetter, Faster, Stronger: Accelerating mRNA ‐Based Immunotherapies With Nanocarriers
Carvalho, H., Fidalgo, T. A. S., Acúrcio, R. C., Matos, A. I., Satchi‐Fainaro, R., & Florindo, H. F. (2024) · Wiley Interdisciplinary Reviews Nanomedicine and Nanobiotechnology · doi:10.1002/wnan.2017 · Cited by 16
Lv, C., He, N., Yang, J., Xiao, J., Zhang, Y., Du, J., Zuo, S., Li, H. Y., & Gu, H. (2023) · British Journal of Radiology · doi:10.1259/bjr.20220702 · Cited by 15
Multi-omics subtyping of hepatocellular carcinoma patients using a Bayesian network mixture model
Suter, P., Dazert, E., Kuipers, J., Ng, C. K. Y., Boldanova, T., Hall, M. N., Heim, M. H., & Beerenwinkel, N. (2022) · PLoS Computational Biology · doi:10.1371/journal.pcbi.1009767 · Cited by 16
Self-citationHe, J. W., Wu, F., Li, J., Deng, Q., Chen, J., Li, P., Jiang, X., Yang, K., Xu, S., Jiang, Z., et al. (2023) · Digestive and Liver Disease · doi:10.1016/j.dld.2023.05.010 · Cited by 13
Wu, T.-H., Lin, T.-Y., Yang, P., Li, W., Yeh, C., & Pan, T. (2024) · International Journal of Molecular Sciences · doi:10.3390/ijms25053073 · Cited by 13
SignalingProfiler 2.0 a network-based approach to bridge multi-omics data to phenotypic hallmarks
Venafra, V., Sacco, F., & Perfetto, L. (2024) · npj Systems Biology and Applications · doi:10.1038/s41540-024-00417-6 · Cited by 13
Sánchez-Martín, A., Sanchon-Sanchez, P., Romero, M. R., Marı́n, J. J. G., & Briz, Ó. (2023) · Biomedicine & Pharmacotherapy · doi:10.1016/j.biopha.2023.115209 · Cited by 13
Mestareehi, A. (2024) · ACS Omega · doi:10.1021/acsomega.4c01496 · Cited by 12
Multifaceted roles of lactate dehydrogenase in liver cancer (Review)
Jin, H., Liu, Q., Li, J., Zhao, S.-Y., & Tuo, B. (2025) · International Journal of Oncology · doi:10.3892/ijo.2025.5756 · Cited by 13
Chen, Q., Chen, S., & Zhao, M. D. (2025) · Journal of Hepatocellular Carcinoma · doi:10.2147/jhc.s514881 · Cited by 15
Expanding individualized therapeutic options via genoproteomics
Zhan, D., Zheng, N., Zhao, B., Cheng, F., Tang, Q., Liu, X., Wang, J., Wang, Y., Liu, H., Li, X.-L., et al. (2023) · Cancer Letters · doi:10.1016/j.canlet.2023.216123 · Cited by 10
Zhang, Y.-P., Li, N., Yang, L., Jia, W., Li, Z., Shao, Q., & Zhan, X.-Q. (2023) · The EPMA Journal · doi:10.1007/s13167-023-00335-3 · Cited by 8
Blukacz, L., Nuciforo, S., Fucile, G., Trulsson, F., Duthaler, U., Wieland, S. F., & Heim, M. H. (2024) · Hepatology Communications · doi:10.1097/hc9.0000000000000437 · Cited by 10
Self-citationIntegrative multi-omics characterization of hepatocellular carcinoma in Hispanic patients
Das, D., Wang, X., Chiu, Y., Bouamar, H., Sharkey, F. E., Lopera, J. E., Lai, Z., Weintraub, S. T., Han, X., Zou, Y., et al. (2024) · JNCI Journal of the National Cancer Institute · doi:10.1093/jnci/djae207 · Cited by 12
Self-citationInfectious Agents Induce Wnt/β-Catenin Pathway Deregulation in Primary Liver Cancers
Catalano, T., Selvaggi, F., Esposito, D. L., Cotellese, R., & Aceto, G. M. (2023) · Microorganisms · doi:10.3390/microorganisms11071632 · Cited by 10
Phosphoproteomics delineates hepatocellular carcinoma subtypes and pinpoints therapeutic targets
Zhang, Z., Zhang, Z., Zhang, Y., Li, Y., Li, K., Liu, S., Cao, J., Li, Y., Peng, X., Li, S., et al. (2025) · Hepatology · doi:10.1097/hep.0000000000001250 · Cited by 11
Self-citationProteogenomics in Cancer: Then and Now
Wang, X., Xu, Y., & Lau, A. T. Y. (2023) · Journal of Proteome Research · doi:10.1021/acs.jproteome.3c00196 · Cited by 10
Self-citationJiang, H., Wang, Y., Wen, D., Yu, R., Esa, S. S., Lv, K., Feng, Q. Z., Liu, J., Li, F., He, L., et al. (2024) · Advanced Science · doi:10.1002/advs.202306623 · Cited by 9
Lin, Y., Wang, S., Li, Z., Zhou, Y., Wang, R., Wang, Y., & Chen, Y. (2024) · Advanced Science · doi:10.1002/advs.202403451 · Cited by 8
Sheng, M., Zhang, Y., Wang, Y., Liu, W., Wang, X., Ke, T.-Y., Liu, P., Wang, S., & Shao, W. (2023) · Journal of Cancer Research and Clinical Oncology · doi:10.1007/s00432-023-05474-8 · Cited by 9
Self-citationComprehensive molecular characteristics of hepatocellular carcinoma based on multi-omics analysis
Wang, Y., Yang, W., Cai, J., Wang, F., & You, C. (2025) · BMC Cancer · doi:10.1186/s12885-025-13952-0 · Cited by 8
Su, Y., Lu, Y., An, H., Liu, J., Ye, F., Shen, J., Ni, Z., Huang, B., & Lin, J. (2023) · ACS Pharmacology & Translational Science · doi:10.1021/acsptsci.3c00114 · Cited by 8
Fan, M., Hu, J., Xu, X., Chen, J., Zhang, W., Zheng, X., Pan, J., Xu, W., & Feng, S. (2024) · Heliyon · doi:10.1016/j.heliyon.2024.e38182 · Cited by 7
Hernandez, R., García-Rodríguez, N., Arriaga, M. A., Pérez, R., Bala, A. A., Leandro, A., Diego, V. P., Almeida, M., Parsons, J., Manusov, E., et al. (2025) · Frontiers in Medicine · doi:10.3389/fmed.2025.1513598 · Cited by 7
Fu, Y., Bonifacio-Mundaca, J., Desterke, C., Casafont, Í., & Mata-Garrido, J. (2025) · Genes · doi:10.3390/genes16080920 · Cited by 7
The impact of metabolic reprogramming in hepatocellular carcinoma on T cell
Liao, D., An, X., Huang, G., & Yuan, T.-L. (2025) · Frontiers in Immunology · doi:10.3389/fimmu.2025.1696113 · Cited by 9
Zhou, Y., Chen, R., Zheng, S., Li, X., Zhou, Y., & Zhou, J. (2023) · Frontiers in Immunology · doi:10.3389/fimmu.2023.1076587 · Cited by 7
He, J., Hu, X., Chen, L., & Jiang, Y. (2025) · Hepatoma Research · doi:10.20517/2394-5079.2024.124 · Cited by 7
Ye, J., Pang, Y., Yang, X., Zhang, C., Shi, L., Chen, Z., Huang, G., Wang, X., & Lu, F. (2023) · Aging · doi:10.18632/aging.205134 · Cited by 7
Self-citationWang, J., & Zhu, G. (2023) · Heliyon · doi:10.1016/j.heliyon.2023.e22382 · Cited by 7
Hermán‐Sánchez, N., del Río-Moreno, M., Ciria, R., Sánchez‐Frías, M., Fernández‐Barrena, M. G., Uriarte, I., Chicano‐Gálvez, E., Ortea, I., Peralbo‐Molina, Á., Briceño, J., et al. (2025) · Molecular Cancer · doi:10.1186/s12943-024-02206-5 · Cited by 6
Advancing liver cancer diagnosis and treatment with multi-omics approaches: a systematic review
Hashem, E. M., Karrar, A., & Mabrouk, M. S. (2025) · Discover Oncology · doi:10.1007/s12672-025-03623-8 · Cited by 6
Li, C., Jia, Y., Li, N., Zhou, Q., Liu, R., & Wang, Q. (2023) · Aging · doi:10.18632/aging.204899 · Cited by 6
Albadawi, H., Zhang, Z., Keum, H., Çevik, E., Nagalo, B. M., Gunduz, S. G., Kita, H., & Öklü, R. (2024) · Advanced Materials · doi:10.1002/adma.202406080 · Cited by 6
Lu, K., Yuan, X., Zhao, L., Wang, B., & Zhang, Y. (2023) · Frontiers in Genetics · doi:10.3389/fgene.2022.996180 · Cited by 6
Naveed, M., Jamil, H., Aziz, T. A., Makhdoom, S. I., Alamri, A. S., Alhomrani, M., Kassim, R. M. T., Shaer, N. A., Barqawi, A. A., & Al-Abbas, N. S. (2023) · Journal of Computational Biophysics and Chemistry · doi:10.1142/s2737416523500643 · Cited by 6
A gene mutation-based risk model for prognostic prediction in liver metastases
Yu, B., Zhang, N., Feng, Y., Xu, W., Zhang, T., & Wang, L. (2023) · BMC Genomics · doi:10.1186/s12864-023-09595-9 · Cited by 5
Kaldjob-Heinrich, L., Nuciforo, S., Lemke, S., Stahl, A., Czemmel, S., Babaei, S., Blukacz, L., Meier, M., Zhang, Y., Schürch, C. M., et al. (2024) · Gastro Hep Advances · doi:10.1016/j.gastha.2024.11.006 · Cited by 5
Self-citationPrakash, A., Collins, A., Haim-Vilmovsky, L., Fexova, S. K., Jones, A. R., & Vizcaíno, J. A. (2025) · Journal of Proteome Research · doi:10.1021/acs.jproteome.4c00788 · Cited by 5
Long, H., Zhou, J., Zhou, C., Xie, S., Wang, J., Tan, M., & Xu, J. (2025) · Biomedicines · doi:10.3390/biomedicines13010152 · Cited by 5
Zhou, T., Han, X., Xiao, C., Lei, X., Lan, X., Wei, X., Liang, Y., & Wu, H. (2025) · European Radiology · doi:10.1007/s00330-024-11344-9 · Cited by 5
Wang, M., Li, Y., Su, J., Dong, X., Liu, A., Yang, Y., Tang, X., Chen, R., Li, Q., Wang, H., et al. (2025) · Journal of Translational Medicine · doi:10.1186/s12967-025-06333-5 · Cited by 5
Genomic and immune landscape in hepatocellular carcinoma: Implications for personalized therapeutics
Zheng, J., Chen, J., Wang, S., Yang, D., & Zhou, P. (2023) · Environmental Toxicology · doi:10.1002/tox.24062 · Cited by 5
An atlas of protein-protein associations of human tissues prioritizes candidate disease genesPreprint
Trip, D. S. L., van Oostrum, M., Memon, D., Frommelt, F., Baptista, D., Panneerselvam, K., Bradley, G., Licata, L., Hermjakob, H., Orchard, S. E., et al. (2024) · bioRxiv (Cold Spring Harbor Laboratory) · doi:10.1101/2024.05.15.594301 · Cited by 5
Advances in Multi-Omics Research on Biomarkers of Intrahepatic Cholangiocarcinoma
Yang, J., Na, J., Shi, T., & Liu, X. (2025) · Current Issues in Molecular Biology · doi:10.3390/cimb47110905 · Cited by 4
Shen, F., Liu, Y., Ruan, X., Yan, G., Zhang, L., Fang, J., Lu, H., Hu, Z., & Zhou, X. (2026) · Analytical Chemistry · doi:10.1021/acs.analchem.5c07096 · Cited by 5
Zhang, Y., Yao, L., Chung, C., Huang, Y., Li, S., Zhang, W., Pang, Y., & Lee, T.-Y. (2024) · iScience · doi:10.1016/j.isci.2024.109333 · Cited by 4
Effects of drug-induced liver injury on the in vivo fate of liposomes
Liu, M., Wu, E., Pan, F., Tian, K., Fu, J., Yu, Y., Guo, Z., Ma, Y., Wei, A., Yu, X., et al. (2024) · European Journal of Pharmaceutics and Biopharmaceutics · doi:10.1016/j.ejpb.2024.114389 · Cited by 5
Wang, L.-X., Zhao, Z.-M., Shu, K., & Ma, M.-Y. (2024) · International Journal of Molecular Sciences · doi:10.3390/ijms26010118 · Cited by 4
Kou, Q., Wu, Z., Zhao, W., Liu, Z., Qiao, S., Mu, Q., & Zhang, X. (2025) · Scientific Reports · doi:10.1038/s41598-025-09010-1 · Cited by 4
Liu, Z., Yuan, H., Wang, Y., Li, K., Suo, C., Li, J., Ding, C., & Chen, X. (2024) · Journal of Proteome Research · doi:10.1021/acs.jproteome.4c00397 · Cited by 6
Venhuizen, A. J., van Os, Y., Kaptein, M. L., Aarts, M. T., Xanthakis, D., Jordens, I., & Maurice, M. M. (2025) · iScience · doi:10.1016/j.isci.2025.114501 · Cited by 3
Li, F., Hu, B., Zhang, L., Liu, Y., Wang, J., Wu, C., Wu, S., Zhang, Y., Yang, X., & Lu, H. (2024) · iScience · doi:10.1016/j.isci.2024.111657 · Cited by 4
Advancements in proteogenomics for preclinical targeted cancer therapy research
Suo, Y., Song, Y., Wang, Y., Liu, Q., Rodriguez, H., & Zhou, H. (2025) · Biophysics Reports · doi:10.52601/bpr.2024.240053 · Cited by 3
Chen, J., Yang, Z., Cui, Y., Zhao, Z., Deng, D., Fu, Z., & Zhang, X. (2025) · Journal of Cancer Research and Clinical Oncology · doi:10.1007/s00432-025-06202-0 · Cited by 3
Chen, Z., Luo, J., Ye, Y., & Dang, Y. (2023) · Translational Cancer Research · doi:10.21037/tcr-22-2304 · Cited by 3
Todorović, N., & Amedei, A. (2024) · World Journal of Gastroenterology · doi:10.3748/wjg.v30.i20.2624 · Cited by 3
Cheng, C. C. Y., Cheung, M. F., Lee, A. Y., Wu, Q., Chow, S. H.-C., Ang, J. Y. J., Riquelme Medina, I., Lo, G., Wu, H., Yang, W., et al. (2025) · Communications Biology · doi:10.1038/s42003-025-09154-w · Cited by 3
Peng, N., Lin, Q., Huang, X., & Yu, X. (2025) · Microbial Pathogenesis · doi:10.1016/j.micpath.2025.107837 · Cited by 2
Li, L., Jing Hua, H. U., Yang, W. J., & Li, J. (2025) · Journal of Controlled Release · doi:10.1016/j.jconrel.2025.114495 · Cited by 2
Pan, L., Hirsch, T., Fang, J., Seretny, A., Imbeaud, S., Jin, S., Gege, O. O., Rebouissou, S., Sidali, S., Ammiche, N., et al. (2026) · Nature Communications · doi:10.1038/s41467-026-73212-y · Cited by 1
Huo, H., Wang, X., Xu, S., Niu, X., Cheng, L., Yuan, Z., Huo, S., & Fang, P. (2023) · Oncology Letters · doi:10.3892/ol.2023.14052 · Cited by 2
Self-citationMeng, L., Wang, B., Zhang, S., Zhang, S., Cai, T., Ding, C., & Yan, Y. (2024) · Microchemical Journal · doi:10.1016/j.microc.2024.110511 · Cited by 2
Roy, S., Harish, V., Mohd, S., & Singh, S. K. (2024) · Advanced Therapeutics · doi:10.1002/adtp.202400126 · Cited by 2
Garcia, C. J. C., Grisetti, L., Tiribelli, C., & Pascut, D. (2024) · Life · doi:10.3390/life14111430 · Cited by 2
Yan, S., Fu, P., Zhu, Y., Li, H., Shan, R., & Gong, B. (2024) · Microbial Pathogenesis · doi:10.1016/j.micpath.2024.107248 · Cited by 2
Tracing specificity of immune landscape remodeling associated with distinct anticancer treatments
Cannet, F., Sequera, C., Veloso, P. M., Kaoutari, A. E., Methia, M., Richelme, S., Kaya, M., Cherni, A., Dupont, M., Borg, J., et al. (2025) · iScience · doi:10.1016/j.isci.2025.112071 · Cited by 2
Zhang, X., Xie, J., He, D., Yan, X., & Chen, J. (2023) · Cells · doi:10.3390/cells12010202 · Cited by 2
Liu, Y., Fan, Y., Gong, R., Qiu, M., Wei, X., Lin, Q., Zhou, Z., Cao, J., Jiang, Y., Chen, P., et al. (2024) · Clinical & Translational Oncology · doi:10.1007/s12094-024-03634-x · Cited by 2
SignalingProfiler 2.0: a network-based approach to bridge multi-omics data to phenotypic hallmarksPreprint
Venafra, V., Sacco, F., & Perfetto, L. (2024) · bioRxiv (Cold Spring Harbor Laboratory) · doi:10.1101/2024.01.25.577229 · Cited by 2
TLK2 promotes progression of hepatocellular carcinoma through Wnt/β-catenin signaling
He, T., Xu, B., & Ma, H. (2024) · Translational Cancer Research · doi:10.21037/tcr-23-2264 · Cited by 1
Wang, C.-H., Wang, H., Wang, X., Xing, X.-H., Wu, Y., Luo, M.-M., Pan, Y.-F., Dong, L., Tan, Y., Huang, H., et al. (2025) · Scientia Sinica Chimica · doi:10.1360/ssc-2025-0009 · Cited by 1
Self-citationChen, Y., Zhou, Y., Li, P., & Ding, B. (2025) · EngMedicine · doi:10.1016/j.engmed.2025.100070 · Cited by 1
Metadata
- Authors
- Ng, C. K. Y., Dazert, E., Boldanova, T., Coto-Llerena, M., Nuciforo, S., Ercan, C., Suslov, A., Meier, M.-A., Bock, T., Schmidt, A., Ketterer, S., Wang, X., Wieland, S., Matter, M. S., Colombi, M., Piscuoglio, S., Terracciano, L. M., Hall, M. N., & Heim, M. H.
- Affiliations
- University of Bern (CH)
- University of Basel (CH)
- Humanitas University (IT)
- Corresponding author
- Heim, Markus H.
- ORCID
- Venue
- Nature Communications
- Published
- 2022-05-04
- Volume
- 13
- Issue
- 1
- Pages
- 2436-2436
- ISSN
- 2041-1723 (ISSN-L)
- PMC
- PMC9068765
- OpenAlex
- W4225410183
- Cited by
- 165
- References
- 108
- Citations by year
- 2026: 28 · 2025: 47 · 2024: 43 · 2023: 37 · 2022: 10
- FWCI
- 5.97
- Type
- journal article
- Language
- en
- Open access
- gold
- doi.org
- Locations
- Nature Communications (publishedVersion, cc-by)
- PubMed Central (publishedVersion, cc-by)
- PubMed (publishedVersion)
- edoc (University of Basel) (acceptedVersion)
- RePEc: Research Papers in Economics (submittedVersion)
- Bern Open Repository and Information System (University of Bern) (submittedVersion, cc-by)
- DOAJ (DOAJ: Directory of Open Access Journals) (submittedVersion, cc-by-sa)
- edoc (University of Basel)
- Funders
- Universität Basel
- Universitätsspital Basel
- Eidgenössische Technische Hochschule Zürich
- Associazione Italiana per la Ricerca sul Cancro (IG 2019—ID, IG-2019)
- Swiss Cancer Research Foundation (KFS-4543-08-2018, KFS-4988-02-2020-R)
- FP7 Ideas: European Research Council (609883)
- Topics
- Health Sciences › Medicine › Hepatology › Hepatocellular Carcinoma Treatment and Prognosis
- Physical Sciences › Chemistry › Spectroscopy › Advanced Proteomics Techniques and Applications
- Life Sciences › Biochemistry, Genetics and Molecular Biology › Cancer Research › Cancer Genomics and Diagnostics
- Keywords
- hepatocellular carcinoma, proteogenomics, phosphoproteomics, cancer etiology, tumor stage, epithelial-mesenchymal transition, Wnt/β-catenin signaling, Akt/mTOR signaling, Notch signaling, cell cycle regulation, DNA damage response, metabolic reprogramming, AURKA, cyclin-dependent kinases, CTNNB1 mutation, TP53 mutation, protein phosphorylation, tumor heterogeneity, driver genes
- MeSH terms
- Proteogenomics, Carcinoma, Hepatocellular, Humans, Liver Neoplasms, Mutation, Proteomics, beta Catenin
About these checks
Registry, retraction, Cites and statistics results are computed, not judged, with one exception: a printed reference that no index lists is read once by a model before it counts as a citation error. Claims are extracted by a model and kept only when their quote appears verbatim in the text; each cited source is then checked, with a model’s help, for whether it says what the claim relies on. Those verdicts can be wrong — read the claim’s quote and the cited source before relying on one.
Statistics and arithmetic are recomputed, not judged.
Confidence bands are shown only for fields calibrated on our annotated test set. None is calibrated yet, so no band is shown.
What counts as a claim ›How we measure confidence ›How we check this ›
Are you an author, or do you see a problem with this page? Request a review
