

The DOI matches its Crossref record; 3 of the 3 references it cites were found in a registry or an index.
Regulation of age-associated insulin resistance by MT1-MMP-mediated cleavage of insulin receptor
Abstract
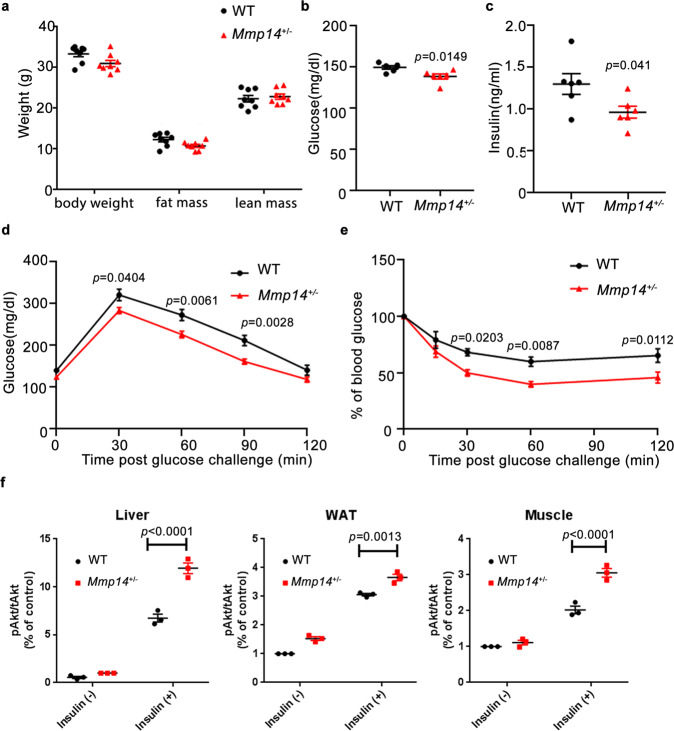
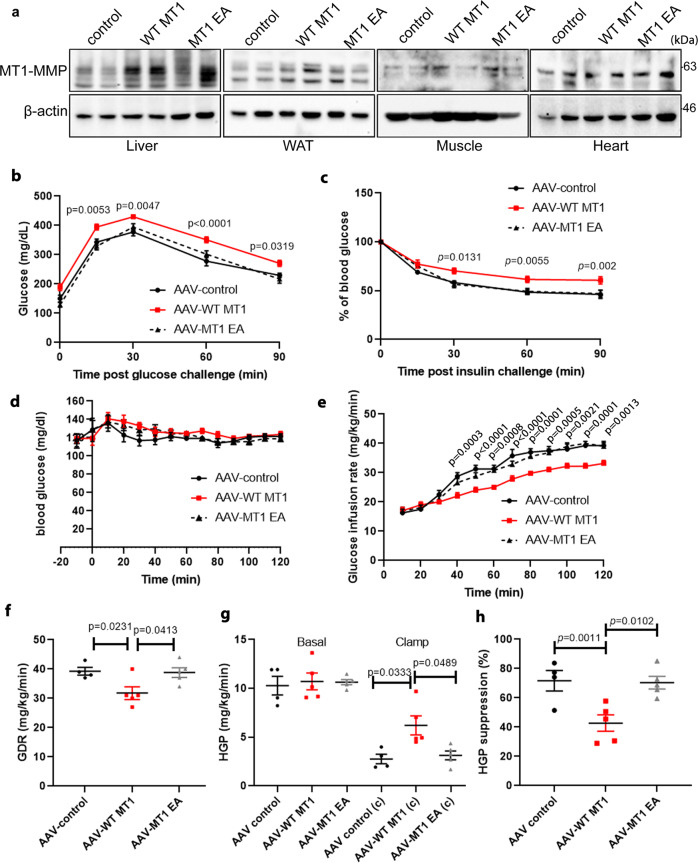
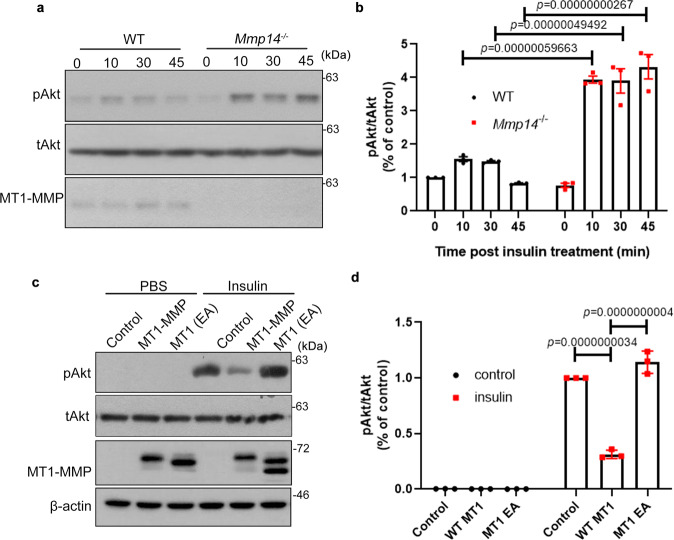
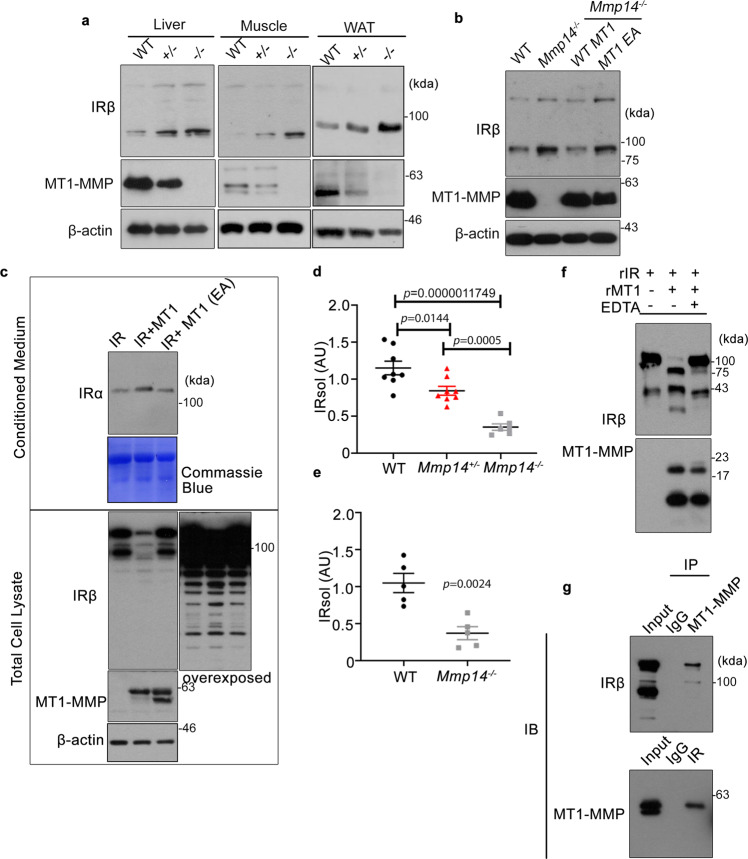
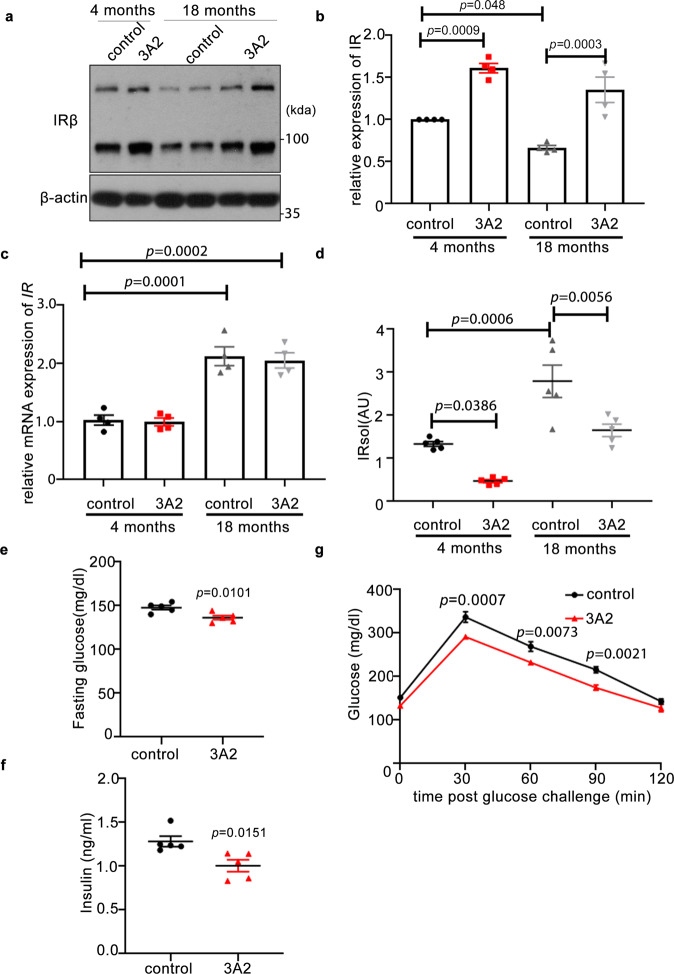
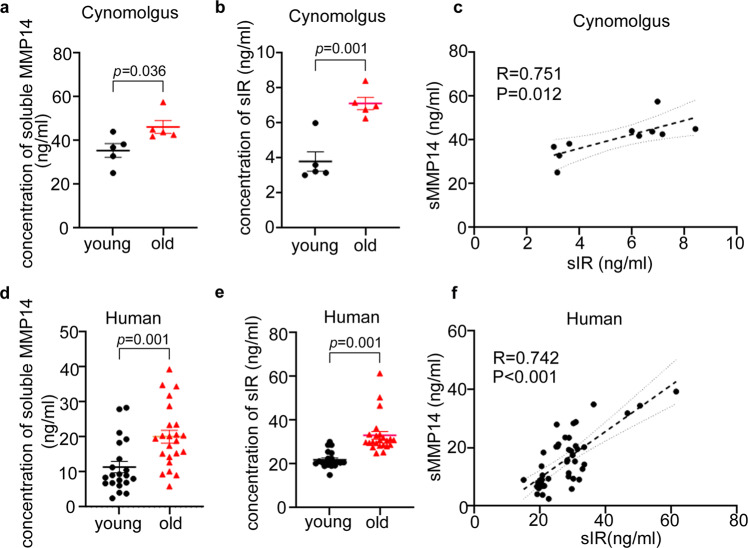
Insulin sensitivity progressively declines with age. Currently, the mechanism underlying age-associated insulin resistance remains unknown. Here, we identify membrane-bound matrix metalloproteinase 14 (MT1-MMP/MMP14) as a central regulator of insulin sensitivity during ageing. Ageing promotes MMP14 activation in insulin-sensitive tissues, which cleaves Insulin Receptor to suppress insulin signaling. MT1-MMP inhibition restores Insulin Receptor expression, improving insulin sensitivity in aged mice. The cleavage of Insulin Receptor by MT1-MMP also contributes to obesity-induced insulin resistance and inhibition of MT1-MMP activities normalizes metabolic dysfunctions in diabetic mouse models. Conversely, overexpression of MT1-MMP in the liver reduces the level of Insulin Receptor, impairing hepatic insulin sensitivity in young mice. The soluble Insulin Receptor and circulating MT1-MMP are positively correlated in plasma from aged human subjects and non-human primates. Our findings provide mechanistic insights into regulation of insulin sensitivity during physiological ageing and highlight MT1-MMP as a promising target for therapeutic avenue against diabetes.
Overview
The claims and statistics of this paper haven’t been checked yet.
Run the check — free, no account needed. It reads the open-access text and checks the sources it cites.
Integrity signals
Registry
Cites
Statistics
Figures
Verification
Claims the paper makes
The claims and statistics of this paper haven’t been checked yet.
Run the check — free, no account needed. It reads the open-access text and checks the sources it cites.
Claims other papers make about this one
Each is checked against this paper’s own text: does it say what the citing paper says it does?
The source backs part of the claim, not all of it — or backs it for a different population, condition or comparison.
In the citing paper
“Systemic inhibition of MT1-MMP or specific deletion of MT1-MMP in GFRAL+ brainstem neurons confers protections against diet-induced obesity in mice15,17.”
From MT1-MMP inhibition rejuvenates ageing brain and rescues cognitive deficits in obesity (2025) · cites this paper as [17]
Experimental — accuracy not yet measuredThe cited source says what the claim attributes to it.
In the citing paper
“In line with our previous studies with Mmp14+/− mice15,17, we found that systemic inhibition of MT1-MMP also improved metabolic functions in aged mice.”
From MT1-MMP inhibition rejuvenates ageing brain and rescues cognitive deficits in obesity (2025) · cites this paper as [17]
The cited source says what the claim attributes to it.
In the citing paper
“preliminary evidence suggests that MT1-MMP inhibition would not result in developmental defects under physiological conditions, as Mmp14 heterozygous mice do not exhibit any gross phenotypes during aging.”
From MT1-MMP inhibition rejuvenates ageing brain and rescues cognitive deficits in obesity (2025) · cites this paper as [17]
In the citing paper
“Consistent with our previous studies with Mmp14+/− mice15,17, systemic inhibition of MT1-MMP also improved metabolic functions in obese mice as evidenced by the reductions in body weight, blood glucose, TG, and total cholesterol (Supplementary Fig. S8f–i).”
From MT1-MMP inhibition rejuvenates ageing brain and rescues cognitive deficits in obesity (2025) · cites this paper as [17]
In the citing paper
“Our previous studies revealed a significant increase in sMT1-MMP levels with increasing age in mice, cynomolgus macaques, and humans16,17.”
From MT1-MMP inhibition rejuvenates ageing brain and rescues cognitive deficits in obesity (2025) · cites this paper as [17]
In the citing paper
“Our recent findings, along with those of other studies, demonstrate that MT1-MMP is a key regulator of energy homeostasis and that a series of proteolytic events mediated by MT1-MMP contribute to the pathogenesis of multiple age-associated metabolic disorders, including obesity, diabetes, and atherosclerosis15–17.”
From MT1-MMP inhibition rejuvenates ageing brain and rescues cognitive deficits in obesity (2025) · cites this paper as [17]
In the citing paper
“Our previous studies have shown that MT1-MMP controls non-homeostatic body weight by restraining the anorectic effect of growth differentiation factor 15 (GDF15)-mediated GFRAL signaling.”
From MT1-MMP inhibition rejuvenates ageing brain and rescues cognitive deficits in obesity (2025) · cites this paper as [17]
In the citing paper
“In fact, our previous studies, along with the current findings, demonstrate that genetic ablation or pharmacological inhibition of MT1-MMP confers protection against multiple age-associated disorders, including cognitive decline, obesity, and diabetes, without adverse effects15–17.”
From MT1-MMP inhibition rejuvenates ageing brain and rescues cognitive deficits in obesity (2025) · cites this paper as [17]
In the citing paper
“The specificity of this blocking antibody has been well-characterized in our previous studies, in which we showed that blocking the activity of MT1-MMP with this antibody effectively promotes body weight loss in obesity, improves metabolic functions in diabetes, and promotes viral clearance in SARS-CoV-2-infected mice13,15–17.”
From MT1-MMP inhibition rejuvenates ageing brain and rescues cognitive deficits in obesity (2025) · cites this paper as [17]
Self-check
Percentages, sums and reported differences re-computed from the paper’s own numbers.
The self-check needs the paper’s full text.
Citations
Cites
Samuel, V. T., Liu, Z.-X., Wang, A., Beddow, S. A., Geisler, J. G., Kahn, M., Zhang, X.-M., Monia, B. P., Bhanot, S., & Shulman, G. I. (2007) · Journal of Clinical Investigation · doi:10.1172/jci30400 · Cited by 497
Caro, J. F., Sinha, M. K., Raju, S. M., Ittoop, O., Pories, W. J., Flickinger, E. G., Meelheim, D., & Dohm, G. L. (1987) · Journal of Clinical Investigation · doi:10.1172/jci112958 · Cited by 341
Genetic Link Between Obesity and MMP14-Dependent Adipogenic Collagen Turnover
Chun, T.-H., Inoue, M., Morisaki, H., Yamanaka, I., Miyamoto, Y., Okamura, T., Sato-Kusubata, K., & Weiss, S. J. (2010) · Diabetes · doi:10.2337/db10-0073 · Cited by 97
Research works printed but not linked: 17
- Frojdo, S., Vidal, H. & Pirola, L. Alterations of insulin signaling in type 2 diabetes: a review of the current evidence from humans. Biochim Biophys. Acta 1792, 83–92 (2009). · DOI
- Olefsky, J. M., Kolterman, O. G. & Scarlett, J. A. Insulin action and resistance in obesity and noninsulin-dependent type II diabetes mellitus. Am. J. Physiol. 243, E15–E30 (1982).
- Meakin, P. J. et al. The beta secretase BACE1 regulates the expression of insulin receptor in the liver. Nat. Commun. 9, 1306 (2018). · DOI · Paper page
- Maesako, M. et al. Effect of glycogen synthase kinase 3 beta-mediated presenilin 1 phosphorylation on amyloid beta production is negatively regulated by insulin receptor cleavage. Neuroscience 177, 298–307 (2011). · DOI
- Yuasa, T. et al. Sequential cleavage of insulin receptor by calpain 2 and gamma-secretase impairs insulin signalling. Diabetologia 59, 2711–2721 (2016). · DOI
- Soluble Insulin Receptor Study, G. Soluble insulin receptor ectodomain is elevated in the plasma of patients with diabetes. Diabetes 56, 2028–2035 (2007). · DOI
- Holmbeck, K. et al. MT1-MMP-deficient mice develop dwarfism, osteopenia, arthritis, and connective tissue disease due to inadequate collagen turnover. Cell 99, 81–92 (1999). · DOI · Paper page
- Zhou, Z. et al. Impaired endochondral ossification and angiogenesis in mice deficient in membrane-type matrix metalloproteinase I. Proc. Natl Acad. Sci. USA 97, 4052–4057 (2000). · DOI · Paper page
- Gutierrez-Fernandez, A. et al. Loss of MT1-MMP causes cell senescence and nuclear defects which can be reversed by retinoic acid. EMBO J. 34, 1875–1888 (2015). · DOI · Paper page
- Mori, H. et al. New insight into the role of MMP14 in metabolic balance. PeerJ 4, e2142 (2016). · DOI
- Frankwich, K. et al. Proof of concept: matrix metalloproteinase inhibitor decreases inflammation and improves muscle insulin sensitivity in people with type 2 diabetes. J. Inflamm. (Lond.) 9, 35 (2012). · DOI
- Chow, C.F.W. et al. Body weight regulation via MT1-MMP-mediated cleavage of GFRAL. Nat. Metab. 4, 203–212 (2022). · DOI · Paper page
- Nam, D. H., Rodriguez, C., Remacle, A. G., Strongin, A. Y. & Ge, X. Active-site MMP-selective antibody inhibitors discovered from convex paratope synthetic libraries. Proc. Natl Acad. Sci. USA 113, 14970–14975 (2016). · DOI
- Remacle, A. G. et al. Selective function-blocking monoclonal human antibody highlights the important role of membrane type-1 matrix metalloproteinase (MT1-MMP) in metastasis. Oncotarget 8, 2781–2799 (2017). · DOI
- Li, X. et al. Critical role of matrix metalloproteinase 14 in adipose tissue remodeling during obesity. Mol. Cell. Biol. 40, https://doi.org/10.1128/MCB.00564-19 (2020). · DOI
- Hui, X. et al. Adipocyte SIRT1 controls systemic insulin sensitivity by modulating macrophages in adipose tissue. EMBO Rep. 18, 645–657 (2017). · DOI
- Wong, H. L. et al. MT1-MMP sheds LYVE-1 on lymphatic endothelial cells and suppresses VEGF-C production to inhibit lymphangiogenesis. Nat. Commun. 7, 10824 (2016). · DOI
Cited by
Sorted by citations
Obesity accelerates cardiovascular ageing
Ruperez, C., Madeo, F., de Cabo, R., Kroemer, G., & Abdellatif, M. (2025) · European Heart Journal · doi:10.1093/eurheartj/ehaf216 · Cited by 73
MT1-MMP inhibition rejuvenates ageing brain and rescues cognitive deficits in obesity
Asthana, P., Li, L., Lu, L., Wu, J., Zhang, S., Li, N., Wong, S. K. K., Gurung, S., Zhang, Y., Lin, Y., et al. (2025) · Cell Discovery · doi:10.1038/s41421-025-00825-w · Cited by 4
Self-citation
Metadata
- Authors
- Guo, X., Asthana, P., Gurung, S., Zhang, S., Wong, S. K. K., Fallah, S., Chow, C. F. W., Che, S., Zhai, L., Wang, Z., Ge, X., Jiang, Z., Wu, J., Zhang, Y., Wu, X., Xu, K., Lin, C. Y., Kwan, H. Y., Lyu, A., Zhou, Z., Bian, Z.-X., & Wong, H. L. X.
- ORCID
- Venue
- Nature Communications
- Published
- 2022-06-29
- Volume
- 13
- Issue
- 1
- ISSN
- 2041-1723
- PMC
- PMC9242991
- Cited by
- 49
- References
- 3
- Language
- en
- Funders
- Research Grants Council, University Grants Committee (12101019, 12102020)
- Food and Health Bureau of the Government of the Hong Kong Special Administrative Region | Health and Medical Research Fund (06170056, 08793626)
- National Natural Science Foundation of China (81802838)
- Natural Science Foundation of Guangdong Province (2021A1515011128, 2019A1515011851)
About these checks
Registry, retraction, Cites and statistics results are computed, not judged, with one exception: a printed reference that no index lists is read once by a model before it counts as a citation error. Claims are extracted by a model and kept only when their quote appears verbatim in the text; each cited source is then checked, with a model’s help, for whether it says what the claim relies on. Those verdicts can be wrong — read the claim’s quote and the cited source before relying on one.
Statistics and arithmetic are recomputed, not judged.
Confidence bands are shown only for fields calibrated on our annotated test set. None is calibrated yet, so no band is shown.
What counts as a claim ›How we measure confidence ›How we check this ›
Are you an author, or do you see a problem with this page? Request a review
