

The DOI matches its Crossref record; 78 of the 79 references it cites were found in a registry or an index.
Silver lining to a climate crisis in multiple prospects for alleviating crop waterlogging under future climates
Open accessPublished version of a preprint
Abstract
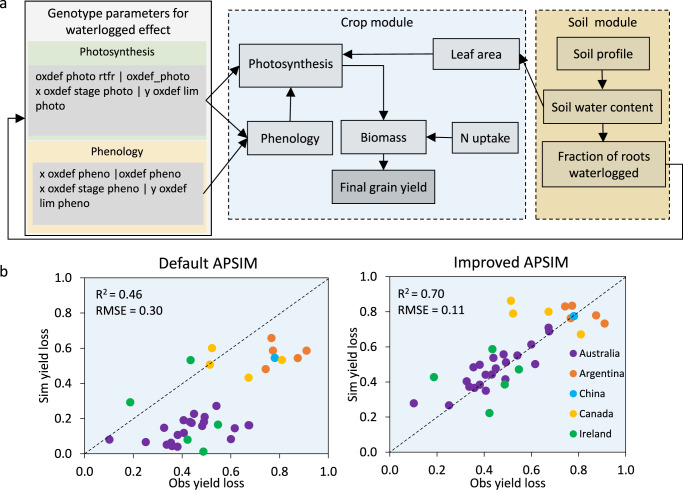
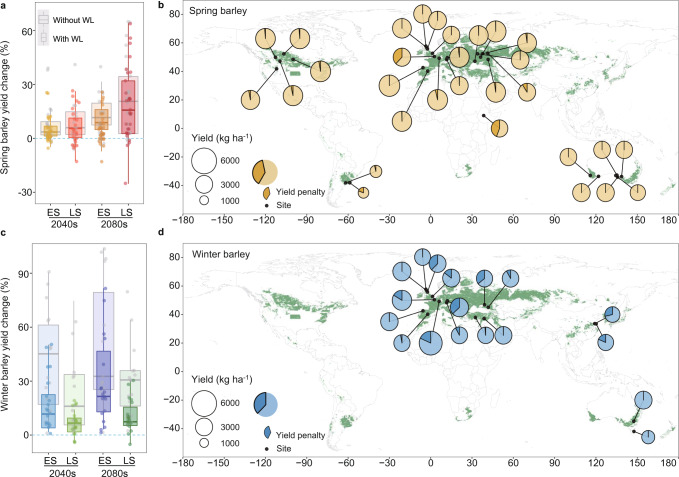
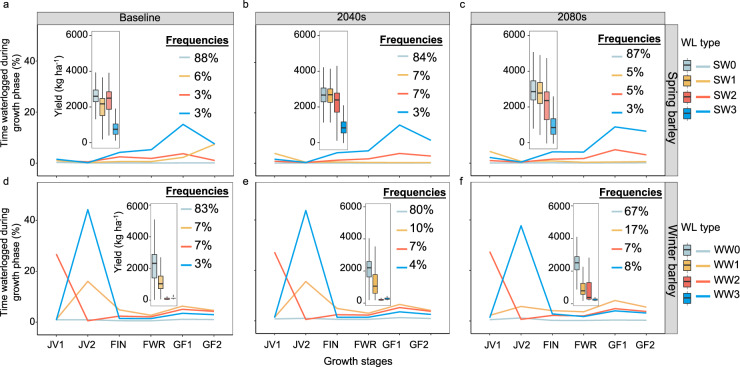
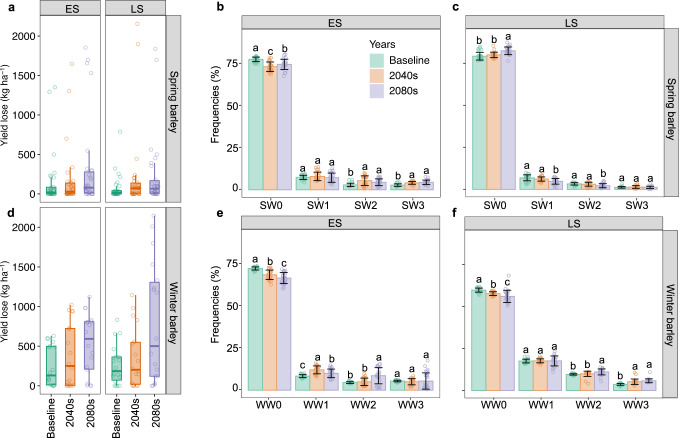
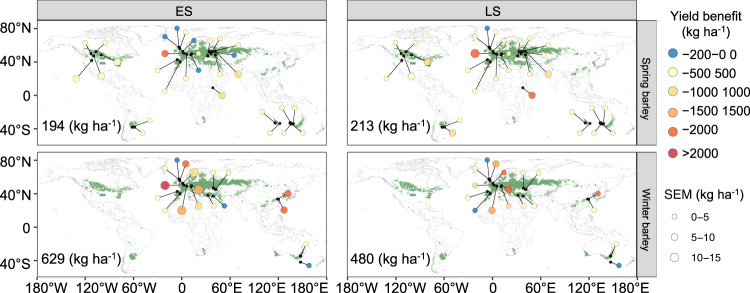
Extreme weather events threaten food security, yet global assessments of impacts caused by crop waterlogging are rare. Here we first develop a paradigm that distils common stress patterns across environments, genotypes and climate horizons. Second, we embed improved process-based understanding into a farming systems model to discern changes in global crop waterlogging under future climates. Third, we develop avenues for adapting cropping systems to waterlogging contextualised by environment. We find that yield penalties caused by waterlogging increase from 3–11% historically to 10–20% by 2080, with penalties reflecting a trade-off between the duration of waterlogging and the timing of waterlogging relative to crop stage. We document greater potential for waterlogging-tolerant genotypes in environments with longer temperate growing seasons (e.g., UK, France, Russia, China), compared with environments with higher annualised ratios of evapotranspiration to precipitation (e.g., Australia). Under future climates, altering sowing time and adoption of waterlogging-tolerant genotypes reduces yield penalties by 18%, while earlier sowing of winter genotypes alleviates waterlogging by 8%. We highlight the serendipitous outcome wherein waterlogging stress patterns under present conditions are likely to be similar to those in the future, suggesting that adaptations for future climates could be designed using stress patterns realised today.
Overview
The claims and statistics of this paper haven’t been checked yet.
Run the check — free, no account needed. It reads the open-access text and checks the sources it cites.
Integrity signals
Registry
Cites
Statistics
Figures
Verification
Claims the paper makes
The claims and statistics of this paper haven’t been checked yet.
Run the check — free, no account needed. It reads the open-access text and checks the sources it cites.
Claims other papers make about this one
Each is checked against this paper’s own text: does it say what the citing paper says it does?
In the citing paper
“However, modelling predicts more frequent and severe waterlogging stress for countries such as Argentina, Ethiopia, China, the UK, France, and Germany, some of which are the world's largest barley producers (Liu et al., 2023).”
From Genetic resources and precise gene editing for targeted improvement of barley abiotic stress tolerance (2023) · cites this paper as Liu et al., 2023
Self-check
Percentages, sums and reported differences re-computed from the paper’s own numbers.
The self-check needs the paper’s full text.
Citations
Cites
Plant Responses to Water Stress
Hsiao, T. C. (1973) · Annual Review of Plant Physiology · doi:10.1146/annurev.pp.24.060173.002511 · Cited by 3,431
Global flood risk under climate change
Hirabayashi, Y., Roobavannan, M., Koirala, S., Konoshima, L., Yamazaki, D., WATANABE, S., Kim, H., & Kanae, S. (2013) · Nature Climate Change · doi:10.1038/nclimate1911 · Cited by 3,210
An overview of APSIM, a model designed for farming systems simulation
Keating, B. A., Carberry, P. S., Hammer, G. L., Probert, M. E., Robertson, M. J., Holzworth, D., Huth, N. I., Hargreaves, J. N. G., Meinke, H., Hochman, Z., et al. (2003) · European Journal of Agronomy · doi:10.1016/s1161-0301(02)00108-9 · Cited by 2,878
Self-citationRosenzweig, C., Elliott, J., Deryng, D., Ruane, A. C., Müller, C., Arneth, A., Boote, K. J., Folberth, C., Glotter, M., Khabarov, N., et al. (2014) · Proceedings of the National Academy of Sciences · doi:10.1073/pnas.1222463110 · Cited by 2,319
Abiotic stress responses in plants
Zhang, H., Zhu, J., Gong, Z., & Zhu, J. (2021) · Nature Reviews Genetics · doi:10.1038/s41576-021-00413-0 · Cited by 2,220
APSIM – evolution towards a new generation of agricultural systems simulation
Holzworth, D. P., Huth, N. I., deVoil, P. G., Zurcher, E. J., Herrmann, N. I., McLean, G., Chenu, K., van Oosterom, E. J., Snow, V., Murphy, C., et al. (2014) · Environmental Modelling & Software · doi:10.1016/j.envsoft.2014.07.009 · Cited by 1,756
Self-citationUncertainty in simulating wheat yields under climate change
Asseng, S., Ewert, F. A., Rosenzweig, C. E., Jones, J. W., Hatfield, J. L., Ruane, A. C., Boote, K. J., Thorburn, P. J., Rötter, R. P., Cammarano, D., et al. (2013) · Nature Climate Change · doi:10.1038/nclimate1916 · Cited by 1,398
Self-citationGlobal Patterns of Groundwater Table Depth
Fan, Y., Li, H., & Miguez‐Macho, G. (2013) · Science · doi:10.1126/science.1229881 · Cited by 1,322
The critical role of extreme heat for maize production in the United States
Lobell, D. B., Hammer, G. L., McLean, G., Messina, C., Roberts, M. J., & Schlenker, W. (2013) · Nature Climate Change · doi:10.1038/nclimate1832 · Cited by 1,026
Climate impacts on global agriculture emerge earlier in new generation of climate and crop models
Jägermeyr, J., Müller, C., Ruane, A., Elliott, J., Balkovič, J., Castillo, O., Faye, B., Foster, I. T., Folberth, C., Franke, J., et al. (2021) · Nature Food · doi:10.1038/s43016-021-00400-y · Cited by 903
Self-citation
Research works printed but not linked: 4
- IPCC. Managing the Risks of Extreme Events and Disasters to Advance Climate Change Adaptation A Special Report of Working Groups I and II of the Intergovernmental Panel on Climate Change (Cambridge: Cambridge University Press). (National Academies Press, 2012).
- UNISR. Global Assessment Report on Disaster Risk Reduction. Revealing Risk, Redefining Development, Vol. 1454 (United Nations International Strategy for Disaster Reduction Secretariat, 2011).
- Asseng, S., Keating, B. A., Huth, N. I. & Eastham, J. Simulation of perched watertables in a duplex soil. in International Congress on Modelling and Simulation Proceedings (eds McDonald, A. D. & McAleer, M.) 538–543 (The Modelling and Simulation Society of Australia, 1997).
- Xiao, Y., Wei, K., Chen, J., Zhou, M. & Zhang, G. Genotypic difference in growth inhibition and yield loss of barley under waterlogging stress. J. Zhejiang Univ. (Agric Life Sci.) 33, 525–532 (2007).
Cited by
Sorted by citations
Items 201–252 of 252
Mirpulatov, I., Gasanov, M. E., & Matveev, S. A. (2023) · Agronomy · doi:10.3390/agronomy13082185 · Cited by 2
Dynamics of waterlogging and drainage congestion on the Kosi Fan, Himalayan Foreland
Niranjannaik, M., Gaurav, K., Singh, A., & Singh, A. K. (2023) · Remote Sensing Applications Society and Environment · doi:10.1016/j.rsase.2023.101113 · Cited by 1
Systems of crop regulation in guava and their assessment
Singh, G., Saha, P., ., N., Saini, V., Singh, J., & Singh, J. (2024) · International Journal of Advanced Biochemistry Research · doi:10.33545/26174693.2024.v8.i3j.942 · Cited by 1
Zhou, M., Liu, X., Zhao, J., Jiang, F., Li, W., Yan, X., Hu, Y., & Yuan, J. (2024) · Plants · doi:10.3390/plants13233324 · Cited by 1
Self-citationPrajapat, D. K., Choudhary, M., Avtar, R., Singh, S., Alsulamy, S. H., & Kharrazi, A. (2025) · Earth · doi:10.3390/earth6020039 · Cited by 1
Caian, M., Lazăr, C., Neague, P., Dobre, A., Amihăesei, V., Chiţu, Z., Irașoc, A., Popescu, A., & Cizmaş, G. (2026) · Geoscientific model development · doi:10.5194/gmd-19-627-2026 · Cited by 4
Adaptation of agriculture to climate change
Miao, R., & Malikov, E. (2024) · Elsevier eBooks · doi:10.1016/b978-0-323-91013-2.00049-6 · Cited by 1
Litskas, V. D., Vourlioti, P., Mamouka, T., Kotsopoulos, S., & Paraskevas, C. (2023) · Hydrology · doi:10.3390/hydrology10120218
Naderi, R., Bijani, F., Chauhan, B. S., & Müller‐Schärer, H. (2024) · Agronomy · doi:10.3390/agronomy14061268
Global huge grain production potential adapted to future climate changePreprint
Liu, X., Liu, Y., & Chen, Z. (2024) · Research Square · doi:10.21203/rs.3.rs-4743316/v1
Determinants of households residential mobility decision in Kumasi Ghana
Nanor, M. A. (2025) · Environment Development and Sustainability · doi:10.1007/s10668-025-06046-1
Fernando, F. N., Maloney, M., & Tappel, L. (2025) · Urban Science · doi:10.3390/urbansci9030060
Ferroelectric and FeFET Devices as Biosensors
Bind, U. C., Kumar, K., Bind, V., Kumar, A., & Nishad, J. (2025) · Wiley eBooks · doi:10.1002/9781394287307.ch10
The Impact of Cultivars and Biostimulants on the Compounds Contained in Glycine max (L.) Merr. Seeds
Rymuza, K., Radzka, E., & Cała, J. (2025) · Agriculture · doi:10.3390/agriculture15171796
Waterlogging, health and healthcare access in southwest Bangladesh
Clech, L., Franceschin, L., Islam, M. N., Kabir, M. M. S., Kobir, D. R., Sarker, M., Allegri, M. D., & Ridde, V. (2025) · PLOS Climate · doi:10.1371/journal.pclm.0000605
de, B. M. A., Nel, A. A., Beukes, D. J., & van, N. J. A. (2025) · African Journal of Agricultural Research · doi:10.5897/ajar2025.17069
Digitalization of crop yield forecasting methods
Fedorov, D. S., Pishchimko, O. I., & Garafutdinova, L. V. (2025) · Siberian Herald of Agricultural Science · doi:10.26898/0370-8799-2025-1-1
Optimising irrigation scheduling for winter wheat-soybean relay intercropping in temperate Europe
Yu, J., Rezaei, E. E., Reckling, M., Thompson, J. B., Lamichhane, J. R., & Nendel, C. (2025) · Agricultural Water Management · doi:10.1016/j.agwat.2025.110031
Wang, F., Zhou, Z., Liu, X., Zhu, L., Guo, B., Lv, C., Zhu, J., Chen, Z.-H., & Xu, R. (2024) · Figshare · doi:10.6084/m9.figshare.25792848
Wang, F., Zhou, Z., Liu, X., Zhu, L., Guo, B., Lv, C., Zhu, J., Chen, Z.-H., & Xu, R. (2024) · Figshare · doi:10.6084/m9.figshare.25792721
Wang, F., Zhou, Z., Liu, X., Zhu, L., Guo, B., Lv, C., Zhu, J., Chen, Z.-H., & Xu, R. (2024) · Figshare · doi:10.6084/m9.figshare.26718168
Improvements of Crops for Nutrient Rich Diets
Tiwari, V., Chaudhary, E., P, A. V. D. K., Yadav, M., Sheoran, B., Kumari, A., Sharma, A., Nain, R., Tiwari, P., & Garg, M. (2026) · Sustainability Sciences in Asia and Africa · doi:10.1007/978-981-95-2754-0_7
Analia, M., Javier, A., Caviglia, O. P., Sadras, V. O., & Adela, R. D. (2026) · Rhizosphere · doi:10.1016/j.rhisph.2026.101273 · Cited by 1
Outcomes, Trends, and Challenges of Food Systems in a Globalized World
Barwant, M. M., Nagarkar, R., & Ugale, Y. (2026) · Springer eBooks · doi:10.1007/978-3-032-04870-7_11 · Cited by 3
Gutiérrez-Villamil, D. A., Alvarado-Sanabria, Ó. H., Becerra-Lagos, J. D., & Balaguera-López, H. E. (2025) · Revista Colombiana de Ciencias Hortícolas · doi:10.19053/uptc.24223719.18860
Wang, H., Li, L., Li, J., Xiang, J., & He, Y. (2026) · Ecological Modelling · doi:10.1016/j.ecolmodel.2026.111586
The impact of climate change on plant diversity in peatlands in Sichuan province, China
Wei, Z., Wang, Y., Chen, W., Ran, J., wang, Z., & Chen, R. (2026) · Frontiers in Plant Science · doi:10.3389/fpls.2026.1762128
Climate-resilient technologies for sustainable cropping systems
Ali, S., Zahid, A., Ahmed, M., Shafqat, N., Hasnain, A., Fatima, A., Yıldırım, M. U., Arjumend, T., Shahzad, A., & Ali, R. (2026) · Elsevier eBooks · doi:10.1016/b978-0-443-34252-3.00015-9
Chen, X., Wu, K., Jia, R., Wang, Z. P., Lei, T., Wei, Z., Wu, B., Zhang, C., Sun, F., & Xi, Y. (2026) · Plant Science · doi:10.1016/j.plantsci.2026.113197
Liu, D., Raman, H., Chen, X., Malcolm, D., & Liu, K. (2026) · Agricultural and Forest Meteorology · doi:10.1016/j.agrformet.2026.111218
Self-citationEffect of Foliar Biostimulants on Soybean Growth and Yield Across Different Tillage Systems
Thapa, S., Gorden, R., Santiago, M., & Ortiz, A. C. (2026) · Agronomy · doi:10.3390/agronomy16100958
Asymmetric responses of global grain production potential to future climate adaptionPreprint
Liu, X. G., Liu, Y., Chen, Z., & Robinson, G. (2026) · Research Square · doi:10.21203/rs.3.rs-9463024/v1
Kubwimana, S., & Nibizi, D. (2026) · Theoretical and Applied Climatology · doi:10.1007/s00704-026-06373-x
Combined shading and waterlogging stress threaten grain mineral nutrition of wheat
Xu, J., Guo, Z., Shi, J., Huang, J., Li, H., Xiao, L., Liu, L., Tang, L., Cao, W., Zhu, Y., et al. (2026) · Plant and Soil · doi:10.1007/s11104-026-08793-0
Effect of crack treatment on soybean yield in close mixed-planting with rice
Hirooka, Y., Izumi, Y., Muranaka, Y., Sunami, A., Otsuka, T., Shoji, K., & Iijima, M. (2026) · Plant Production Science · doi:10.1080/1343943x.2026.2691753
Envirotyping framework for wheat in Europe
Chen, X., Júnior, R. D. S. N., Raihauti, T., Manceau, L., Dueri, S., Ramakers, J. J. C., Malik, W. A., Bustos‐Korts, D., Flamm, C., Grizeau, C., et al. (2026) · Field Crops Research · doi:10.1016/j.fcr.2026.110616
Dirr, A. S., Greco, A. D., Howe, S. A., Walker, L. S., Perri, M., Shukla, V., Licausi, F., & Flashman, E. (2026) · Journal of Biological Chemistry · doi:10.1016/j.jbc.2026.113331
Quantifying waterlogging effects on crop production at different spatial scales
Giri, S., Palka, M., Inforsato, L., Ghazaryan, G., & Nendel, C. (2026) · Agricultural and Forest Meteorology · doi:10.1016/j.agrformet.2026.111350
Zheng, Y., Li, Z., & Zeng, J. (2026) · Journal of Hydrology Regional Studies · doi:10.1016/j.ejrh.2026.103765
Ding, Y., Lei, J., Li, Y., Zhang, L., Sun, H., Du, Y., Xu, L., & Zhang, H. (2026) · International Journal of Remote Sensing · doi:10.1080/01431161.2026.2710370
Xu, T., Yang, Z., Zhao, J., Hu, Y., Cheng, Y., Chen, X., Qi, X., & Xie, Q. (2026) · Horticulturae · doi:10.3390/horticulturae12091116
Self-citationYang, Y., Wu, S., Ge, T., Jin, W., Wu, H., Zheng, B., & Wan, W. (2026) · Agricultural Systems · doi:10.1016/j.agsy.2026.104985
Self-citationQiu, S., Sun, H., Li, Z., Xu, S., Zhang, Y., Zhang, D., Zhan, L., Dai, J., Li, C., & Dong, H. (2026) · Field Crops Research · doi:10.1016/j.fcr.2026.110729
Self-citationKollah, B., Choudhary, S., Parmar, R., Bajpai, A., Atoliya, N., Devi, M. H., & Mohanty, S. R. (2026) · Soil Advances · doi:10.1016/j.soilad.2026.100139
Huang, M., Wang, J., Lü, B., Qiuling, 王. W., Han, Z., Liao, Y., Li, Y., Chen, R., Wu, J., & Wang, B. (2026) · Agricultural and Forest Meteorology · doi:10.1016/j.agrformet.2026.111498
Self-citationSreekanth, D., Singh, C., Yadav, M. K., Siddanagouda, B. P., & Mitra, D. (2026) · Biologia · doi:10.1007/s11756-026-02349-4
Ahmed, R. M. M., Wang, S., Abdou, N. M., Abdelfattah, M. A., Abdelhadi, E. E. M., Wang, Y., Wang, H., Guo, J., Yang, Q., Tang, Y., et al. (2026) · Geoderma · doi:10.1016/j.geoderma.2026.118078
Tamanna, R. I., Shakil, M. H., Mim, H. K., & Mobashira, S. (2026) · IGI Global eBooks · doi:10.4018/979-8-2600-0036-6.ch010
Advances in the regulation of exogenous melatonin on plant resistance to abiotic stress
Chen, Y., Zeng, X., Huang, Y., Wang, H., & Zhang, Z. (2026) · Plant Stress · doi:10.1016/j.stress.2026.101585
Self-citationUncertainties in simulating wheat growth responses to waterlogging
Júnior, R. D. S. N., Harrison, M. T., Palosuo, T., García‐Vila, M., Liu, K., Vianna, M. D. S., Weber, T. K. D., Zhao, J., Zhang, Z., Ábalos, D., et al. (2026) · Agricultural Water Management · doi:10.1016/j.agwat.2026.110882
Self-citationHan, X., Yán, H., Liu, K., Gong, J., Gǒng, W., Dai, P., Harrison, M. T., Wang, B., Li, Y., Pān, J., et al. (2026) · Theoretical and Applied Genetics · doi:10.1007/s00122-026-05416-1
Self-citationGutiérrez-Villamil, D. A., Balaguera-López, H. E., Alvarado-Sanabria, Ó. H., Álvarez-Herrera, J. G., & Melgarejo, L. M. (2026) · Stresses · doi:10.3390/stresses6040083
Metadata
- Authors
- Liu, K., Harrison, M. T., Yan, H., Liu, D. L., Meinke, H., Hoogenboom, G., Wang, B., Peng, B., Guan, K., Jaegermeyr, J., Wang, E., Zhang, F., Yin, X., Archontoulis, S., Nie, L., Badea, A., Man, J., Wallach, D., Zhao, J., Benjumea, A. B., Fahad, S., Tian, X., Wang, W., Tao, F., Zhang, Z., Rötter, R., Yuan, Y., Zhu, M., Dai, P., Nie, J., Yang, Y., Zhang, Y., & Zhou, M.
- Affiliations
- University of Tasmania (AU)
- New South Wales Department of Primary Industries (AU)
- University of Florida (US)
- University of Illinois Urbana-Champaign (US)
- Commonwealth Scientific and Industrial Research Organisation (AU)
- Lanzhou University (CN)
- China Agricultural University (CN)
- Iowa State University (US)
- Hainan University (CN)
- Agriculture and Agri-Food Canada (CA)
- Huazhong Agricultural University (CN)
- Institut National de Recherche pour l'Agriculture, l'Alimentation et l'Environnement (FR)
- Abdul Wali Khan University Mardan (PK)
- Yangtze University (CN)
- Yangzhou University (CN)
- Chinese Academy of Sciences (CN)
- Beijing Normal University (CN)
- University of Göttingen (DE)
- Anyang Institute of Technology (CN)
- Corresponding author
- Harrison, Matthew Tom
- ORCID
- Liu, Ke
- Harrison, Matthew Tom
- Yan, Haoliang
- Liu, De Li
- Meinke, Holger
- Hoogenboom, Gerrit
- Wang, Bin
- Peng, Bin
- Guan, Kaiyu
- Wang, Enli
- Zhang, Feng
- Yin, Xiaogang
- Archontoulis, Sotirios
- Nie, Lixiao
- Badea, Ana
- Man, Jianguo
- Wallach, Daniel
- Zhao, Jin
- Benjumea, Ana Borrego
- Fahad, Shah
- Tian, Xiaohai
- Wang, Weilu
- Tao, Fulu
- Zhang, Zhao
- Rötter, Reimund
- Dai, Panhong
- Nie, Jiangwen
- Yang, Yadong
- Zhang, Yunbo
- Zhou, Meixue
- Venue
- Nature Communications
- Published
- 2023-02-10
- Volume
- 14
- Issue
- 1
- Pages
- 765-765
- ISSN
- 2041-1723 (ISSN-L)
- PMC
- PMC9918449
- OpenAlex
- W4319915600
- Cited by
- 252
- References
- 79
- Citations by year
- 2026: 44 · 2025: 59 · 2024: 78 · 2023: 71
- FWCI
- 39.86
- Type
- journal article
- Language
- en
- Open access
- gold
- doi.org
- Locations
- Nature Communications (publishedVersion, cc-by)
- PubMed Central (publishedVersion, cc-by)
- PubMed (publishedVersion)
- HAL (submittedVersion, cc-by)
- DOAJ (DOAJ: Directory of Open Access Journals) (submittedVersion, cc-by-sa)
- GoeScholar The Publication Server of the Georg-August-Universität Göttingen (Georg-August-Universität Göttingen) (submittedVersion, cc-by)
- Greater South Information System
- Funders
- Grains Research and Development Corporation (UOT1906-002RTX)
- Topics
- Life Sciences › Agricultural and Biological Sciences › Plant Science › Plant responses to water stress
- Life Sciences › Agricultural and Biological Sciences › Agronomy and Crop Science › Climate change impacts on agriculture
- Life Sciences › Agricultural and Biological Sciences › Soil Science › Irrigation Practices and Water Management
- Keywords
- climate change impacts on crops, yield penalty, sowing date, growing season length, extreme weather events, food security
- MeSH terms
- Acclimatization, Adaptation, Physiological, Agriculture, Seasons, Water
About these checks
Registry, retraction, Cites and statistics results are computed, not judged, with one exception: a printed reference that no index lists is read once by a model before it counts as a citation error. Claims are extracted by a model and kept only when their quote appears verbatim in the text; each cited source is then checked, with a model’s help, for whether it says what the claim relies on. Those verdicts can be wrong — read the claim’s quote and the cited source before relying on one.
Statistics and arithmetic are recomputed, not judged.
Confidence bands are shown only for fields calibrated on our annotated test set. None is calibrated yet, so no band is shown.
What counts as a claim ›How we measure confidence ›How we check this ›
Are you an author, or do you see a problem with this page? Request a review
