

The DOI matches its Crossref record; 42 of the 42 references it cites were found in a registry or an index.
Sleep cycle-dependent vascular dynamics in male mice and the predicted effects on perivascular cerebrospinal fluid flow and solute transport
Open accessAbstract
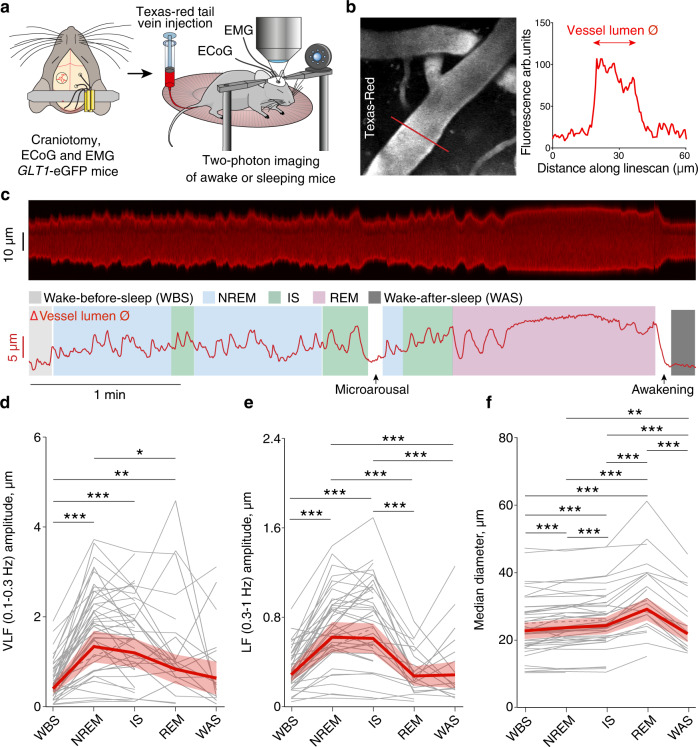
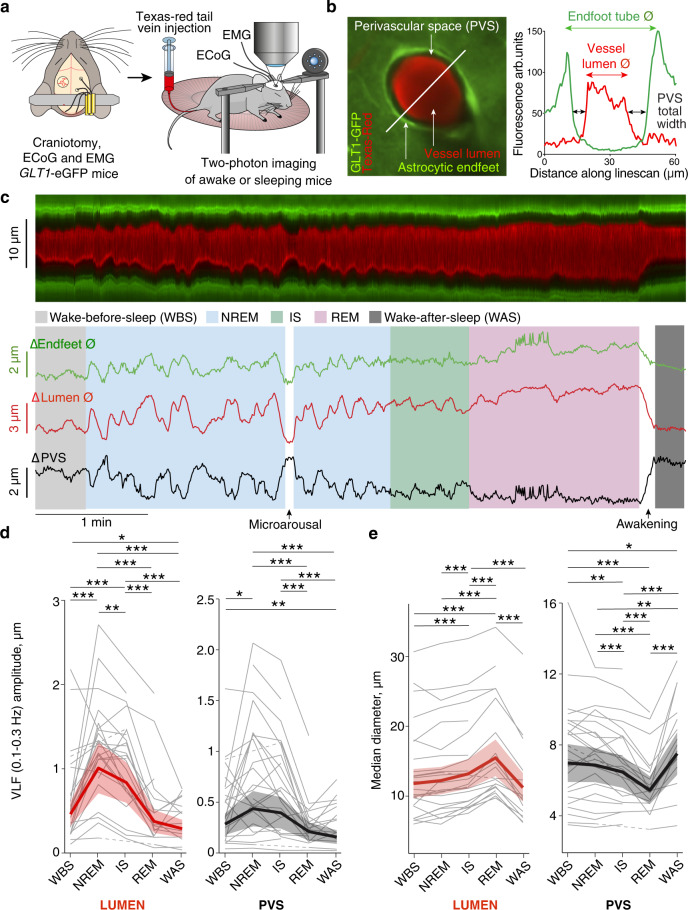
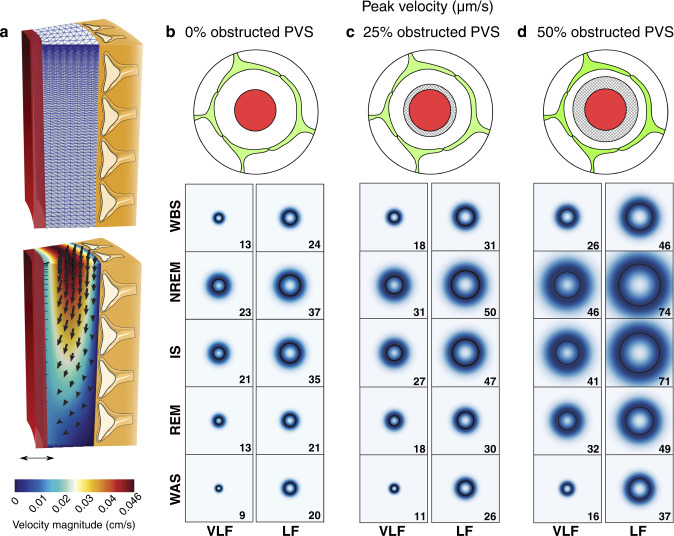
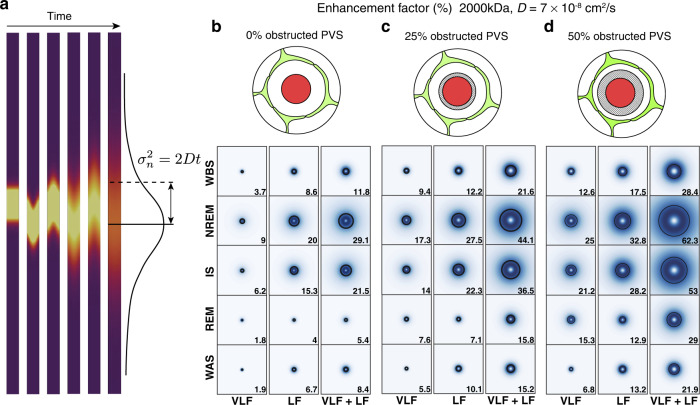
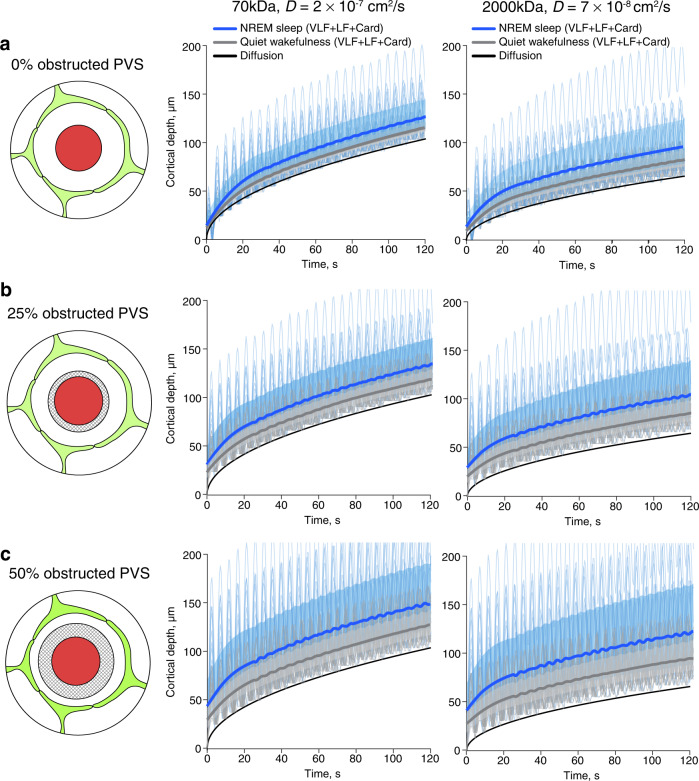
Perivascular spaces are important highways for fluid and solute transport in the brain enabling efficient waste clearance during sleep. However, the underlying mechanisms augmenting perivascular flow in sleep are unknown. Using two-photon imaging of naturally sleeping male mice we demonstrate sleep cycle-dependent vascular dynamics of pial arteries and penetrating arterioles: slow, large-amplitude oscillations in NREM sleep, a vasodilation in REM sleep, and a vasoconstriction upon awakening at the end of a sleep cycle and microarousals in NREM and intermediate sleep. These vascular dynamics are mirrored by changes in the size of the perivascular spaces of the penetrating arterioles: slow fluctuations in NREM sleep, reduction in REM sleep and an enlargement upon awakening after REM sleep and during microarousals in NREM and intermediate sleep. By biomechanical modeling we demonstrate that these sleep cycle-dependent perivascular dynamics likely enhance fluid flow and solute transport in perivascular spaces to levels comparable to cardiac pulsation-driven oscillations.
Overview
The claims and statistics of this paper haven’t been checked yet.
Run the check — free, no account needed. It reads the open-access text and checks the sources it cites.
Integrity signals
Registry
Cites
Statistics
Figures
Verification
Claims the paper makes
The claims and statistics of this paper haven’t been checked yet.
Run the check — free, no account needed. It reads the open-access text and checks the sources it cites.
Claims other papers make about this one
Each is checked against this paper’s own text: does it say what the citing paper says it does?
The source backs part of the claim, not all of it — or backs it for a different population, condition or comparison.
In the citing paper
“In contrast, REM sleep was marked by a pronounced increase in BBV, originating in the posterior cortex and slowly propagating across the brain.”
From Energy paradox in REM sleep: balancing supply and consumption in brain metabolism (2026) · cites this paper as [30]
Experimental — accuracy not yet measuredThe source backs part of the claim, not all of it — or backs it for a different population, condition or comparison.
In the citing paper
“The data so far indicates that CSF flow in the perivascular spaces (PVSs) is driven forward by dynamic constriction and enlargement of the cerebral arteries, and thereby the PVS volume, rather than a steady PVS size27–31.”
From Norepinephrine-mediated slow vasomotion drives glymphatic clearance during sleep (2025) · cites this paper as [31]
Experimental — accuracy not yet measuredThe cited source says what the claim attributes to it.
In the citing paper
“infraslow vasomotion predominate during NREM sleep in the rodent brain31,47”
From Norepinephrine-mediated slow vasomotion drives glymphatic clearance during sleep (2025) · cites this paper as [31]
The cited source says what the claim attributes to it.
In the citing paper
“Most prior studies looking at vascular dynamics have used two-photon imaging in head-fixed mice31,47,98”
From Norepinephrine-mediated slow vasomotion drives glymphatic clearance during sleep (2025) · cites this paper as [31]
Self-check
Percentages, sums and reported differences re-computed from the paper’s own numbers.
The self-check needs the paper’s full text.
Citations
Cites
Mollie, E. B., Kristensen, K., van Benthem, K. J., Magnússon, Á., Casper, W. B., Nielsen, A., Hans, J. S., Maechler, M., & Benjamin, M. B. (2017) · The R Journal · doi:10.32614/rj-2017-066 · Cited by 13,350
Iliff, J. J., Wang, M., Liao, Y., Plogg, B. A., Peng, W., Gundersen, G. A., Benveniste, H., Vates, G. E., Deane, R., Goldman, S. A., et al. (2012) · Science Translational Medicine · doi:10.1126/scitranslmed.3003748 · Cited by 5,824
Sleep Drives Metabolite Clearance from the Adult Brain
Xie, L., Kang, H., Xu, Q., Chen, M. J., Liao, Y., Thiyagarajan, M., O’Donnell, J., Christensen, D. J., Nicholson, C., Iliff, J. J., et al. (2013) · Science · doi:10.1126/science.1241224 · Cited by 5,411
Structural and functional features of central nervous system lymphatic vessels
Louveau, A., Smirnov, I., Keyes, T. J., Eccles, J. D., Rouhani, S. J., Peske, J. D., Derecki, N. C., Castle, D., Mandell, J. W., Lee, K. S., et al. (2015) · Nature · doi:10.1038/nature14432 · Cited by 4,413
A dural lymphatic vascular system that drains brain interstitial fluid and macromolecules
Aspelund, A., Antila, S., Proulx, S. T., Karlsen, T. V., Karaman, S., Detmar, M., Wiig, H., & Alitalo, K. (2015) · Journal of Experimental Medicine · doi:10.1084/jem.20142290 · Cited by 2,198
Diffusion in Brain Extracellular Space
Syková, E., & Nicholson, C. (2008) · Physiological Reviews · doi:10.1152/physrev.00027.2007 · Cited by 1,481
Cerebral Arterial Pulsation Drives Paravascular CSF–Interstitial Fluid Exchange in the Murine Brain
Iliff, J. J., Wang, M., Zeppenfeld, D. M., Venkataraman, A., Plog, B. A., Liao, Y., Deane, R., & Nedergaard, M. (2013) · The Journal of Neuroscience · doi:10.1523/jneurosci.1592-13.2013 · Cited by 1,319
Coupled electrophysiological, hemodynamic, and cerebrospinal fluid oscillations in human sleep
Fultz, N. E., Bonmassar, G., Setsompop, K., Stickgold, R. A., Rosen, B. R., Polimeni, J. R., & Lewis, L. D. (2019) · Science · doi:10.1126/science.aax5440 · Cited by 1,197
Flow of cerebrospinal fluid is driven by arterial pulsations and is reduced in hypertension.
Mestre, H., Tithof, J., Du, T., Song, W., Peng, W., Sweeney, A. M., Olveda, G., Thomas, J. H., Nedergaard, M., & Kelley, D. H. (2018) · Nature Communications · doi:10.1038/s41467-018-07318-3 · Cited by 1,110
Rasmussen, M. K., Mestre, H., & Nedergaard, M. (2021) · Physiological Reviews · doi:10.1152/physrev.00031.2020 · Cited by 642
Research works printed but not linked: 1
- Iliff, J. J. et al. A paravascular pathway facilitates CSF flow through the brain parenchyma and the clearance of interstitial solutes, including amyloid β. Sci. Transl. Med. 4, 147ra111 (2012). · DOI · Paper page
Cited by
Sorted by citations
Norepinephrine-mediated slow vasomotion drives glymphatic clearance during sleep
Hauglund, N. L., Andersen, M., Tokarska, K., Radovanovic, T., Kjaerby, C., Sørensen, F. L., Bojarowska, Z., Untiet, V., Ballestero, S. B., Kolmos, M. G., et al. (2025) · Cell · doi:10.1016/j.cell.2024.11.027 · Cited by 349
Identification of direct connections between the dura and the brain
Smyth, L. C. D., Xu, D., Okar, S. V., Dykstra, T., Rustenhoven, J., Papadopoulos, Z., Bhasiin, K., Kim, M. W., Drieu, A., Mamuladze, T., et al. (2024) · Nature · doi:10.1038/s41586-023-06993-7 · Cited by 264
Glymphatic influx and clearance are accelerated by neurovascular coupling
Holstein-Rønsbo, S., Gan, Y., Giannetto, M. J., Rasmussen, M. K., Sigurdsson, B., Beinlich, F. R. M., Rose, L., Untiet, V., Hablitz, L. M., Kelley, D. H., et al. (2023) · Nature Neuroscience · doi:10.1038/s41593-023-01327-2 · Cited by 248
Vinje, V., Zapf, B., Ringstad, G., Eide, P. K., Rognes, M. E., & Mardal, K.-A. (2023) · Fluids and Barriers of the CNS · doi:10.1186/s12987-023-00459-8 · Cited by 83
Self-citationLüthi, A., & Nedergaard, M. (2025) · Neuron · doi:10.1016/j.neuron.2024.12.009 · Cited by 91
Metadata
- Authors
- Bojarskaite, L., Vallet, A., Bjørnstad, D. M., Gullestad Binder, K. M., Cunen, C., Heuser, K., Kuchta, M., Mardal, K.-A., & Enger, R.
- Affiliations
- Oslo University Hospital (NO)
- University of Oslo (NO)
- Norwegian Computing Center (NO)
- Simula Research Laboratory (NO)
- Corresponding author
- Bojarskaite, Laura
- Enger, Rune
- ORCID
- Venue
- Nature Communications
- Published
- 2023-02-20
- Volume
- 14
- Issue
- 1
- Pages
- 953-953
- ISSN
- 2041-1723 (ISSN-L)
- PMC
- PMC9941497
- OpenAlex
- W4321367779
- Cited by
- 149
- References
- 42
- Citations by year
- 2026: 30 · 2025: 59 · 2024: 36 · 2023: 24
- FWCI
- 18.07
- Type
- journal article
- Language
- en
- Open access
- gold
- doi.org
- Locations
- Nature Communications (publishedVersion, cc-by)
- PubMed Central (publishedVersion, cc-by)
- PubMed (publishedVersion)
- RePEc: Research Papers in Economics (submittedVersion)
- DOAJ (DOAJ: Directory of Open Access Journals) (submittedVersion, cc-by-sa)
- NORA - Norwegian Open Research Archives (submittedVersion, cc-by)
- Funders
- Norges Forskningsråd (249988, 271555/F20, 302326, 300305, 301013, 303362)
- Ministry of Health and Care Services | Helse Sør-Øst RHF (2016070)
- Olav Thon Foundation, Letten Foundation, University of Oslo, UNINETT Sigma2 AS, grant NN9279K.
- Topics
- Health Sciences › Medicine › Clinical Neurology › Cerebrospinal fluid and hydrocephalus
- Life Sciences › Neuroscience › Cognitive Neuroscience › Sleep and Wakefulness Research
- Health Sciences › Medicine › Clinical Neurology › Traumatic Brain Injury and Neurovascular Disturbances
- Keywords
- sleep cycles, vascular dynamics, perivascular spaces, cerebrospinal fluid flow, solute transport, NREM sleep, REM sleep, microarousals, pial arteries, penetrating arterioles, vasodilation, vasoconstriction, brain waste clearance, biomechanical modeling, two-photon imaging
- MeSH terms
- Sleep, Slow-Wave, Animals, Arteries, Male, Sleep, Sleep, REM, Vasodilation, Mice
About these checks
Registry, retraction, Cites and statistics results are computed, not judged, with one exception: a printed reference that no index lists is read once by a model before it counts as a citation error. Claims are extracted by a model and kept only when their quote appears verbatim in the text; each cited source is then checked, with a model’s help, for whether it says what the claim relies on. Those verdicts can be wrong — read the claim’s quote and the cited source before relying on one.
Statistics and arithmetic are recomputed, not judged.
Confidence bands are shown only for fields calibrated on our annotated test set. None is calibrated yet, so no band is shown.
What counts as a claim ›How we measure confidence ›How we check this ›
Are you an author, or do you see a problem with this page? Request a review
