Cited by 239Antimicrobial Peptides and ActivitiesComputational Drug Discovery MethodsChemical Synthesis and Analysis

The DOI matches its Crossref record; 75 of the 78 references it cites were found in a registry or an index.

Discovering highly potent antimicrobial peptides with deep generative model HydrAMP

Open access

Published version of a preprint

Abstract

Antimicrobial peptides emerge as compounds that can alleviate the global health hazard of antimicrobial resistance, prompting a need for novel computational approaches to peptide generation. Here, we propose HydrAMP, a conditional variational autoencoder that learns lower-dimensional, continuous representation of peptides and captures their antimicrobial properties. The model disentangles the learnt representation of a peptide from its antimicrobial conditions and leverages parameter-controlled creativity. HydrAMP is the first model that is directly optimized for diverse tasks, including unconstrained and analogue generation and outperforms other approaches in these tasks. An additional preselection procedure based on ranking of generated peptides and molecular dynamics simulations increases experimental validation rate. Wet-lab experiments on five bacterial strains confirm high activity of nine peptides generated as analogues of clinically relevant prototypes, as well as six analogues of an inactive peptide. HydrAMP enables generation of diverse and potent peptides, making a step towards resolving the antimicrobial resistance crisis.

Overview

The claims and statistics of this paper haven’t been checked yet.

Run the check — free, no account needed. It reads the open-access text and checks the sources it cites.

A few free checks a day · papers already verified open instantly · results are public

Integrity signals

Registry

Crossref · 10.1038/s41467-023-36994-z

Cites

75 of 75 references verified0 citation errors · 0 not checkable

Statistics

Figures

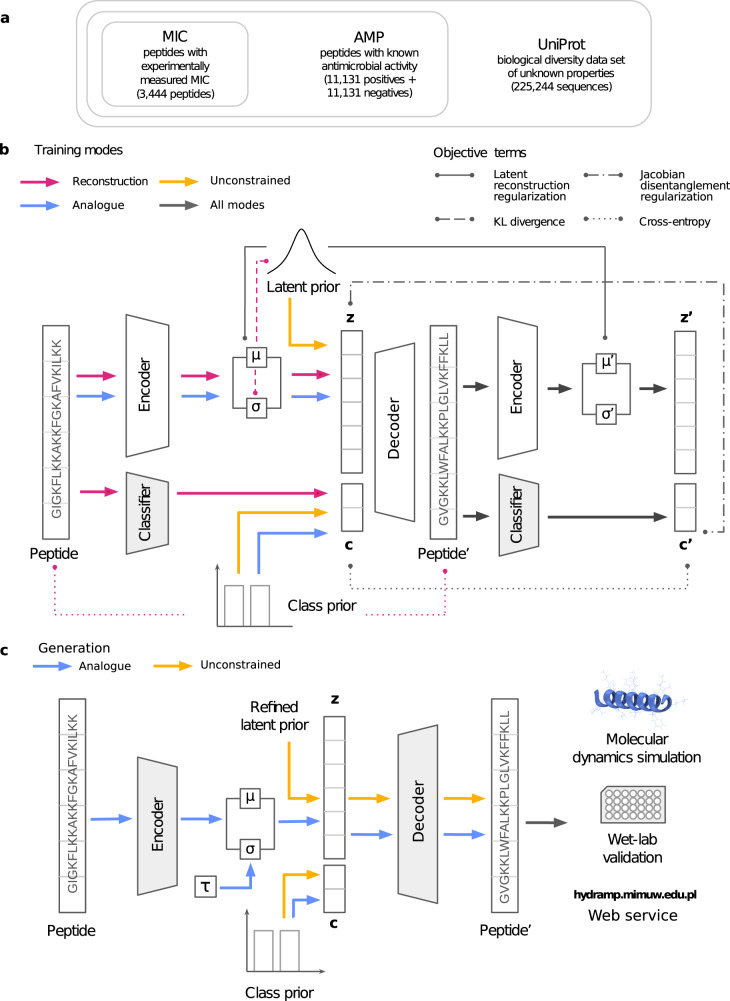
Fig. 1 HydrAMP architecture and data traversion overview. a Compositional structure of the training data set. b Data flow and optimization setup during the training. Colors indicate training modes: reconstruction (pink), unconstrained (yellow), analogue (blue), and all modes together (grey). The arrows show the path each peptide traverses within a given training mode. Lines connect arguments of different terms of the objective (loss) function, as indicated by line styling: latent reconstruction regularization, Jacobian disentanglement regularization, KL divergence, and cross entropy. Shaded areas indicate components with frozen weights. c Data flow during the generation of peptides. Colors indicate generation: analogue (blue), and unconstrained (yellow). The model is validated using molecular dynamics simulations and wet-lab validation (activity and toxicity assays). HydrAMP functionality is available via a web service https://hydramp.mimuw.edu.pl/.
Fig. 1 HydrAMP architecture and data traversion overview. a Compositional structure of the training data set. b Data flow and optimization setup during the training. Colors indicate training modes: reconstruction (pink), unconstrained (yellow), analogue (blue), and all modes together (grey). The arrows show the path each peptide traverses within a given training mode. Lines connect arguments of different terms of the objective (loss) function, as indicated by line styling: latent reconstruction regularization, Jacobian disentanglement regularization, KL divergence, and cross entropy. Shaded areas indicate components with frozen weights. c Data flow during the generation of peptides. Colors indicate generation: analogue (blue), and unconstrained (yellow). The model is validated using molecular dynamics simulations and wet-lab validation (activity and toxicity assays). HydrAMP functionality is available via a web service https://hydramp.mimuw.edu.pl/.CC BY · PubMed Central
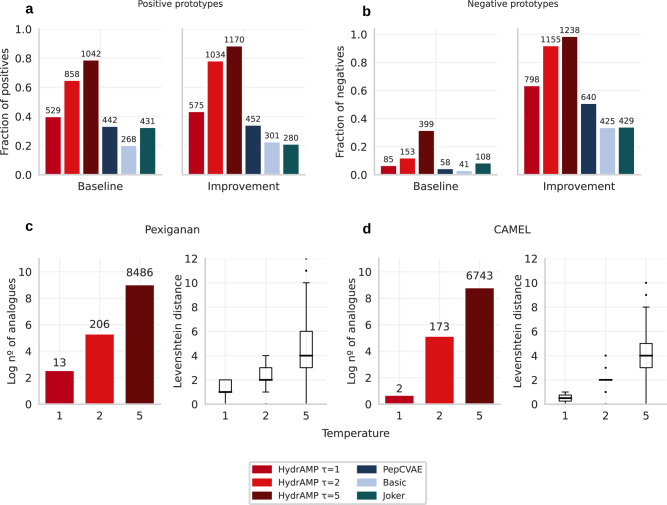
Fig. 2 Analogue generation performance in terms of number of generated analogues of HydrAMP (red), in comparison to PepCVAE (dark blue), Basic (light blue), and Joker (dark green). a Fraction (y-axis) and number (over each bar) of 1319 positive (AMP and highly active) peptides from the test set, which produced analogues that met baseline discovery or improvement discovery criteria (x-axis) in the analogue generation. b As in a, but for 1253 negative peptides from the test set. c, d Left: The relation between the creativity parameter temperature (τ; x-axis) and the log number of generated unique analogues that met the baseline discovery criteria, out of 10,000 total attempts (y-axis; the actual number of analogues shown above each bar). Right: the distribution of the Levenshtein distances between generated unique analogues out of 10,000 total attempts and the prototype sequence; for Pexiganan (c) and CAMEL (d). The borders of the box indicate the first quartile (bottom) and the third quartile (top) of the data. The line within the box indicates the median. The whiskers indicate the most extreme, non-outlier data points, whereas the dots behind the whiskers denote the outliers. The sample sizes for each box in (c) are n = 13 for τ = 1, n = 206 for τ = 2, and n = 8486 for τ = 5. The sample sizes for each box in (d) are n = 2 for τ = 1, n = 173 for τ = 2, and n = 6743 for τ = 5. Source data are provided as a Source Data file.
Fig. 2 Analogue generation performance in terms of number of generated analogues of HydrAMP (red), in comparison to PepCVAE (dark blue), Basic (light blue), and Joker (dark green). a Fraction (y-axis) and number (over each bar) of 1319 positive (AMP and highly active) peptides from the test set, which produced analogues that met baseline discovery or improvement discovery criteria (x-axis) in the analogue generation. b As in a, but for 1253 negative peptides from the test set. c, d Left: The relation between the creativity parameter temperature (τ; x-axis) and the log number of generated unique analogues that met the baseline discovery criteria, out of 10,000 total attempts (y-axis; the actual number of analogues shown above each bar). Right: the distribution of the Levenshtein distances between generated unique analogues out of 10,000 total attempts and the prototype sequence; for Pexiganan (c) and CAMEL (d). The borders of the box indicate the first quartile (bottom) and the third quartile (top) of the data. The line within the box indicates the median. The whiskers indicate the most extreme, non-outlier data points, whereas the dots behind the whiskers denote the outliers. The sample sizes for each box in (c) are n = 13 for τ = 1, n = 206 for τ = 2, and n = 8486 for τ = 5. The sample sizes for each box in (d) are n = 2 for τ = 1, n = 173 for τ = 2, and n = 6743 for τ = 5. Source data are provided as a Source Data file.CC BY · PubMed Central
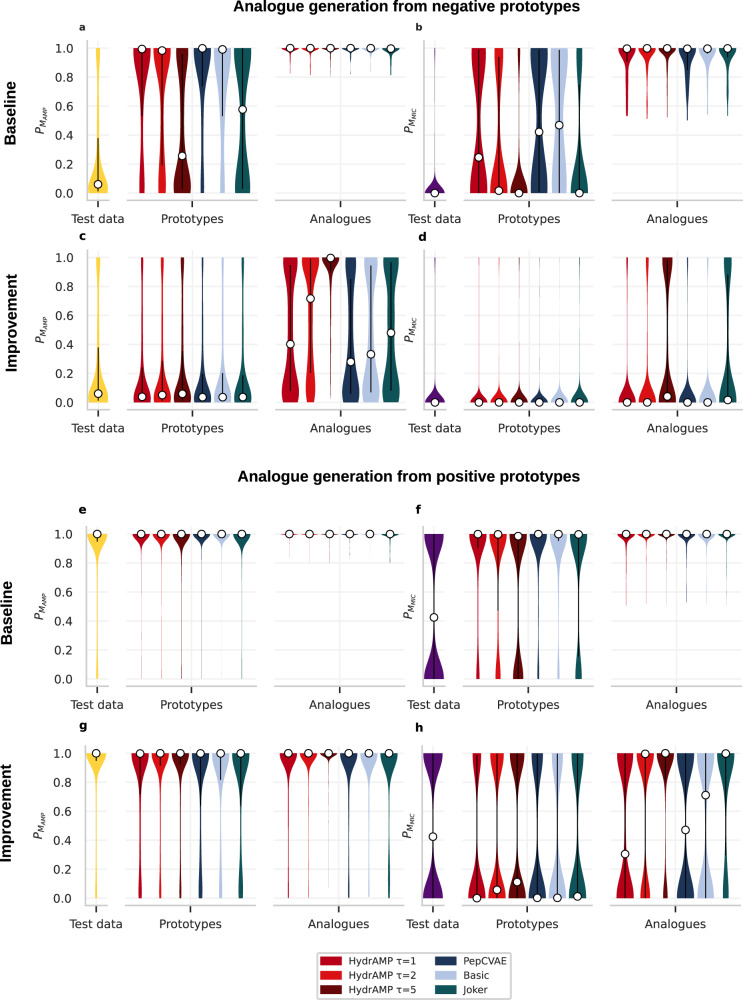
Fig. 3 Analogue generation performance in terms of PMAMP and PMMIC for HydrAMP (red), in comparison to PepCVAE (dark blue), Basic (light blue), and Joker (dark green) compared to the distribution of test data (yellow for PMAMP and violet for PMMIC). Test data contains all the prototypes and serves as a reference. a, b, c, d The probability distributions of PMAMP (a, c) and PMMIC (b, d) for n = 1253 negative prototypes and the generated analogues that met the baseline (a, b) or improvement (c, d) discovery criteria. e, f, g, h The probability distributions of PMAMP (e, g) and PMMIC (f, h) for n = 1319 positive prototypes and the generated analogues that met the baseline (e, f) or improvement (g, h) discovery criteria. The white dots mark the median of each distribution. The black vertical lines denote the interquartile range of each distribution. Source data are provided as a Source Data file.
Fig. 3 Analogue generation performance in terms of PMAMP and PMMIC for HydrAMP (red), in comparison to PepCVAE (dark blue), Basic (light blue), and Joker (dark green) compared to the distribution of test data (yellow for PMAMP and violet for PMMIC). Test data contains all the prototypes and serves as a reference. a, b, c, d The probability distributions of PMAMP (a, c) and PMMIC (b, d) for n = 1253 negative prototypes and the generated analogues that met the baseline (a, b) or improvement (c, d) discovery criteria. e, f, g, h The probability distributions of PMAMP (e, g) and PMMIC (f, h) for n = 1319 positive prototypes and the generated analogues that met the baseline (e, f) or improvement (g, h) discovery criteria. The white dots mark the median of each distribution. The black vertical lines denote the interquartile range of each distribution. Source data are provided as a Source Data file.CC BY · PubMed Central
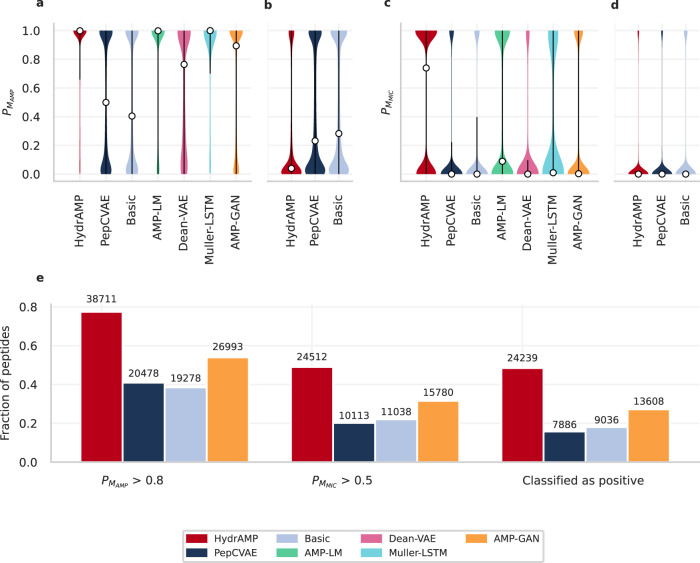
Fig. 4 Unconstrained generative performance of HydrAMP (red), in comparison to PepCVAE (dark blue), Basic (light blue), AMP-LM (green), Dean-VAE (pink), Muller-LSTM (aquamarine), and AMP-GAN (orange) (methods indicated on the x-axis). a, b The distribution of probabilities of being antimicrobial (PMAMP), for the task of generating positive peptides (a) and for the task of generating negative peptides (b). c, d The distribution of probabilities of being highly active (having low MIC, PMMIC) for the task of generating positive peptides (c) and for the task of generating negative peptides (d). In panels a, b, c, d, the white dots mark the median of each distribution. The black vertical lines denote the interquartile range of each distribution. Sample sizes in panels a, c: HydrAMP n = 50, 000, PepCVAE n = 50, 000, Basic n = 50, 000, AMP-LM n = 24, 588, Dean-VAE n = 2973, Muller-LSTM n = 976, AMP-GAN n = 50, 000. Sample sizes in panels b, d: HydrAMP, PepCVAE and Basic n = 50, 000. e For the task of generating positive peptides, fraction of generated peptides with PMAMP>0.8 (first bar plot), fraction of peptides with PMMIC>0.5 (second bar plot), fraction of peptides that satisfy both previous criteria i.e. classified as positive (third bar plot). The number over each bar: the actual number of peptides that met the condition. Source data are provided as a Source Data file.
Fig. 4 Unconstrained generative performance of HydrAMP (red), in comparison to PepCVAE (dark blue), Basic (light blue), AMP-LM (green), Dean-VAE (pink), Muller-LSTM (aquamarine), and AMP-GAN (orange) (methods indicated on the x-axis). a, b The distribution of probabilities of being antimicrobial (PMAMP), for the task of generating positive peptides (a) and for the task of generating negative peptides (b). c, d The distribution of probabilities of being highly active (having low MIC, PMMIC) for the task of generating positive peptides (c) and for the task of generating negative peptides (d). In panels a, b, c, d, the white dots mark the median of each distribution. The black vertical lines denote the interquartile range of each distribution. Sample sizes in panels a, c: HydrAMP n = 50, 000, PepCVAE n = 50, 000, Basic n = 50, 000, AMP-LM n = 24, 588, Dean-VAE n = 2973, Muller-LSTM n = 976, AMP-GAN n = 50, 000. Sample sizes in panels b, d: HydrAMP, PepCVAE and Basic n = 50, 000. e For the task of generating positive peptides, fraction of generated peptides with PMAMP>0.8 (first bar plot), fraction of peptides with PMMIC>0.5 (second bar plot), fraction of peptides that satisfy both previous criteria i.e. classified as positive (third bar plot). The number over each bar: the actual number of peptides that met the condition. Source data are provided as a Source Data file.CC BY · PubMed Central
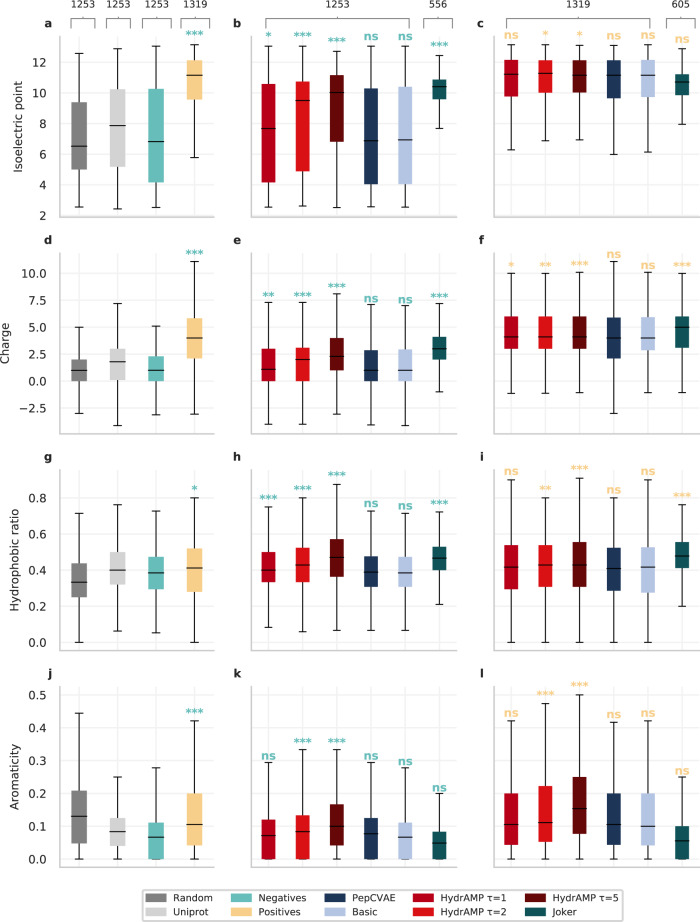
Fig. 5 Physicochemical properties of analogues generated by HydrAMP and compared methods in analogue generation for non-AMP or AMP prototypes in comparison with real and random data. Distributions of properties (a, b, c Isoelectric point, d, e, f Charge, g, h, i Hydrophobic ratio, j, k, l Aromaticity) of randomly generated peptides (dark gray; sample size n = 1253;), peptides sampled from UniProt (light gray; n = 1253), true negatives (green; n = 1253), and true positives (yellow; n = 1319), in comparison with AMP analogues generated from negatives (b, e, h, k), and positives (c, f, i, l) by different models: HydrAMP with various creativity parameter temperature values: τ = 1 (light red), τ = 2 (red), τ = 5 (dark red), PepCVAE (dark blue), Basic (light blue), and Joker (dark green). HydrAMP generated analogues for n = 1253 negatives (for all temperature values), Joker generated analogues for n = 556 of them. For the positive test set, HydrAMP generated analogues for all n = 1319 peptides (for all temperature values), while Joker generated analogues for n = 605 of them. The significance levels of one-sided Mann-Whitney test are denoted above the boxes as: ns - P ≥ 0.05; * - P ≤ 0.05; ** - P ≤ 0.01; *** - P ≤ 0.001. The borders of the boxes indicate first quartile (bottom) and the third quartile (top) of the data. The line within the box indicates the median. The whiskers indicate the the most extreme, nonoutlier data points. Source data are provided as a Source Data file.
Fig. 5 Physicochemical properties of analogues generated by HydrAMP and compared methods in analogue generation for non-AMP or AMP prototypes in comparison with real and random data. Distributions of properties (a, b, c Isoelectric point, d, e, f Charge, g, h, i Hydrophobic ratio, j, k, l Aromaticity) of randomly generated peptides (dark gray; sample size n = 1253;), peptides sampled from UniProt (light gray; n = 1253), true negatives (green; n = 1253), and true positives (yellow; n = 1319), in comparison with AMP analogues generated from negatives (b, e, h, k), and positives (c, f, i, l) by different models: HydrAMP with various creativity parameter temperature values: τ = 1 (light red), τ = 2 (red), τ = 5 (dark red), PepCVAE (dark blue), Basic (light blue), and Joker (dark green). HydrAMP generated analogues for n = 1253 negatives (for all temperature values), Joker generated analogues for n = 556 of them. For the positive test set, HydrAMP generated analogues for all n = 1319 peptides (for all temperature values), while Joker generated analogues for n = 605 of them. The significance levels of one-sided Mann-Whitney test are denoted above the boxes as: ns - P ≥ 0.05; * - P ≤ 0.05; ** - P ≤ 0.01; *** - P ≤ 0.001. The borders of the boxes indicate first quartile (bottom) and the third quartile (top) of the data. The line within the box indicates the median. The whiskers indicate the the most extreme, nonoutlier data points. Source data are provided as a Source Data file.CC BY · PubMed Central
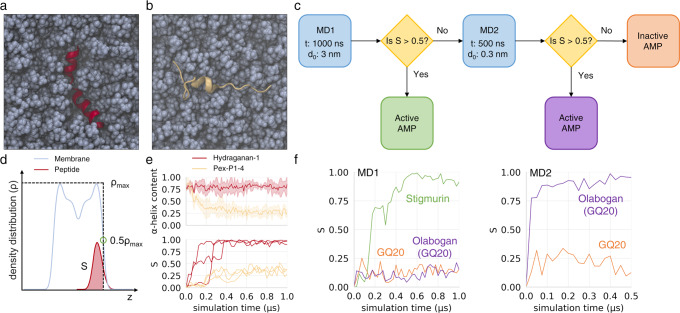
Fig. 6 Summary of atomistic molecular dynamics simulations of peptide-membrane systems. a, b Late simulation snapshots of experimentally verified AMP Hydraganan-1 (red) and non-AMP peptide Pex-P1-4 (beige), respectively, in the membrane (blue); top view on membrane surface; water molecules not depicted for clarity; c scheme of optimized simulation protocol used for AMP preselection; t -- simulation time; d0 initial peptide-membrane separation; d scheme illustrating the evaluation of the S parameter that describes the level of peptide burial within the membrane; z -- membrane normal axis; e system descriptors in Hydraganan-1 and non-AMP Pex-P1-4 simulations; upper plot: an average (lines) and standard deviation (shaded areas) of α-helix fraction within peptide residues; lower plot: the evolution of S parameter for each of three initial peptide placements; f time evolution of S parameter for three sample peptides illustrating possible routes in the preselection algorithm. The time evolution suggests that Stigmurin and Olabogan are active AMPs, while GQ20 is inactive. Source data are provided as a Source Data file.
Fig. 6 Summary of atomistic molecular dynamics simulations of peptide-membrane systems. a, b Late simulation snapshots of experimentally verified AMP Hydraganan-1 (red) and non-AMP peptide Pex-P1-4 (beige), respectively, in the membrane (blue); top view on membrane surface; water molecules not depicted for clarity; c scheme of optimized simulation protocol used for AMP preselection; t -- simulation time; d0 initial peptide-membrane separation; d scheme illustrating the evaluation of the S parameter that describes the level of peptide burial within the membrane; z -- membrane normal axis; e system descriptors in Hydraganan-1 and non-AMP Pex-P1-4 simulations; upper plot: an average (lines) and standard deviation (shaded areas) of α-helix fraction within peptide residues; lower plot: the evolution of S parameter for each of three initial peptide placements; f time evolution of S parameter for three sample peptides illustrating possible routes in the preselection algorithm. The time evolution suggests that Stigmurin and Olabogan are active AMPs, while GQ20 is inactive. Source data are provided as a Source Data file.CC BY · PubMed Central
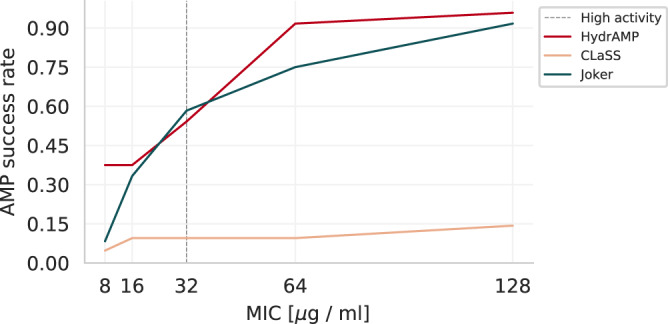
Fig. 7 AMP success rates depending on activity threshold. AMP success rate (y-axis) for different MIC thresholds (MIC measured in units [μg / mL]; x-axis), for different methods: HydrAMP (red), CLaSS (beige), Joker (dark green). Source data are provided as a Source Data file.
Fig. 7 AMP success rates depending on activity threshold. AMP success rate (y-axis) for different MIC thresholds (MIC measured in units [μg / mL]; x-axis), for different methods: HydrAMP (red), CLaSS (beige), Joker (dark green). Source data are provided as a Source Data file.CC BY · PubMed Central
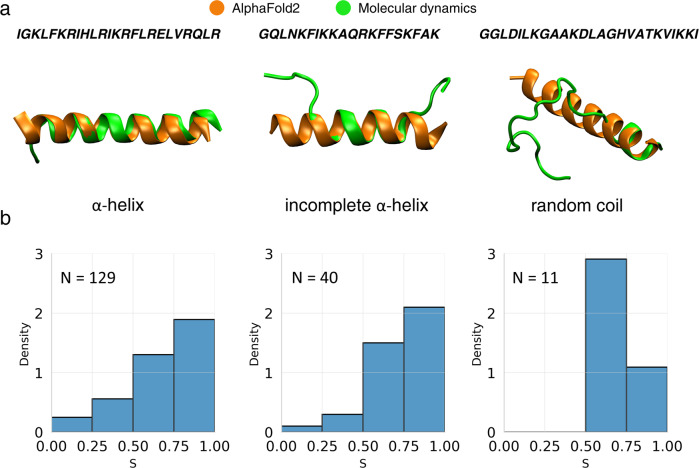
Fig. 8 Peptide structures according to MD simulations and AlphaFold2 predictions. a Left to right: representative structures for the last 100 ns of MD runs, for peptides with average helical content in [0.75, 1], [0.5, 0.75), (0,0.5) range, respectively (green), with superimposed AlphaFold2 predicted geometries (orange); bS distributions in corresponding peptide groups. Source data are provided as a Source Data file.
Fig. 8 Peptide structures according to MD simulations and AlphaFold2 predictions. a Left to right: representative structures for the last 100 ns of MD runs, for peptides with average helical content in [0.75, 1], [0.5, 0.75), (0,0.5) range, respectively (green), with superimposed AlphaFold2 predicted geometries (orange); bS distributions in corresponding peptide groups. Source data are provided as a Source Data file.CC BY · PubMed Central

Verification

Claims the paper makes

The claims and statistics of this paper haven’t been checked yet.

Run the check — free, no account needed. It reads the open-access text and checks the sources it cites.

A few free checks a day · papers already verified open instantly · results are public

Self-check

Percentages, sums and reported differences re-computed from the paper’s own numbers.

The self-check needs the paper’s full text.

Citations

Cites

Show all 78 references

Research works printed but not linked: 17

  1. O’Neill, J. Tackling drug-resistant infections globally: final report and recommendations. The Review on Antimicrobial Resistance, Government of the United Kingdom (2016).
  2. Lee, E., Fulan, B., Wong, G. & Ferguson, A. Mapping membrane activity in undiscovered peptide sequence space using machine learning. Proc. Natl. Acad. Sci. USA. 113, 13588–13593 (2016). · DOI
  3. Das, P.et al. PepCVAE: Semi-supervised targeted design of antimicrobial peptide sequences. arXiv preprint arXiv:1810.07743 (2018). · arXiv
  4. Tucs, A. et al. Generating ampicillin-level antimicrobial peptides with activity-aware generative adversarial networks. ACS Omega 5, 22847–22851 (2020). · DOI
  5. Kingma, D. P., Mohamed, S., Jimenez Rezende, D. & Welling, M. Semi-supervised learning with deep generative models. Adv. Neur. Inform. Process. Syst. 27, arXiv:1406.5298v2 (2014). · arXiv
  6. Witten, J. & Witten, Z.Deep learning regression model for antimicrobial peptide design. Accessed 01.02.2023 from https://github.com/zswitten/Antimicrobial-Peptides. (2019). · DOI
  7. Jang, E., Gu, S. & Poole, B. Categorical Reparameterization with Gumbel-Softmax. arXiv preprint arXiv:1611.01144 (2017). · arXiv
  8. Vaswani, A. et al. Attention Is All You Need. arXiv preprint arXiv:1706.03762 (2017). · arXiv
  9. Detlefsen, N. S., Hauberg, S. & Boomsma, W. What is a meaningful representation of protein sequences? arXiv preprint arXiv:2012.02679 (2012). · arXiv
  10. Theis, L., Oord, A. V. D. & Bethge, M. A note on the evaluation of generative models. arXiv preprint arXiv:1511.01844 (2015). · arXiv
  11. Hu, Z., Yang, Z., Liang, X., Salakhutdinov, R. & Xing, E. P. Toward controlled generation of text. arXiv preprint arXiv:1703.00955 (2017). · arXiv
  12. Higgins, I.et al. beta-VAE: Learning Basic Visual Concepts with a Constrained Variational Framework.International conference on learning representations (2017).
  13. Kingma, D. P. & Welling, M. Auto-encoding variational bayes. arXiv preprint arXiv:1312.6114 (2013). · arXiv
  14. Kingma, D. P. & Ba, J. Adam: A method for stochastic optimization. arXiv preprint arXiv:1412.6980 (2014). · arXiv
  15. Ghosh, P., Sajjadi, M. S. M., Vergari, A., Black, M. & Scholkopf, B. From Variational to Deterministic Autoencoders. arXiv preprint arXiv:1903.12436 (2019). · arXiv
  16. Tomczak, J. & Welling, M. VAE with a VampPrior in Proceedings of the Twenty-First International Conference on Artificial Intelligence and Statistics (eds Storkey, A. & Perez-Cruz, F.) 84 1214–1223 (PMLR, 2018).
  17. Clinical & (CLSI), L. S. I. Methods for Dilution Antimicrobial Susceptibility Tests for Bacteria That Grow Aerobically; Approved Standard-Ninth Edition; Document M07-A8 (2012).

Cited by

Sorted by citations

See all 239

Metadata

Authors
Szymczak, P., Możejko, M., Grzegorzek, T., Jurczak, R., Bauer, M., Neubauer, D., Sikora, K., Michalski, M., Sroka, J., Setny, P., Kamysz, W., & Szczurek, E.
Affiliations
  • University of Warsaw (PL)
  • Nvidia (United States) (US)
  • Gdańsk Medical University (PL)
Corresponding author
Szczurek, Ewa
Venue
Nature Communications
Published
2023-03-15
Volume
14
Issue
1
Pages
1453-1453
ISSN
2041-1723 (ISSN-L)
OpenAlex
W4324344300
Cited by
231
References
78
Citations by year
2026: 85 · 2025: 88 · 2024: 49 · 2023: 9
FWCI
42.06
Type
journal article
Language
en
Open access
Locations
  • Nature Communications (publishedVersion, cc-by)
  • bioRxiv (Cold Spring Harbor Laboratory) (acceptedVersion, cc-by-nc-nd)
  • PubMed Central (publishedVersion, cc-by)
  • PubMed (publishedVersion)
  • ReIn UW (University of Warsaw) (submittedVersion, cc-by-nc-nd)
  • RePEc: Research Papers in Economics (submittedVersion)
  • DOAJ (DOAJ: Directory of Open Access Journals) (submittedVersion, cc-by-sa)
Funders
  • Nvidia
  • Narodowym Centrum Nauki
  • Uniwersytet Warszawski
  • Interdyscyplinarne Centrum Modelowania Matematycznego i Komputerowego UW
Topics
  • Life Sciences › Immunology and Microbiology › Microbiology › Antimicrobial Peptides and Activities
  • Life Sciences › Pharmacology, Toxicology and Pharmaceutics › Drug Discovery › Computational Drug Discovery Methods
  • Physical Sciences › Chemistry › Organic Chemistry › Chemical Synthesis and Analysis
Keywords
antimicrobial peptides, conditional variational autoencoder, deep generative models, peptide production, antimicrobial resistance, peptide analogues, disentangled representations, molecular dynamics simulation
MeSH terms
Antimicrobial Peptides, Anti-Infective Agents, Bacteria, Antimicrobial Cationic Peptides

About these checks

Registry, retraction, Cites and statistics results are computed, not judged, with one exception: a printed reference that no index lists is read once by a model before it counts as a citation error. Claims are extracted by a model and kept only when their quote appears verbatim in the text; each cited source is then checked, with a model’s help, for whether it says what the claim relies on. Those verdicts can be wrong — read the claim’s quote and the cited source before relying on one.

Statistics and arithmetic are recomputed, not judged.

Confidence bands are shown only for fields calibrated on our annotated test set. None is calibrated yet, so no band is shown.

What counts as a claim ›How we measure confidence ›How we check this ›

Are you an author, or do you see a problem with this page? Request a review