

The DOI matches its Crossref record; 68 of the 68 references it cites were found in a registry or an index.
Multi-modal quantification of pathway activity with MAYA
Open accessAbstract
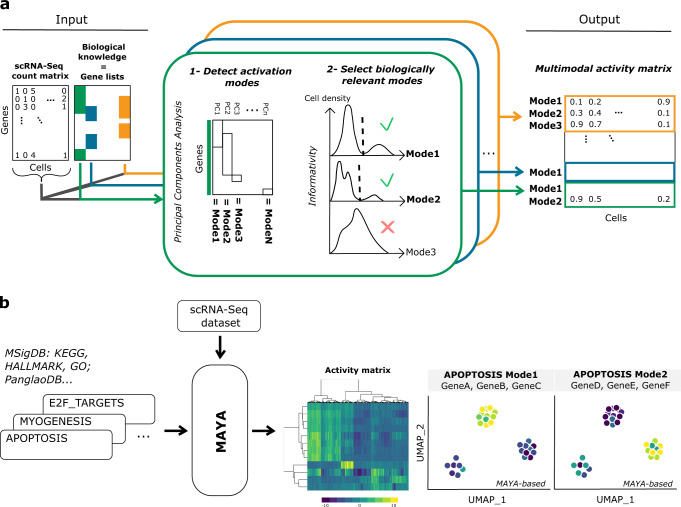
Signaling pathways can be activated through various cascades of genes depending on cell identity and biological context. Single-cell atlases now provide the opportunity to inspect such complexity in health and disease. Yet, existing reference tools for pathway scoring resume activity of each pathway to one unique common metric across cell types. Here, we present MAYA, a computational method that enables the automatic detection and scoring of the diverse modes of activation of biological pathways across cell populations. MAYA improves the granularity of pathway analysis by detecting subgroups of genes within reference pathways, each characteristic of a cell population and how it activates a pathway. Using multiple single-cell datasets, we demonstrate the biological relevance of identified modes of activation, the robustness of MAYA to noisy pathway lists and batch effect. MAYA can also predict cell types starting from lists of reference markers in a cluster-free manner. Finally, we show that MAYA reveals common modes of pathway activation in tumor cells across patients, opening the perspective to discover shared therapeutic vulnerabilities.
Overview
The claims and statistics of this paper haven’t been checked yet.
Free: it reads the open-access text and checks the first 5 claims that cite a source we can check. Create a free account to check every claim.
Integrity signals
Registry
Cites
Statistics
Figures


Verification
Claims the paper makes
The claims and statistics of this paper haven’t been checked yet.
Free: it reads the open-access text and checks the first 5 claims that cite a source we can check. Create a free account to check every claim.
Self-check
Percentages, sums and reported differences re-computed from the paper’s own numbers.
The self-check needs the paper’s full text.
Citations
Cites
The Molecular Signatures Database Hallmark Gene Set Collection
Liberzon, A., Birger, C., Thorvaldsdóttir, H., Ghandi, M., Mesirov, J. P., & Tamayo, P. (2015) · Cell Systems · doi:10.1016/j.cels.2015.12.004 · Cited by 13,807
Integrating single-cell transcriptomic data across different conditions, technologies, and species
Butler, A., Hoffman, P., Smibert, P., Papalexi, E., & Satija, R. (2018) · Nature Biotechnology · doi:10.1038/nbt.4096 · Cited by 13,174 · cited 3×
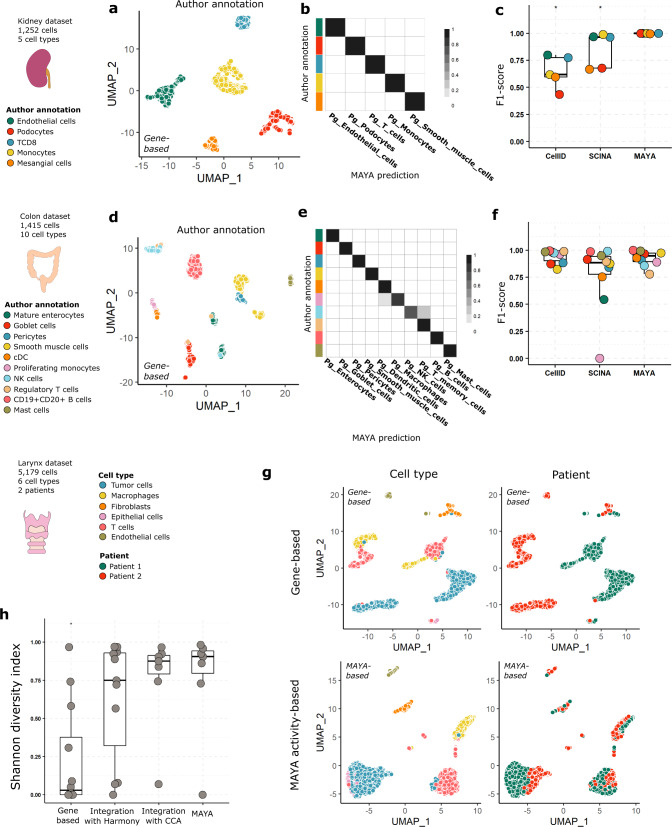
“To quantify the inter-patient overlap between clusters of similar cell types, we computed the Shannon Diversity Index (SDI) for both methods as well as for clusters obtained with the reference integration tool Harmony 42 and an integration method based on Canonical Correlation Analysis 43 (CCA) (Supplementary Fig.”
MethodInfluentialFast, sensitive and accurate integration of single-cell data with Harmony
Korsunsky, I., Millard, N., Fan, J., Slowikowski, K., Zhang, F., Wei, K., Baglaenko, Y., Brenner, M., Loh, P.-R., & Raychaudhuri, S. (2019) · Nature Methods · doi:10.1038/s41592-019-0619-0 · Cited by 10,488
Molecular signatures database (MSigDB) 3.0
Liberzon, A., Subramanian, A., Pinchback, R., Thorvaldsdóttir, H., Tamayo, P., & Mesirov, J. P. (2011) · Bioinformatics · doi:10.1093/bioinformatics/btr260 · Cited by 7,111 · cited 1×
“…illustrated the relevance of the biological insight gained by using multimodal pathway analysis for another tissue with a dataset of colon and immune cells from Lee et al. 22 - from which we selected cells from 10 distinct cell types (n=1,415) - and using the MSigDB KEGG and REACTOME pathways 23 .”
MethodScenic: single-cell regulatory network inference and clustering.
Aibar, S., González-Blas, C. B., Moerman, T., Huynh-Thu, V. A., Imrichova, H., Hulselmans, G., Rambow, F., Marine, J.-C., Geurts, P., Aerts, J., et al. (2017) · Nature Methods · doi:10.1038/nmeth.4463 · Cited by 6,520
Dissecting the multicellular ecosystem of metastatic melanoma by single-cell RNA-seq
Tirosh, I., Izar, B., Prakadan, S. M., Wadsworth, M. H., Treacy, D., Trombetta, J. J., Rotem, A., Rodman, C., Lian, C., Murphy, G., et al. (2016) · Science · doi:10.1126/science.aad0501 · Cited by 4,944
An Integrative Model of Cellular States, Plasticity, and Genetics for Glioblastoma
Neftel, C., Laffy, J., Filbin, M. G., Hara, T., Shore, M. E., Rahme, G. J., Richman, A. R., Silverbush, D., Shaw, M. L., Hebert, C. M., et al. (2019) · Cell · doi:10.1016/j.cell.2019.06.024 · Cited by 2,873
Zhan, T., Rindtorff, N., & Boutros, M. (2017) · Oncogene · doi:10.1038/onc.2016.304 · Cited by 2,626 · cited 1×
“It is indeed known from the literature that Wnt signaling is a complex pathway involving β -catenin in its canonical form, but at least three other non-canonical Wnt-mediated pathways have been proposed to function independently of β -catenin 60 .”
BackgroundPuram, S. V., Tirosh, I., Parikh, A. S., Patel, A. P., Yizhak, K., Gillespie, S., Rodman, C., Luo, C. L., Mroz, E. A., Emerick, K. S., et al. (2017) · Cell · doi:10.1016/j.cell.2017.10.044 · Cited by 2,557 · cited 2×
“Cells of the microenvironment coming from different patients can easily group together, showing the absence of a major batch effect between samples, while tumor cells form distinct clusters 4 – 9 .”
BackgroundCurrent best practices in single-cell RNA-seq analysis: a tutorial
Luecken, M. D., & Theis, F. J. (2019) · Molecular Systems Biology · doi:10.15252/msb.20188746 · Cited by 2,231 · cited 1×
“Standard scRNA-seq analysis pipelines involve steps of dimensionality reduction and clustering before starting any marker or pathway analysis 1 – 3 , which makes the resulting conclusions highly dependent on the chosen algorithm and clustering parameters.”
Method
Cited by
Qin, L., Liu, Z., Guo, S., Han, Y., Wang, X., Ren, W. T., Chen, J., Zhen, H., Nie, C., Xing, K.-K., et al. (2024) · Molecular Psychiatry · doi:10.1038/s41380-024-02659-6 · Cited by 26
From CFTR to a CF signalling network: a systems biology approach to study Cystic Fibrosis
Najm, M., Martignetti, L., Cornet, M., Kelly, M., Sermet‐Gaudelus, I., Calzone, L., & Stoven, V. (2024) · BMC Genomics · doi:10.1186/s12864-024-10752-x · Cited by 6
Huang, Z., Zheng, Y., Wang, W., Zhou, W., Zhang, Y., Chen, W., Zhang, X., Jin, X., & Yin, J. (2024) · Communications Biology · doi:10.1038/s42003-024-07238-7 · Cited by 5
Representation and quantification of module activity from omics data with rROMA
Najm, M., Cornet, M., Albergante, L., Zinovyev, A. Y., Sermet‐Gaudelus, I., Stoven, V., Calzone, L., & Martignetti, L. (2024) · npj Systems Biology and Applications · doi:10.1038/s41540-024-00331-x · Cited by 6
Li, Q., Nichols, C., Welner, R. S., Chen, J., Ku, W.-S., & Yue, Z.-L. (2024) · bioRxiv · doi:10.1101/2024.10.20.619308 · Cited by 1
“Additionally, with the prevalence of single-cell data analysis, cell-type-specific and cluster-specific super-PAGs can be generated using cell-based multi-omics profiles [69].”
Background
Metadata
- Authors
- Landais, Y., & Vallot, C.
- Affiliations
- Centre National de la Recherche Scientifique (FR)
- Corresponding author
- Vallot, Céline
- Venue
- Nature Communications
- Published
- 2023-03-25
- Volume
- 14
- Issue
- 1
- Pages
- 1668-1668
- ISSN
- 2041-1723 (ISSN-L)
- PMC
- PMC10039856
- OpenAlex
- W4360938434
- Cited by
- 9
- References
- 68
- Citations by year
- 2026: 1 · 2024: 5 · 2023: 3
- FWCI
- 0.80
- Type
- journal article
- Language
- en
- Open access
- gold
- doi.org
- Licence
- cc-by
- creativecommons.org/licenses/by/4.0 (tdm)
- creativecommons.org/licenses/by/4.0 (vor)
- Locations
- Nature Communications (publishedVersion, cc-by)
- bioRxiv (Cold Spring Harbor Laboratory) (acceptedVersion, cc-by-nc-nd)
- PubMed Central (publishedVersion, cc-by)
- PubMed (publishedVersion)
- HAL (submittedVersion, other-oa)
- RePEc: Research Papers in Economics (submittedVersion)
- DOAJ (DOAJ: Directory of Open Access Journals) (submittedVersion, cc-by-sa)
- Topics
- Life Sciences › Biochemistry, Genetics and Molecular Biology › Molecular Biology › Single-cell and spatial transcriptomics
- Life Sciences › Biochemistry, Genetics and Molecular Biology › Molecular Biology › Bioinformatics and Genomic Networks
- Life Sciences › Biochemistry, Genetics and Molecular Biology › Molecular Biology › Gene Regulatory Network Analysis
- Keywords
- signaling pathways, single-cell transcriptomics, cell type annotation, tumor cell populations, therapeutic vulnerabilities
About these checks
Registry, retraction, Cites and statistics results are computed, not judged, with one exception: a printed reference that no index lists is read once by a model before it counts as a citation error. Claims are extracted by a model and kept only when their quote appears verbatim in the text; each cited source is then checked, with a model’s help, for whether it says what the claim relies on. Those verdicts can be wrong — read the claim’s quote and the cited source before relying on one.
Statistics and arithmetic are recomputed, not judged.
Confidence bands are shown only for fields calibrated on our annotated test set. None is calibrated yet, so no band is shown.
What counts as a claim ›How we measure confidence ›How we check this ›
Are you an author, or do you see a problem with this page? Request a review
How to cite
Cite CoChat for the checks on this page, and the paper for its own findings.
- This page
- CoChat. (2026). Citation check: Multi-modal quantification of pathway activity with MAYA. https://app.cochat.ai/papers/10.1038/s41467-023-37410-2
- The paper
- Landais, Y., & Vallot, C. (2023). Multi-modal quantification of pathway activity with MAYA. Nature Communications. https://doi.org/10.1038/s41467-023-37410-2
Data sources
Bibliographic data: Semantic Scholar, OpenAlex, Crossref.
Contains information from the Semantic Scholar Academic Graph Datasets, made available under the ODC Attribution License (ODC-BY 1.0).
Semantic Scholar’s data is described in: Kinney, R., et al. (2023). The Semantic Scholar Open Data Platform. arXiv:2301.10140.
