

The DOI matches its Crossref record; 5 of the 5 references it cites were found in a registry or an index.
DeMAG predicts the effects of variants in clinically actionable genes by integrating structural and evolutionary epistatic features
Open accessPublished version of a preprint
Abstract
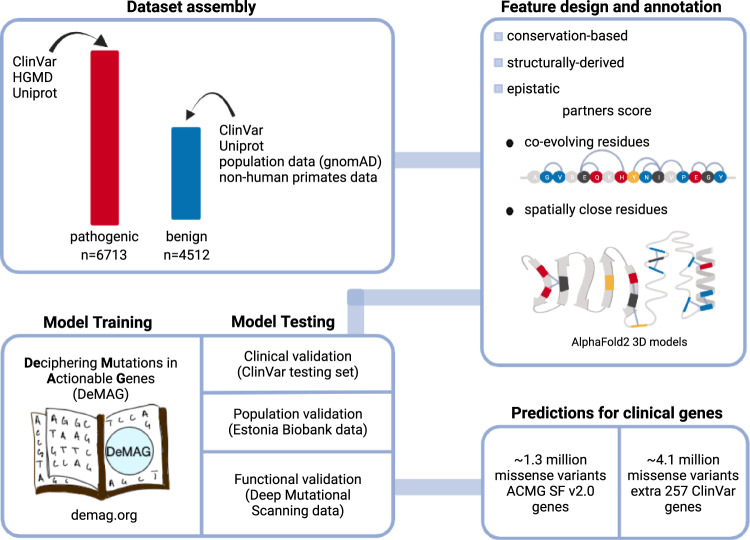
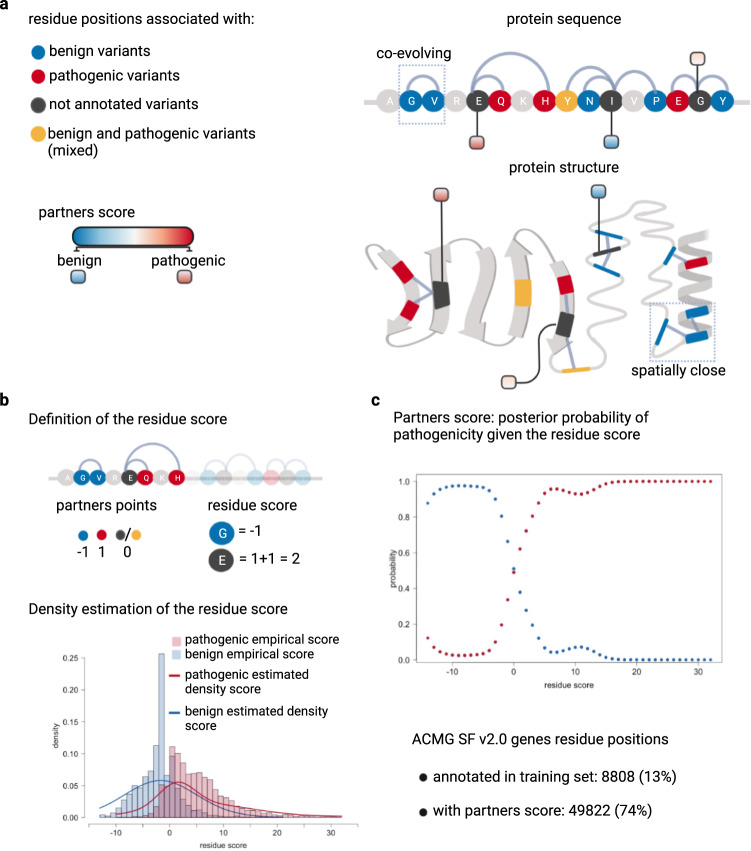
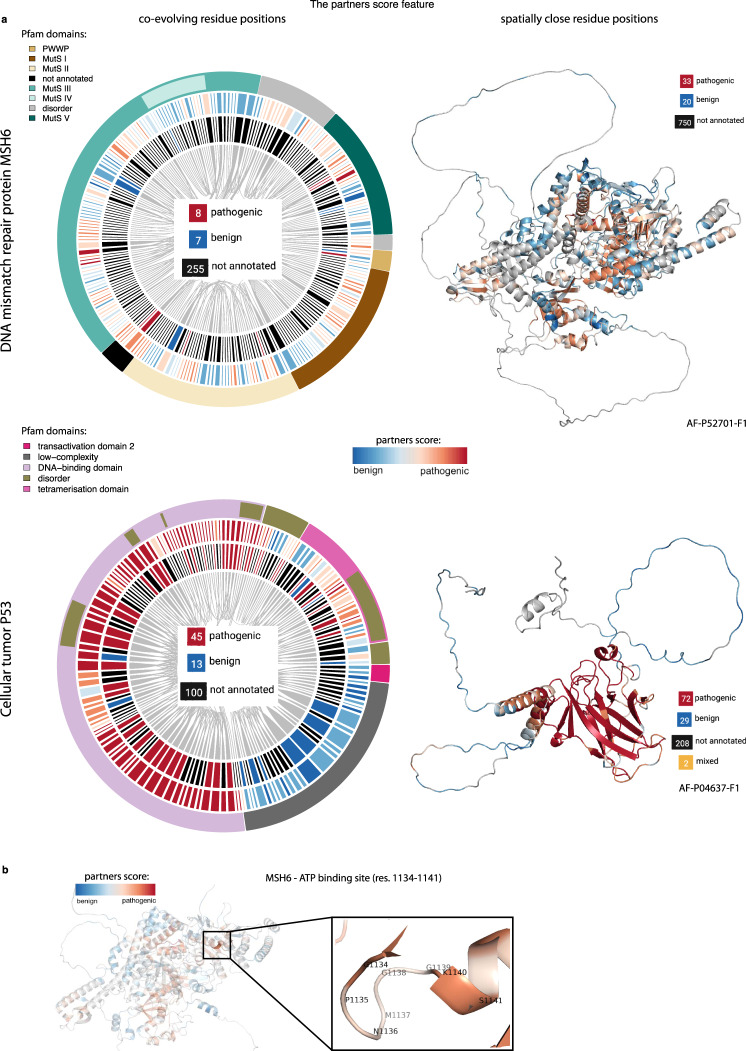
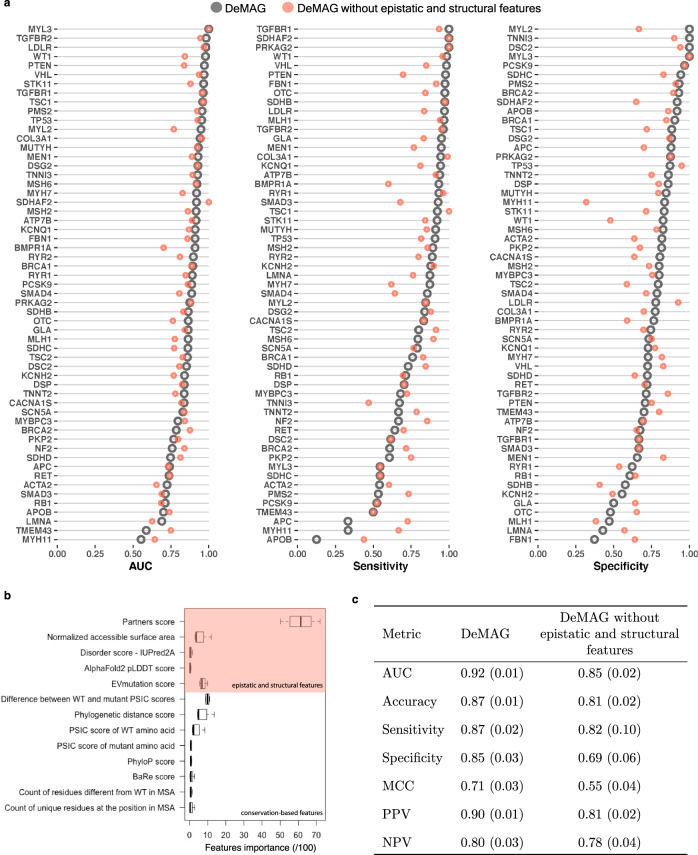
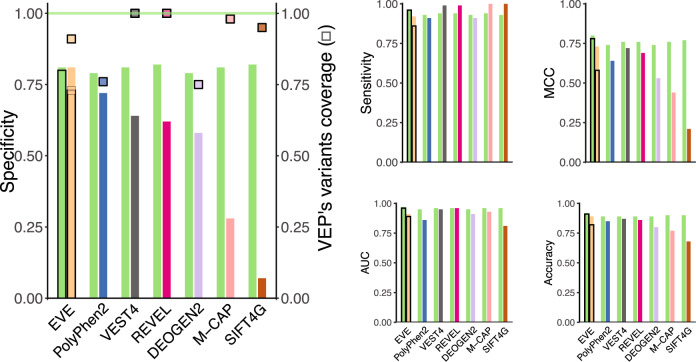
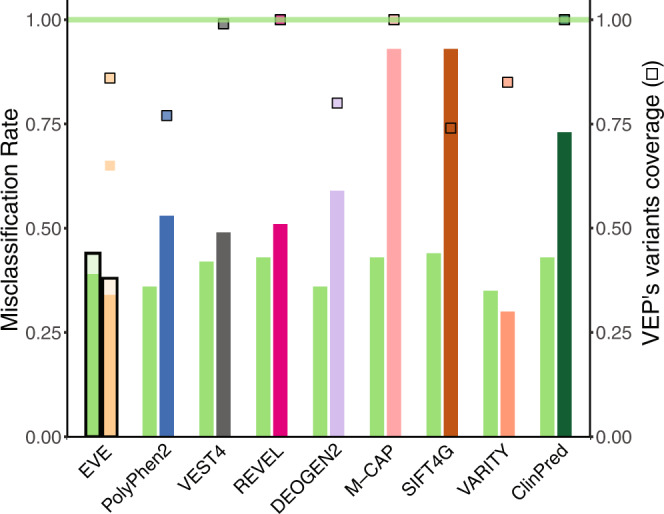
Despite the increasing use of genomic sequencing in clinical practice, the interpretation of rare genetic variants remains challenging even in well-studied disease genes, resulting in many patients with Variants of Uncertain Significance (VUSs). Computational Variant Effect Predictors (VEPs) provide valuable evidence in variant assessment, but they are prone to misclassifying benign variants, contributing to false positives. Here, we develop Deciphering Mutations in Actionable Genes (DeMAG), a supervised classifier for missense variants trained using extensive diagnostic data available in 59 actionable disease genes (American College of Medical Genetics and Genomics Secondary Findings v2.0, ACMG SF v2.0). DeMAG improves performance over existing VEPs by reaching balanced specificity (82%) and sensitivity (94%) on clinical data, and includes a novel epistatic feature, the ‘ partners score’, which leverages evolutionary and structural partnerships of residues. The ‘partners score’ provides a general framework for modeling epistatic interactions, integrating both clinical and functional information. We provide our tool and predictions for all missense variants in 316 clinically actionable disease genes (demag.org) to facilitate the interpretation of variants and improve clinical decision-making.
Overview
The claims and statistics of this paper haven’t been checked yet.
Run the check — free, no account needed. It reads the open-access text and checks the sources it cites.
Integrity signals
Registry
Cites
Statistics
Figures
Verification
Claims the paper makes
The claims and statistics of this paper haven’t been checked yet.
Run the check — free, no account needed. It reads the open-access text and checks the sources it cites.
Self-check
Percentages, sums and reported differences re-computed from the paper’s own numbers.
The self-check needs the paper’s full text.
Citations
Cites
Highly accurate protein structure prediction with AlphaFold
Jumper, J., Evans, R., Pritzel, A., Green, T., Figurnov, M., Ronneberger, O., Tunyasuvunakool, K., Bates, R., Žídek, A., Potapenko, A., et al. (2021) · Nature · doi:10.1038/s41586-021-03819-2 · Cited by 43,764
Richards, S., Aziz, N., Bale, S., Bick, D., Das, S., Gastier-Foster, J., Grody, W. W., Hegde, M., Lyon, E., Spector, E., et al. (2015) · Genetics in Medicine · doi:10.1038/gim.2015.30 · Cited by 32,594
Protein 3D Structure Computed from Evolutionary Sequence Variation
Marks, D. S., Colwell, L. J., Sheridan, R., Hopf, T. A., Pagnani, A., Zecchina, R., & Sander, C. (2011) · PLoS ONE · doi:10.1371/journal.pone.0028766 · Cited by 1,144
Disease variant prediction with deep generative models of evolutionary data
Frazer, J., Notin, P., Dias, M., Gomez, A., Min, J. K., Brock, K., Gal, Y., & Marks, D. S. (2021) · Nature · doi:10.1038/s41586-021-04043-8 · Cited by 791
Mutation effects predicted from sequence co-variation
Hopf, T. A., Ingraham, J. B., Poelwijk, F. J., Schärfe, C. P. I., Springer, M., Sander, C., & Marks, D. S. (2017) · Nature Biotechnology · doi:10.1038/nbt.3769 · Cited by 775
Research works printed but not linked: 67
- Miller, D. T. et al. ACMG SF v3.0 list for reporting of secondary findings in clinical exome and genome sequencing: a policy statement of the American College of Medical Genetics and Genomics (ACMG). Genet. Med. 23, 1381–1390 (2021). · DOI
- Kalia, S. S. et al. Recommendations for reporting of secondary findings in clinical exome and genome sequencing, 2016 update (ACMG SF v2.0): a policy statement of the American College of Medical Genetics and Genomics. Genet. Med. 19, 249–255 (2017). · DOI
- Green, R. C. et al. ACMG recommendations for reporting of incidental findings in clinical exome and genome sequencing. Genet. Med. 15, 565–574 (2013). · DOI
- Landrum, M. J. et al. ClinVar: public archive of relationships among sequence variation and human phenotype. Nucleic Acids Res. 42, D980–D985 (2014). · DOI · Paper page
- Makhnoon, S., Shirts, B. H. & Bowen, D. J. Patients’ perspectives of variants of uncertain significance and strategies for uncertainty management. J. Genet. Couns. 28, 313–325 (2019). · DOI
- Murray, M. L., Cerrato, F., Bennett, R. L. & Jarvik, G. P. Follow-up of carriers of BRCA1 and BRCA2 variants of unknown significance: Variant reclassification and surgical decisions. Genet. Med. 13, 998–1005 (2011). · DOI
- Ong, M.-S. & Mandl, K. D. National expenditure for false-positive mammograms and breast cancer overdiagnoses estimated at $4 billion a year. Health Aff. 34, 576–583 (2015). · DOI
- Adzhubei, I. A. et al. A method and server for predicting damaging missense mutations. Nat. Methods 7, 248–249 (2010). · DOI · Paper page
- Carter, H., Douville, C., Stenson, P. D., Cooper, D. N. & Karchin, R. Identifying Mendelian disease genes with the Variant Effect Scoring Tool. BMC Genomics 14, S3 (2013). · DOI
- Jagadeesh, K. A. et al. M-CAP eliminates a majority of variants of uncertain significance in clinical exomes at high sensitivity. Nat. Genet. 48, 1581–1586 (2016). · DOI
- Ioannidis, N. M. et al. ARTICLE REVEL: an ensemble method for predicting the pathogenicity of rare missense variants. Am. J. Hum. Genet. 99, 877–885 (2016). · DOI · Paper page
- Wu, Y., Li, R., Sun, S., Weile, J. & Roth, F. P. Improved pathogenicity prediction for rare human missense variants. Am. J. Hum. Genet. 108, 1891–1906 (2021). · DOI
- Amendola, L. M. et al. Performance of ACMG-AMP variant-interpretation guidelines among nine laboratories in the clinical sequencing exploratory research consortium. Am. J. Hum. Genet. 98, 1067–1076 (2016). · DOI
- Jordan, D. M. et al. Development and validation of a computational method for assessment of missense variants in hypertrophic cardiomyopathy. Am. J. Hum. Genet. 88, 183–192 (2011). · DOI
- Riesselman, A. J., Ingraham, J. B. & Marks, D. S. Deep generative models of genetic variation capture the effects of mutations. Nat. Methods 15, 816–822 (2018). · DOI · Paper page
- Toth-Petroczy, A. et al. Structured states of disordered proteins from genomic sequences HHS Public Access ETOC blurb. Cell 167, 158–170 (2016). · DOI
- Livesey, B. J. & Marsh, J. A. Using deep mutational scanning to benchmark variant effect predictors and identify disease mutations. Mol. Syst. Biol. 16, 1–12 (2020). · DOI
- Grimm, D. G. et al. The evaluation of tools used to predict the impact of missense variants is hindered by two types of circularity. Hum. Mutat. 36, 513–523 (2015). · DOI · Paper page
- Amendola, L. M. et al. Actionable exomic incidental findings in 6503 participants: challenges of variant classification. Genome Res. 25, 305–315 (2015). · DOI
- Cubuk, C. et al. Clinical likelihood ratios and balanced accuracy for 44 in silico tools against multiple large-scale functional assays of cancer susceptibility genes. Genet. Med. 23, 2096–2104 (2021). · DOI
- Ng, P. C. & Henikoff, S. SIFT: Predicting amino acid changes that affect protein function. Nucleic Acids Res. 31, 3812–3814 (2003). · DOI
- Sunyaev, S. R. et al. PSIC: profile extraction from sequence alignments with position-specific counts of independent observations. Protein Eng. 12, 387–394 (1999). · DOI
- Jordan, D. M. Predicting The Effects Of Missense Variation On Protein Structure, Function, And Evolution. ProQuest Dissertations and Theses. Vol. 132 (Harvard University, Graduate School of Arts & Sciences, 2015).
- Breen, M. S., Kemena, C., Vlasov, P. K., Notredame, C. & Kondrashov, F. A. Epistasis as the primary factor in molecular evolution. Nature 490, 535–538 (2012). · DOI
- Poelwijk, F. J., Socolich, M. & Ranganathan, R. Learning the pattern of epistasis linking genotype and phenotype in a protein. Nat. Commun. 10, 4213 (2019). · DOI
- Kondrashov, A. S., Sunyaev, S. & Kondrashov, F. A. Dobzhansky-Muller incompatibilities in protein evolution. Proc. Natl Acad. Sci. USA 99, 14878–14883 (2002). · DOI
- Sundaram, L. et al. Predicting the clinical impact of human mutation with deep neural networks. Nat. Genet. 50, 1161–1170 (2018). · DOI
- Davis, J. E., Voisine, C. & Craig, E. A. Intragenic suppressors of Hsp70 mutants: interplay between the ATPase- and peptide-binding domains. Proc. Natl Acad. Sci. USA 96, 9269–9276 (1999). · DOI
- Izumi, T. et al. Intragenic suppression of an active site mutation in the human apurinic/apyrimidinic endonuclease. J. Mol. Biol. 287, 47–57 (1999). · DOI
- Chen, R., Grobler, J. A., Hurley, J. H. & Dean, A. M. Second-site suppression of regulatory phosphorylation in Escherichia coli isocitrate dehydrogenase. Protein Sci. 5, 287–295 (1996). · DOI
- Marín, Ò., Aguirre, J. & de la Cruz, X. Compensated pathogenic variants in coagulation factors VIII and IX present complex mapping between molecular impact and hemophilia severity. Sci. Rep. 9, 9538 (2019). · DOI
- Baresić, A., Hopcroft, L. E. M., Rogers, H. H., Hurst, J. M. & Martin, A. C. R. Compensated pathogenic deviations: analysis of structural effects. J. Mol. Biol. 396, 19–30 (2010). · DOI
- Klein, G. & Georgopoulos, C. Identification of important amino acid residues that modulate binding of Escherichia coli GroEL to its various cochaperones. Genetics 158, 507–517 (2001). · DOI
- Tóth-Petróczy, A. & Tawfik, D. S. Slow protein evolutionary rates are dictated by surface-core association. Proc. Natl Acad. Sci. USA 108, 11151–11156 (2011). · DOI
- Sunyaev, S., Ramensky, V. & Bork, P. Towards a structural basis of human non-synonymous single nucleotide polymorphisms. Trends Genet. 16, 198–200 (2000). · DOI
- Stenson, P. D. et al. Human Gene Mutation Database (HGMD): 2003 update. Hum. Mutat. 21, 577–581 (2003). · DOI
- Karczewski, K. J. et al. The mutational constraint spectrum quantified from variation in 141,456 humans. Nature 581, 434–443 (2020). · DOI · Paper page
- Su Jung, K. et al. KRGDB: the large-scale variant database of 1722 Koreans based on whole genome sequencing Citation details. Database 2019, 146 (2018).
- Tadaka, S. et al. 3.5KJPNv2: an allele frequency panel of 3552 Japanese individuals including the X chromosome. Hum. Genome Var. 18, 6–28 (2019).
- Marks, D. S., Hopf, T. A. & Sander, C. Protein structure prediction from sequence variation. Nat. Biotechnol. 30, 1072–1080 (2012). · DOI · Paper page
- Fraley, C. & Raftery, A. E. Model-based clustering, discriminant analysis, and density estimation. J. Am. Stat. Assoc. 97, 611–631 (2002). · DOI
- Mistry, J. et al. Pfam: the protein families database in 2021. Nucleic Acids Res. 49, D412–D419 (2021). · DOI · Paper page
- Graham, W. J. 5th, Putnam, C. D. & Kolodner, R. D. The properties of Msh2-Msh6 ATP binding mutants suggest a signal amplification mechanism in DNA mismatch repair. J. Biol. Chem. 293, 18055–18070 (2018). · DOI
- Friedman, J. H. Greedy function approximation: a gradient boosting machine. Ann. Stat. 29, 1189–1232 (2001). · DOI · Paper page
- Friedman, J., Tibshirani, R. & Hastie, T. Additive logistic regression: a statistical view of boosting (With discussion and a rejoinder by the authors). Ann. Stat. 28, 337–407 (2000). · DOI · Paper page
- Livesey, B. J. & Marsh, J. A. Interpreting protein variant effects with computational predictors and deep mutational scanning. Dis. Model. Mech. 15, dmm049510 (2022). · DOI
- Reeb, J., Wirth, T. & Rost, B. Variant effect predictions capture some aspects of deep mutational scanning experiments. BMC Bioinform. 21, 107 (2020). · DOI
- Findlay, G. M. et al. Accurate classification of BRCA1 variants with saturation genome editing. Nature 562, 217–222 (2018). · DOI · Paper page
- Fayer, S. et al. Closing the gap: systematic integration of multiplexed functional data resolves variants of uncertain significance in BRCA1, TP53, and PTEN. Am. J. Hum. Genet. 108, 2248–2258 (2021). · DOI
- Livesey, B. J. & Marsh, J. A. Updated benchmarking of variant effect predictors using deep mutational scanning. bioRxiv https://doi.org/10.1101/2022.11.19.517196 (2022). · DOI
- Kotler, E., Shani, O., Marks, D. S., Oren, M. & Segal, E. A systematic p53 mutation library links differential functional impact to cancer mutation pattern and evolutionary conservation. Mol. Cell 71, 178–190 (2018). · DOI
- Matreyek, K. A. et al. Multiplex assessment of protein variant abundance by massively parallel sequencing. Nat. Genet. 50, 874–882 (2018). · DOI · Paper page
- Jia, X. et al. Massively parallel functional testing of MSH2 missense variants conferring Lynch syndrome risk. Am. J. Hum. Genet. 108, 163–175 (2021). · DOI
- Vaser, R., Adusumalli, S., Leng, S. N., Sikic, M. & Ng, P. C. SIFT missense predictions for genomes. Nat. Protoc. 11, 1–9 (2016). · DOI · Paper page
- Raimondi, D. et al. DEOGEN2: prediction and interactive visualization of single amino acid variant deleteriousness in human proteins. Nucleic Acids Res. 45, 201–206 (2017). · DOI
- Alver, M. et al. Recall by genotype and cascade screening for familial hypercholesterolemia in a population-based biobank from Estonia. Genet. Med. 21, 1173–1180 (2019). · DOI
- Alirezaie, N., Kernohan, K. D., Hartley, T., Majewski, J. & Hocking, T. D. ClinPred: prediction tool to identify disease-relevant nonsynonymous single-nucleotide variants. Am. J. Hum. Genet. 103, 474–483 (2018). · DOI
- Dines, J. N. et al. Systematic misclassification of missense variants in BRCA1 and BRCA2 “coldspots.”. Genet. Med. 22, 825–830 (2020). · DOI
- Sy, S. M. H., Huen, M. S. Y. & Chen, J. PALB2 is an integral component of the BRCA complex required for homologous recombination repair. Proc. Natl Acad. Sci. USA 106, 7155–7160 (2009). · DOI
- Chicco, D. & Jurman, G. The advantages of the Matthews correlation coefficient (MCC) over F1 score and accuracy in binary classification evaluation. BMC Genomics 21, 1–13 (2020). · DOI · Paper page
- Phan, L. et al. ALFA: Allele Frequency Aggregator. (National Center for Biotechnology Information, U.S. National Library of Medicine, 2020) www.ncbi.nlm.nih.gov/snp/docs/gsr/alfa/.
- Liu, X., Li, C., Mou, C., Dong, Y. & Tu, Y. dbNSFP v4: a comprehensive database of transcript-specific functional predictions and annotations for human nonsynonymous and splice-site SNVs. Genome Med. 12, 103 (2020). · DOI
- Erdős, G. & Dosztányi, Z. Analyzing protein disorder with IUPred2A. Curr. Protoc. Bioinform. 70, e99 (2020). · DOI
- Hopf, T. A. et al. The EVcouplings Python framework for coevolutionary sequence analysis. Bioinformatics 35, 1582–1584 (2019). · DOI
- Scrucca, L., Fop, M., Murphy, T. B. & Raftery, A. E. mclust 5: clustering, classification and density estimation using gaussian finite mixture models. R. J. 8, 289–317 (2016). · DOI
- Schwarz, G. Estimating the dimension of a model. Ann. Stat. 6, 461–464 (1978). · DOI · Paper page
- Mészáros, B., Erdos, G. & Dosztányi, Z. IUPred2A: context-dependent prediction of protein disorder as a function of redox state and protein binding. Nucleic Acids Res. 46, W329–W337 (2018). · DOI
Metadata
- Authors
- Luppino, F., Adzhubei, I. A., Cassa, C. A., & Toth-Petroczy, A.
- Affiliations
- Center for Systems Biology Dresden (DE)
- Brigham and Women's Hospital (US)
- Corresponding author
- Cassa, Christopher A.
- Venue
- Nature Communications
- Published
- 2023-04-19
- Volume
- 14
- Issue
- 1
- Pages
- 2230-2230
- ISSN
- 2041-1723 (ISSN-L)
- PMC
- PMC10115847
- OpenAlex
- W4366405805
- Cited by
- 12
- References
- 5
- Citations by year
- 2026: 3 · 2025: 5 · 2024: 4
- FWCI
- 1.99
- Type
- journal article
- Language
- en
- Open access
- gold
- doi.org
- Locations
- Nature Communications (publishedVersion, cc-by)
- bioRxiv (Cold Spring Harbor Laboratory) (acceptedVersion)
- PubMed Central (publishedVersion, cc-by)
- PubMed (publishedVersion)
- RePEc: Research Papers in Economics (submittedVersion)
- DOAJ (DOAJ: Directory of Open Access Journals) (submittedVersion, cc-by-sa)
- Funders
- Max-Planck-Gesellschaft (MPRGL)
- U.S. Department of Health & Human Services | NIH | National Human Genome Research Institute (R01-HG010372)
- Topics
- Life Sciences › Biochemistry, Genetics and Molecular Biology › Genetics › Genomics and Rare Diseases
- Life Sciences › Biochemistry, Genetics and Molecular Biology › Genetics › Genetic Associations and Epidemiology
- Life Sciences › Biochemistry, Genetics and Molecular Biology › Cancer Research › Cancer Genomics and Diagnostics
- Keywords
- variant effect prediction, missense mutations, variants of uncertain significance, epistasis, protein structure, evolutionary conservation, variant interpretation
- MeSH terms
- Genetic Testing, Humans, United States, Genetic Variation, Mutation, Missense, Genomics
About these checks
Registry, retraction, Cites and statistics results are computed, not judged, with one exception: a printed reference that no index lists is read once by a model before it counts as a citation error. Claims are extracted by a model and kept only when their quote appears verbatim in the text; each cited source is then checked, with a model’s help, for whether it says what the claim relies on. Those verdicts can be wrong — read the claim’s quote and the cited source before relying on one.
Statistics and arithmetic are recomputed, not judged.
Confidence bands are shown only for fields calibrated on our annotated test set. None is calibrated yet, so no band is shown.
What counts as a claim ›How we measure confidence ›How we check this ›
Are you an author, or do you see a problem with this page? Request a review
