

The DOI matches its Crossref record; 74 of the 74 references it cites were found in a registry or an index; 6 of the 28 sources its claims cite were checked for support.
Leaf-venation-directed cellular alignment for macroscale cardiac constructs with tissue-like functionalities
Open accessPublished version of a preprint
Abstract
Recapitulating the complex structural, mechanical, and electrophysiological properties of native myocardium is crucial to engineering functional cardiac tissues. Here, we report a leaf-venation-directed strategy that enables the compaction and remodeling of cell-hydrogel hybrids into highly aligned and densely packed organizations in predetermined patterns. This strategy contributes to interconnected tubular structures with cell alignment along the hierarchical channels. Compared to randomly-distributed cells, the engineered leaf-venation-directed-cardiac tissues from neonatal rat cardiomyocytes manifest advanced maturation and functionality as evidenced by detectable electrophysiological activity, macroscopically synchronous contractions, and upregulated maturation genes. As a demonstration, human induced pluripotent stem cell-derived leaf-venation-directed-cardiac tissues are engineered with evident structural and functional improvement over time. With the elastic scaffolds, leaf-venation-directed tissues are assembled into 3D centimeter-scale cardiac constructs with programmed mechanical properties, which can be delivered through tubing without affecting cell viability. The present strategy may generate cardiac constructs with multifaceted functionalities to meet clinical demands.
Overview
CoChat Summary
TL;DR
The paper reports a leaf-venation-directed (LVD) strategy that uses leaf-venation-inspired microchannels to guide cell/fibrin hydrogel self-assembly into highly aligned, densely packed, interconnected tubular cardiac and vascular tissues. Engineered LVD tissues from rat CMs and hiPSC-CMs showed maturation and electrophysiological improvements, and with EHD-printed PCL scaffolds were assembled into 3D centimeter-scale constructs that could be rolled and delivered through tubing without reducing viability.
Key findings
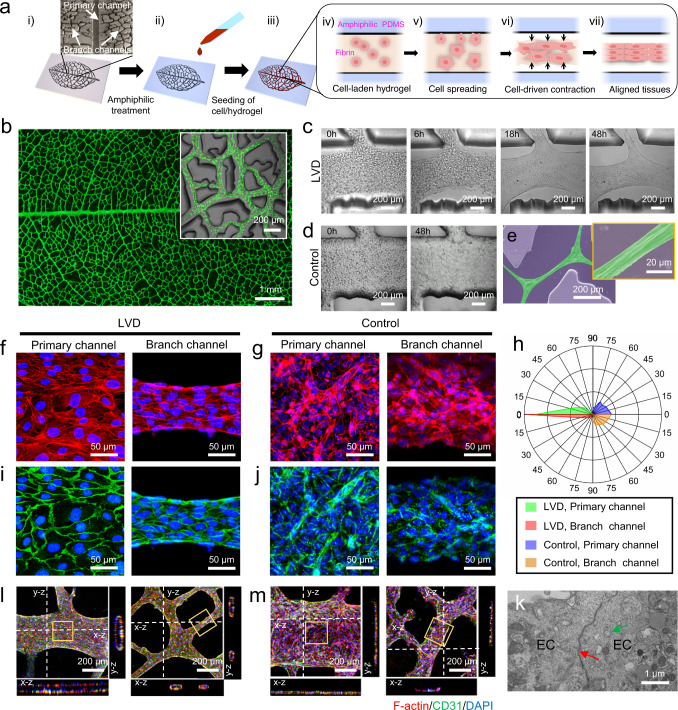
- LVD-HUVEC tissues formed interconnected tubular structures; the large-scale oval tissue was ~760 mm², ~45 mm long, 24 mm maximum width, with cellular bundles ~20–50 μm in diameter. Hydrogel width decreased ~2-fold in primary channels and ~5-fold in branch channels, cross-sectional area fraction decreased ~13-fold in primary and ~33-fold in branch channels, and local Young’s modulus increased ~45-fold from ~0.8 kPa to ~37.3 kPa after 48 h.
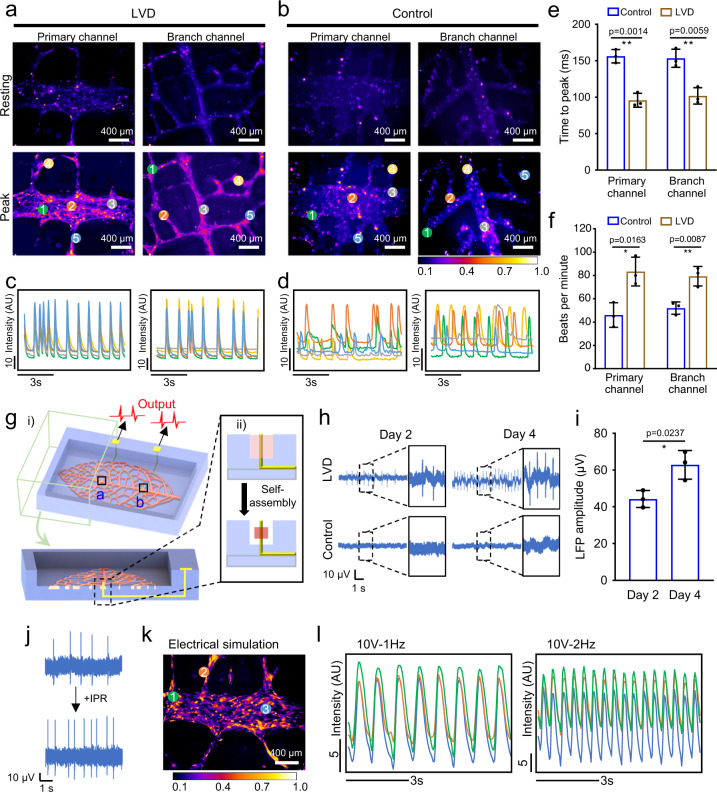
- LVD-rat-cardiac tissues after 5 days had local stiffness ~40 kPa, close to adult rat myocardium (~22–51 kPa), with aligned sarcomeres, higher CX43, longer sarcomere length, and upregulated KCNJ2, GJA1, PDK4, CPT1B, and PPARGCLA versus controls. They showed synchronous Ca²⁺ transients and field potentials of ~40 mV at 2 days increasing to ~60 mV at 4 days (~1 Hz to ~2–3 Hz), while no electrical signal was detected in controls.
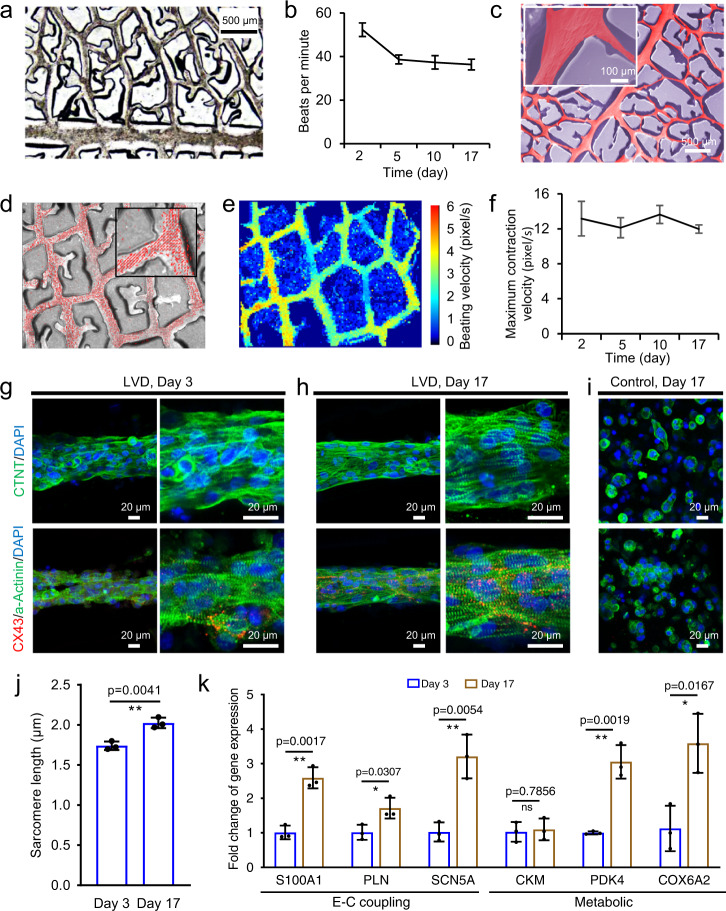
- hiPSC-CM LVD tissues over 17 days showed synchronous macroscopic contractions, stable contraction velocities, sarcomere length increasing from ~1.74 µm at day 3 to ~2.02 µm at day 17 (adult human CMs ~2.2 µm), higher CX43, and 5 of 6 maturation genes increased at day 17 versus day 2.
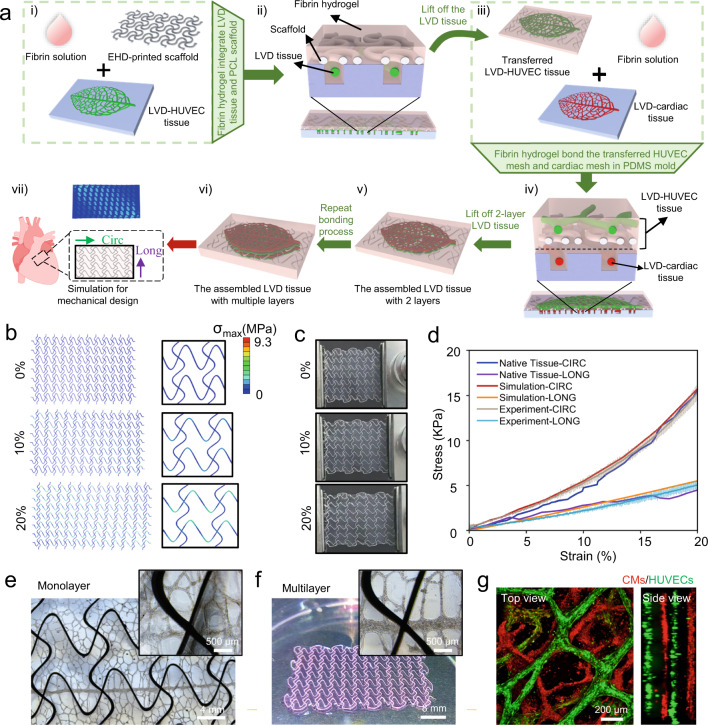
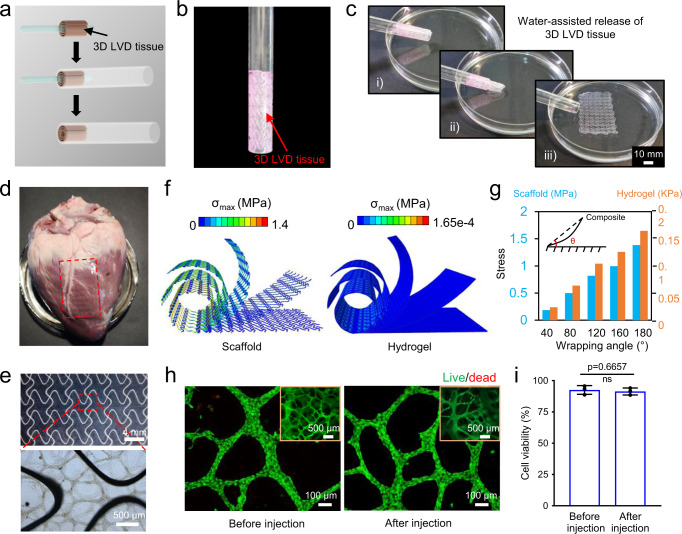
- EHD-printed PCL serpentine scaffolds enabled transfer and assembly into a 4-layer construct ~500 μm thick; constructs were rolled around a 2.5 mm rod, delivered through 6 mm tubing, recovered shape, attached to an ex vivo porcine heart, and showed no significant viability difference before versus after injection.
Methods
- Leaf-venation-inspired PDMS microchannels were fabricated by soft lithography; amphiphilic/pluronic F-127 treatment prevented adhesion, and cell-laden fibrin hydrogel (3 mg/ml fibrinogen, 2 × 10⁷ cells/ml) was seeded and allowed to self-assemble.
- Cells included HUVECs (passages 3–6), neonatal rat CMs from 2-day-old Sprague-Dawley rats (~30 rats), and hiPSC-CMs; controls used non-amphiphilic-treated PDMS.
- Characterization included confocal/SEM/TEM imaging, AFM nanoindentation, calcium transient and beat-rate analysis, microelectrode field-potential recording/stimulation, qRT-PCR, EHD printing of PCL scaffolds, finite-element analysis, tensile testing, live/dead viability assay, and ex vivo porcine heart injection.
Limitations
- Stated: microelectrodes were inserted only in the primary channel; inserting them into branch channels (<150 μm wide) is challenging, and the effect of 30-μm-diameter microelectrodes on branch-channel cellular bundles (<50 μm final diameter) needs further investigation.
- Stated: future large animal studies are needed to investigate LVD-HUVEC tissue growth, long-term survivability of LVD-cardiac tissues post-implant, and mechanical integration into host tissues; the optimum patch design remains unknown.
- Evident from the text: no in vivo implantation or long-term animal survival data are reported; delivery/implantation is demonstrated only ex vivo on a porcine heart, and human hiPSC-CM constructs were cultured for 17 days, not long-term.
Model-written summary. Check it against the paper before relying on it.
Integrity signals
Registry
Cites
Statistics
Figures


Verification
Claims the paper makes
4 Valid · 0 Not valid · 17 Not checked · 90 Own results and interpretations
The cited sources support only part of this claim — read each source’s verdict below.
In the paper
“Besides, leaf venation is remarkably similar to mammalian vasculature regarding the hierarchical structure and high-efficient fluid transportation function 27 .”
What the sources say
- Partly supportedcites [27] Gershlak, J. R. et al. Crossing kingdoms: using decellularized plants as perfusable tissue engineering scaffolds. Biomaterials 125, 13–22 (2017). sourceExperimental — accuracy not yet measured
Our copy supports the structural half of the claim: the Introduction states that 'plants and animals exploit fundamentally different approaches to transporting fluids... yet there are surprising similarities in their vascular network structures,' with plant vasculature following Murray's Law, 'the physiological law describing the tapered, branching network design of the human cardiovascular system,' and the Discussion adds that 'the structures are similar, especially the microvascular architecture' (also noting plant templates with 'different hierarchical geometries'). However, no passage characterizes leaf venation's fluid transport as 'highly efficient'; the paper only says plant vasculature 'supports flow of fluid and transport of important biomolecules' and explicitly stresses that this transport is accomplished through a different mechanism than in mammalian vessels. The efficiency qualifier attributed to this source is therefore unsupported, and the similarity is framed for plant/leaf vasculature in general rather than quantified as venation-to-vasculature equivalence. (LLM, conf=0.72)
boostedstates an association- Asserted: passes — The authors put it forward as true.
- Checkable: passes — It can be checked against evidence.
- Load-bearing: passes — The paper’s conclusions depend on it.
- Based: passes — The paper gives a reason why it holds.
- Partly supported
None of the sources cited for this claim have been checked yet.
In the paper
“In plants, the leaf veins, consisting of densely packed cells and aligned fibers, allow the transmission of action potentials, which progression was characterized by the rapid propagation of local intracellular Ca 2+ concentration 53,54 .”
§ Leaf-venation-directed cellular alignment for macroscale cardiac constructs with tissue-like functionalities > Circ Long
What the sources say
- Not checked yetcites [53] Hedrich, R., Salvador-Recatala, V. & Dreyer, I. Electrical wiring and long-distance plant communication. Trends Plant Sci. 21, 376–387 (2016). source
- Could not verifycites [54] Pfeiffer, E. R., Tangney, J. R., Omens, J. H. & McCulloch, A. D. Biomechanics of cardiac electromechanical coupling and mechanoelectric feedback. J. Biomech. Eng. 136, 021007 (2014). sourceExperimental — accuracy not yet measured
Our copy of Pfeiffer et al. (2014) is exclusively about cardiac electromechanical coupling and mechanoelectric feedback: the closest passages concern cardiac calcium-induced calcium release (Myocyte Excitation-Contraction Coupling), gap-junction/electrotonic conduction between cardiomyocytes (Myocyte Mechanoelectrical Coupling), and conduction in micropatterned cardiomyocyte preparations (p. 021007-6). Nothing in it addresses plants, leaf veins, or plant action potentials propagating via intracellular Ca2+. Searched: 'plant leaf veins action potential calcium propagation', 'densely packed cells and aligned fibers signal conduction', 'plants leaf vein action potential', 'Mimosa pudica plant electrophysiology non-animal tissue' — no passage on the claim's topic, and none credits an alternative plant-work, so this is neither supported, contradicted, nor relocatable on our copy alone. (LLM, conf=0.75)
plainstates a cause- Asserted: passes — The authors put it forward as true.
- Checkable: passes — It can be checked against evidence.
- Load-bearing: passes — The paper’s conclusions depend on it.
- Based: passes — The paper gives a reason why it holds.
A result the paper reports from its own data — it cites no other source for it, so there is none to check. The quote shows it is in the paper.
In the paper
“As a control, the cells cultured in non-amphiphilic-treated PDMS substrate spread in the matrix but could not detach from the microchannels, leading to their random distribution (Supplementary Fig. 1).”
§ Leaf-venation-directed cellular alignment for macroscale cardiac constructs with tissue-like functionalities > The strategy for engineering LVD tissues using HUVECs
plainstates a cause- Asserted: passes — The authors put it forward as true.
- Checkable: passes — It can be checked against evidence.
- Load-bearing: passes — The paper’s conclusions depend on it.
- Based: passes — The paper gives a reason why it holds.
A result the paper reports from its own data — it cites no other source for it, so there is none to check. The quote shows it is in the paper.
In the paper
“Compared to randomly-distributed cells, the engineered leaf-venation-directed-cardiac tissues from neonatal rat cardiomyocytes manifest advanced maturation and functionality as evidenced by detectable electrophysiological activity, macroscopically synchronous contractions, and upregulated maturation genes.”
plainstates a cause- Asserted: passes — The authors put it forward as true.
- Checkable: passes — It can be checked against evidence.
- Load-bearing: passes — The paper’s conclusions depend on it.
- Based: passes — The paper gives a reason why it holds.
A result the paper reports from its own data — it cites no other source for it, so there is none to check. The quote shows it is in the paper.
In the paper
“In contrast, no electrical signal could be detected in the control tissue.”
§ Leaf-venation-directed cellular alignment for macroscale cardiac constructs with tissue-like functionalities > Electrophysiological functions of LVD-neonatal-rat-cardiac tissues
plain- Asserted: passes — The authors put it forward as true.
- Checkable: passes — It can be checked against evidence.
- Load-bearing: passes — The paper’s conclusions depend on it.
- Based: passes — The paper gives a reason why it holds.
60 more claims
Create a free account to see all 111 claims and to verify the 22 references still open.
- It may state two separate claims as one. 36
- The quote only partly states this claim. 2
- Probably not a substantial claim. 11
Claims other papers make about this one
Each is checked against this paper’s own text: does it say what the citing paper says it does?
The check wasn’t confident either way, so it gives no verdict — never disputed.
In the citing paper
“By combining biological scaffolds, liver cells, and bioactive factors, tissue engineering can recreate the complex physical, chemical, and biological characteristics of the liver [30–33].”
From Constructing biomimetic microenvironments for liver regeneration (2025) · doi:10.1186/s12951-025-03729-9 · cites this paper as [32]
Experimental — accuracy not yet measured
Self-check
Percentages, sums and reported differences re-computed from the paper’s own numbers.
Each contradiction between two passages listed here was confirmed by an independent check.
Rated minor: it would not touch a result — a value no result rests on, a p-value that stays on the same side of the significance level, or a conflict that is clerical, resolved elsewhere in the paper, or outside its own findings.
In the paper
§ Leaf-venation-directed cellular alignment for macroscale cardiac constructs with tissue-like functionalities > Engineering functional LVD-human-cardiac tissue from hiPSC-CMs
“5 of the 6 genes progressively increased at day 17 in LVD tissues compared to day 2, suggesting enhanced LVD-hiPSC-derived-cardiac tissue maturation over time in culture (Fig. 5k).”
§ Leaf-venation-directed cellular alignment for macroscale cardiac constructs with tissue-like functionalities > Statistics and reproducibility
“k Relative gene expression in 3-day-old vs. 17-day-old LVD-human cardiac tissues.”
Rated minor: it would not touch a result — a value no result rests on, a p-value that stays on the same side of the significance level, or a conflict that is clerical, resolved elsewhere in the paper, or outside its own findings.
In the paper
§ Leaf-venation-directed cellular alignment for macroscale cardiac constructs with tissue-like functionalities > Engineering of 3D pre-vascularized cardiac tissues with programmed mechanical property
“Figure 6b, c, and Supplementary Fig. 10 provide the resultant FEA simulations and macroscopic images of the 3D tissue composite upon uniaxial stretching (from top to bottom: 0%, 10%, and 20%) along the LONG direction”
§ Leaf-venation-directed cellular alignment for macroscale cardiac constructs with tissue-like functionalities > Statistics and reproducibility
“FEA simulations (b) and macroscopic images (c) of the 3D tissue composite upon uniaxial stretching (from top to bottom: 0%, 10%, and 20%) along the CIRC direction.”
Rated minor: it would not touch a result — a value no result rests on, a p-value that stays on the same side of the significance level, or a conflict that is clerical, resolved elsewhere in the paper, or outside its own findings.
In the paper
§ Leaf-venation-directed cellular alignment for macroscale cardiac constructs with tissue-like functionalities > The dynamic formation process of LVD-HUVEC tissues
“These data reveal a self-organization process of LVD tissues through six consecutive stages (Fig. 2i):”
§ Leaf-venation-directed cellular alignment for macroscale cardiac constructs with tissue-like functionalities > The dynamic formation process of LVD-HUVEC tissues
“i Schematic illustration summarizing five stages of LVD tissue formation.”
Citations
Cites
Advanced maturation of human cardiac tissue grown from pluripotent stem cells
Ronaldson-Bouchard, K., Ma, S. P., Yeager, K., Chen, T., Song, L., Sirabella, D., Morikawa, K., Teles, D., Yazawa, M., & Vunjak-Novakovic, G. (2018) · Nature · doi:10.1038/s41586-018-0016-3 · Cited by 1,272 · cited 1×
“The sarcomere length of the 17-day-old CMs in LVD-cardiac tissues displayed a statistically signi fi cant increase compared with that of day 3, extended from ~1.74 µ m to ~2.02 µ m, whose value was quite close to that in adult human CMs (2.2 µ m) 42 (Fig.”
InfluentialBasic Mechanisms of Cardiac Impulse Propagation and Associated Arrhythmias
KLÉBER, A. G., & RUDY, Y. (2004) · Physiological Reviews · doi:10.1152/physrev.00025.2003 · Cited by 1,083 · cited 1×
“…packed cardiomyocytes (CMs) induce intercellular connections that coordinate electromechanical activity and contractile force of the myocardium 5,6 ; (ii) The hierarchical vascular networks transport the extensive oxygen and nutrients ef fi ciently to meet the extremely high-metabolic demands…”
3D Printing of Personalized Thick and Perfusable Cardiac Patches and Hearts
Noor, N., Shapira, A., Edri, R., Gal, I., Wertheim, L., & Dvir, T. (2019) · Advanced Science · doi:10.1002/advs.201900344 · Cited by 1,042 · cited 1×
“Recent advances in the bioprinting of cell/hydrogel bioinks have provided opportunities to fabricate cellular constructs with CMs and embedded vascular structures as predesigned architectures 24 – 26 .”
Glutamate triggers long-distance, calcium-based plant defense signaling
Toyota, M., Spencer, D., Sawai-Toyota, S., Jiaqi, W., Zhang, T., Koo, A. J., Howe, G. A., & Gilroy, S. (2018) · Science · doi:10.1126/science.aat7744 · Cited by 982
Accordion-like honeycombs for tissue engineering of cardiac anisotropy
Engelmayr, G. C., Cheng, M., Bettinger, C. J., Borenstein, J. T., Langer, R., & Freed, L. E. (2008) · Nature Materials · doi:10.1038/nmat2316 · Cited by 848 · cited 2×
“…ef fi ciently to meet the extremely high-metabolic demands of the myocardium 7,8 ; (iii) Biomimetic anisotropic mechanical properties of the myocardium with different effective stiffnesses in the circumferential and longitudinal directions to support the heart ’ s diastole and systole 9,10 .”
Nanoscale cues regulate the structure and function of macroscopic cardiac tissue constructs
Kim, D.-H., Lipke, E. A., Kim, P., Cheong, R., Thompson, S., Delannoy, M., Suh, K.-Y., Tung, L., & Levchenko, A. (2010) · Proceedings of the National Academy of Sciences · doi:10.1073/pnas.0906504107 · Cited by 611
Direct 3D bioprinting of prevascularized tissue constructs with complex microarchitecture
Zhu, W., Qu, X., Zhu, J., Ma, X., Patel, S., Liu, J., Wang, P., Lai, C. S. E., Gou, M., Xu, Y., et al. (2017) · Biomaterials · doi:10.1016/j.biomaterials.2017.01.042 · Cited by 567
Self-citationTissue engineering of vascularized cardiac muscle from human embryonic stem cells
Caspi, O., Lesman, A., Basevitch, Y., Gepstein, A., Arbel, G., Habib, I. H. M., Gepstein, L., & Levenberg, S. (2007) · Circulation Research · doi:10.1161/01.res.0000257776.05673.ff · Cited by 558
Baker, B. M., Trappmann, B., Wang, W. Y., Sakar, M. S., Kim, I. L., Shenoy, V. B., Burdick, J. A., & Chen, C. S. (2015) · Nature Materials · doi:10.1038/nmat4444 · Cited by 556
Electrical stimulation systems for cardiac tissue engineering
Tandon, N., Cannizzaro, C., Chao, P.-H. G., Maidhof, R., Marsano, A., Au, H. T. H., Radisic, M., & Vunjak-Novakovic, G. (2009) · Nature Protocols · doi:10.1038/nprot.2008.183 · Cited by 528 · cited 1×
“Besides the environmental cues, there are other methods to improve the maturation of hiPSC-CMs, such as electrical/mechanical stimulation and long-term culture with evolving media supplementation 55,56 .”
Research works printed but not linked: 1
- Xi, Y. et al. Substrate stiffness alters human induced pluripotent stem cell-derived cardiomyocyte differentiation and maturation. Circulation 140, A17119 (2019).
Cited by
Min, S., Kim, S., Sim, W., Choi, Y. S., Joo, H., Park, J.-H., Lee, S.-J., Kim, H., Lee, M. J., Jeong, I., et al. (2024) · Nature Communications · doi:10.1038/s41467-024-46928-y · Cited by 121
“Other engineering methods, such as cardiac alignment and electrical/ mechanical stimulation, have been widely employed in advancing cardiac tissue maturation 6,9,130 .”
Jia, X., Liu, W., Ai, Y., Cheung, S., Hu, W., Wang, Y., Shi, X., Zhou, J., Zhang, Z., & Liang, Q. (2024) · Advanced Materials · doi:10.1002/adma.202404071 · Cited by 58
Open Challenges and Opportunities in Piezoelectricity for Tissue Regeneration
Deng, X., Zhuang, Y., Cui, J., Wang, L., Zhan, H., Wang, X., Lin, K., & Yuan, C. (2025) · Advanced Science · doi:10.1002/advs.202510349 · Cited by 56
Engineering Highly Vascularized Bone Tissues by 3D Bioprinting of Granular Prevascularized Spheroids
Fang, Y., Ji, M., Wu, B., Xu, X., Wang, G., Zhang, Y., Xia, Y., Li, Z., Zhang, T., Sun, W., et al. (2023) · ACS Applied Materials & Interfaces · doi:10.1021/acsami.3c08550 · Cited by 42
Self-citation3D printing for tissue/organ regeneration in China
He, C., He, J., Wu, C., Ruan, C., Gu, Q., Hao, Y., Wu, Y. B., Bai, S., Han, X., Ouyang, L., et al. (2025) · Bio-Design and Manufacturing · doi:10.1631/bdm.2400309 · Cited by 48
Self-citation
Metadata
- Authors
- Mao, M., Qu, X., Zhang, Y., Gu, B., Li, C., Liu, R., Li, X., Zhu, H., He, J., & Li, D.
- Affiliations
- Xi'an Jiaotong University (CN)
- Corresponding author
- He, Jiankang
- Venue
- Nature Communications
- Published
- 2023-04-12
- Volume
- 14
- Issue
- 1
- Pages
- 2077-2077
- ISSN
- 2041-1723 (ISSN-L)
- PMC
- PMC10097867
- OpenAlex
- W4365150670
- Semantic Scholar
- b0e4e09c0d3afc08f1ced5d031e69eb70d8a241f
- Cited by
- 42
- References
- 74
- Citations by year
- 2026: 9 · 2025: 21 · 2024: 11 · 2023: 1
- FWCI
- 11.25
- Type
- journal article
- Language
- en
- Open access
- gold
- doi.org
- Licence
- cc-by
- creativecommons.org/licenses/by/4.0 (tdm)
- creativecommons.org/licenses/by/4.0 (vor)
- Locations
- Nature Communications (publishedVersion, cc-by)
- Research Square (acceptedVersion, cc-by)
- PubMed Central (publishedVersion, cc-by)
- PubMed (publishedVersion)
- RePEc: Research Papers in Economics (submittedVersion)
- DOAJ (DOAJ: Directory of Open Access Journals) (submittedVersion, cc-by-sa)
- Funders
- National Natural Science Foundation of China (52205317, 52125501)
- China Postdoctoral Science Foundation
- National Key Research and Development Program of China (2021GXLH-Z-028, 2020GXLH-Y-021, 2018YFA0703003)
- Fundamental Research Funds for the Central Universities (2020GXLH-Y-021, 2021GXLH-Z-028)
- Topics
- Health Sciences › Medicine › Surgery › Tissue Engineering and Regenerative Medicine
- Physical Sciences › Engineering › Biomedical Engineering › 3D Printing in Biomedical Research
- Life Sciences › Biochemistry, Genetics and Molecular Biology › Cell Biology › Cellular Mechanics and Interactions
- Keywords
- cardiac tissue engineering, neonatal rat cardiomyocytes, iPSC-derived cardiomyocytes, electrophysiological maturation
- MeSH terms
- Animals, Humans, Myocardium, Hydrogels, Tissue Engineering, Myocytes, Cardiac, Rats, Tissue Scaffolds, Induced Pluripotent Stem Cells
About these checks
Registry, retraction, Cites and statistics results are computed, not judged, with one exception: a printed reference that no index lists is read once by a model before it counts as a citation error. Claims are extracted by a model and kept only when their quote appears verbatim in the text; each cited source is then checked, with a model’s help, for whether it says what the claim relies on. Those verdicts can be wrong — read the claim’s quote and the cited source before relying on one.
The claim verdicts this report counts are experimental: their accuracy is not yet measured.
A language model drew the claims from the paper on 2026-10-05, under version 3 of the claim definition (model deepseek-v4.1-flash, prompt extract-v3).
A second model labelled each claim on 2026-10-05 (model jev-1.13-20260917, definition revision gold-guideline-v0.2).
Cited sources are checked with a language model’s help (qwen3.8-omni-flash).
Statistics and arithmetic are recomputed, not judged.
Confidence bands are shown only for fields calibrated on our annotated test set. None is calibrated yet, so no band is shown.
What counts as a claim ›How we measure confidence ›How we check this ›
Are you an author, or do you see a problem with this page? Request a review
How to cite
Cite CoChat for the checks on this page, and the paper for its own findings.
- This page
- CoChat. (2026). Citation check: Leaf-venation-directed cellular alignment for macroscale cardiac constructs with tissue-like functionalities. https://app.cochat.ai/papers/10.1038/s41467-023-37716-1
- The paper
- Mao, M., Qu, X., Zhang, Y., Gu, B., Li, C., Liu, R., Li, X., Zhu, H., He, J., & Li, D. (2023). Leaf-venation-directed cellular alignment for macroscale cardiac constructs with tissue-like functionalities. Nature Communications. https://doi.org/10.1038/s41467-023-37716-1
Data sources
Bibliographic data: Semantic Scholar, OpenAlex, Crossref.
Contains information from the Semantic Scholar Academic Graph Datasets, made available under the ODC Attribution License (ODC-BY 1.0).
Semantic Scholar’s data is described in: Kinney, R., et al. (2023). The Semantic Scholar Open Data Platform. arXiv:2301.10140.
