

The DOI matches its Crossref record; 62 of the 62 references it cites were found in a registry or an index.
Accelerating the prediction and discovery of peptide hydrogels with human-in-the-loop
Open accessAbstract
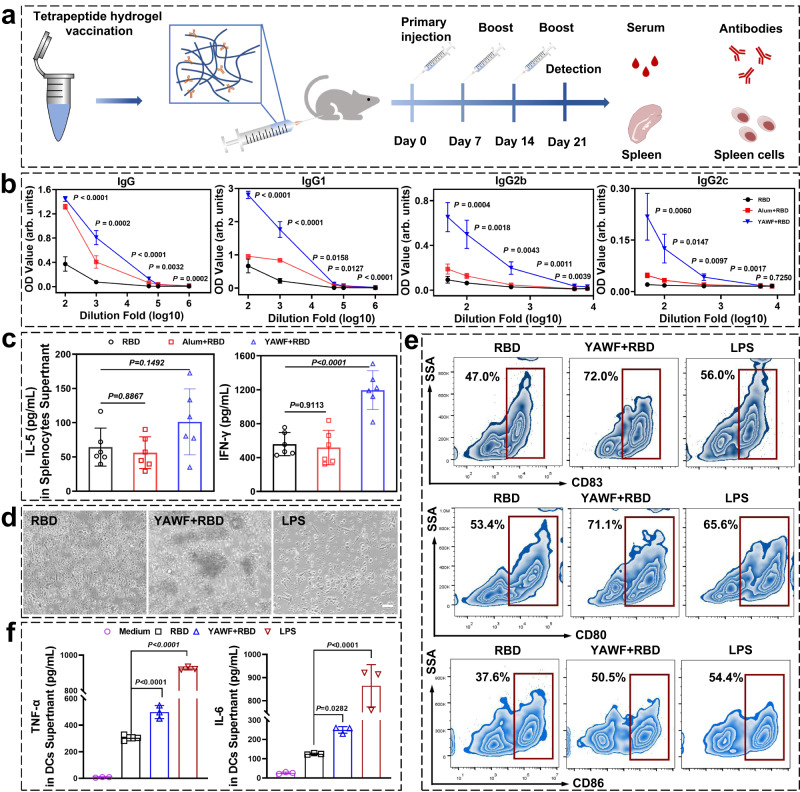
The amino acid sequences of peptides determine their self-assembling properties. Accurate prediction of peptidic hydrogel formation, however, remains a challenging task. This work describes an interactive approach involving the mutual information exchange between experiment and machine learning for robust prediction and design of (tetra)peptide hydrogels. We chemically synthesize more than 160 natural tetrapeptides and evaluate their hydrogel-forming ability, and then employ machine learning-experiment iterative loops to improve the accuracy of the gelation prediction. We construct a score function coupling the aggregation propensity, hydrophobicity, and gelation corrector C g , and generate an 8,000-sequence library, within which the success rate of predicting hydrogel formation reaches 87.1%. Notably, the de novo-designed peptide hydrogel selected from this work boosts the immune response of the receptor binding domain of SARS-CoV-2 in the mice model. Our approach taps into the potential of machine learning for predicting peptide hydrogelator and significantly expands the scope of natural peptide hydrogels.
Overview
The claims and statistics of this paper haven’t been checked yet.
Run the check — free, no account needed. It reads the open-access text and checks the sources it cites.
Integrity signals
Registry
Cites
Statistics
Figures
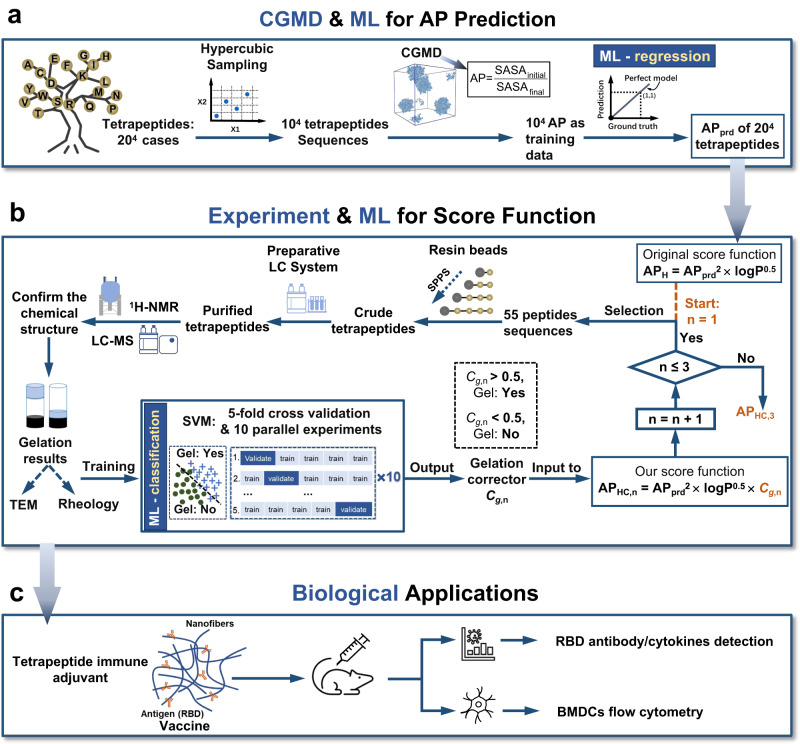
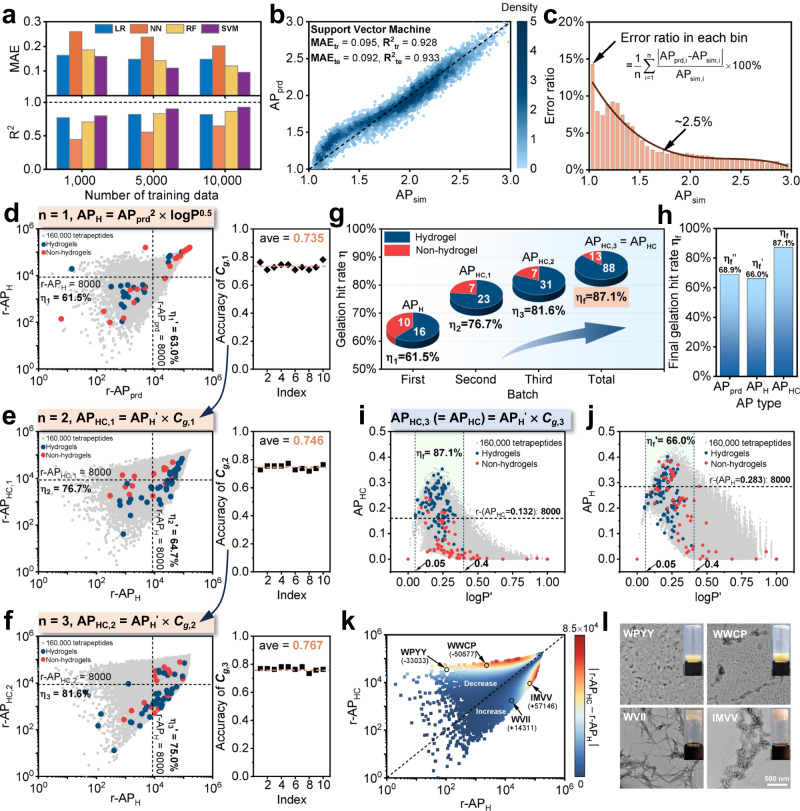
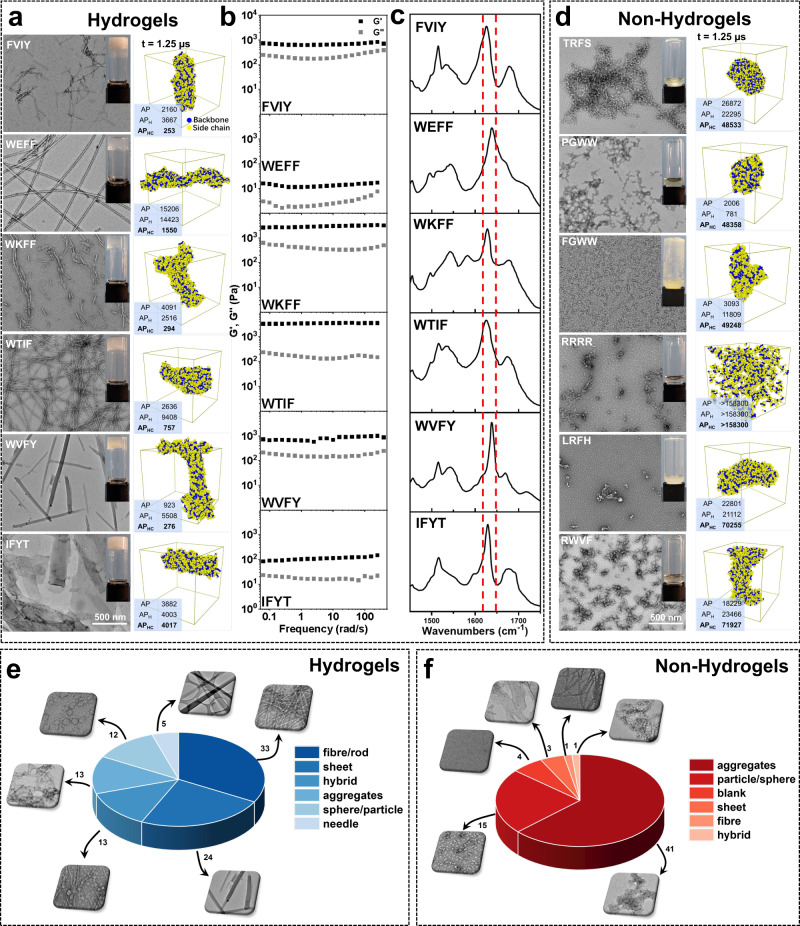
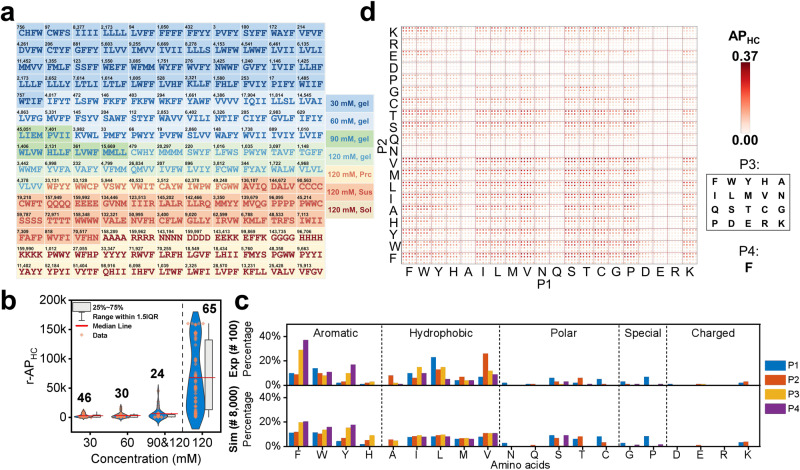
Verification
Claims the paper makes
The claims and statistics of this paper haven’t been checked yet.
Run the check — free, no account needed. It reads the open-access text and checks the sources it cites.
Claims other papers make about this one
Each is checked against this paper’s own text: does it say what the citing paper says it does?
The source backs part of the claim, not all of it — or backs it for a different population, condition or comparison.
In the citing paper
“However, their application to soft materials remains challenging because of complex, multiscale structure–property relationships4–6.”
From Data-driven de novo design of super-adhesive hydrogels (2025) · cites this paper as [5]
Experimental — accuracy not yet measured
Self-check
Percentages, sums and reported differences re-computed from the paper’s own numbers.
The self-check needs the paper’s full text.
Citations
Cites
Scikit-learn: Machine Learning in Python
Pedregosa, F., Varoquaux, G., Gramfort, A., Michel, V., Thirion, B., Grisel, O., Blondel, M., Müller, A., Nothman, J., Louppe, G., et al. (2012) · arXiv · doi:10.48550/arxiv.1201.0490 · Cited by 71,016
Abraham, M. J., Murtola, T., Schulz, R., Páll, S., Smith, J. C., Hess, B., & Lindahl, E. (2015) · SoftwareX · doi:10.1016/j.softx.2015.06.001 · Cited by 27,190
GROMACS: A message-passing parallel molecular dynamics implementation
Berendsen, H. J. C., van der Spoel, D., & van Drunen, R. (1995) · Computer Physics Communications · doi:10.1016/0010-4655(95)00042-e · Cited by 10,488
A note on a general definition of the coefficient of determination
NAGELKERKE, N. J. D. (1991) · Biometrika · doi:10.1093/biomet/78.3.691 · Cited by 5,927
An Introduction to Kernel and Nearest-Neighbor Nonparametric Regression
Altman, N. (1992) · The American Statistician · doi:10.1080/00031305.1992.10475879 · Cited by 5,657
The MARTINI Force Field: Coarse Grained Model for Biomolecular Simulations
Marrink, . J., Risselada, H. J., Yefimov, S., Tieleman, D. P., & de Vries, A. H. (2007) · The Journal of Physical Chemistry B · doi:10.1021/jp071097f · Cited by 5,641
CHARMM36 all-atom additive protein force field: Validation based on comparison to NMR data
Huang, J., & MacKerell, A. D. (2013) · Journal of Computational Chemistry · doi:10.1002/jcc.23354 · Cited by 4,537
What is a support vector machine?
Noble, W. S. (2006) · Nature Biotechnology · doi:10.1038/nbt1206-1565 · Cited by 4,450
Random Forest: A Classification and Regression Tool for Compound Classification and QSAR Modeling
Svetnik, V., Liaw, A. I., Tong, C., Culberson, J. C., Sheridan, R. P., & Feuston, B. P. (2003) · Journal of Chemical Information and Computer Sciences · doi:10.1021/ci034160g · Cited by 3,613
Latin hypercube sampling and the propagation of uncertainty in analyses of complex systems
Helton, J. C., & Davis, F. J. (2003) · Reliability Engineering & System Safety · doi:10.1016/s0951-8320(03)00058-9 · Cited by 2,719
Research works printed but not linked: 2
- Mueller, T., Kusne, A. G. & Ramprasad, R. Machine learning in materials science: Recent progress and emerging applications. Rev. Comput. Chem. 29, 186–273 (2016).
- Seber, G. A. & Lee, A. J. Linear regression analysis. (John Wiley & Sons, 2012).
Cited by
Sorted by citations
Data-driven de novo design of super-adhesive hydrogels
Liao, H., Hu, S., Yang, H., Wang, L., Tanaka, S., Takigawa, I., Li, W., Fan, H., & Gong, J. P. (2025) · Nature · doi:10.1038/s41586-025-09269-4 · Cited by 169
“Emerging tools, such as data mining (DM) and machine learning (ML), are transforming the field by advancing the analysis of complex behaviours, improving property predictions and driving theory and modelling development 5,10–13 .”
InfluentialSelf-citationExploring the Potential of Artificial Intelligence for Hydrogel Development—A Short Review
Neguț, I., & Bita, B. I. (2023) · Gels · doi:10.3390/gels9110845 · Cited by 130
De novo design of self-assembling peptides with antimicrobial activity guided by deep learning
Liu, H., Song, Z., Zhang, Y. L., Wu, B., Chen, D., Zhou, Z., Zhang, H., Li, S., Feng, X., Huang, J., et al. (2025) · Nature Materials · doi:10.1038/s41563-025-02164-3 · Cited by 133
Self-citationAI-driven 3D bioprinting for regenerative medicine: From bench to bedside
Zhang, Z., Zhou, X., Fang, Y., Xiong, Z., & Zhang, T. (2024) · Bioactive Materials · doi:10.1016/j.bioactmat.2024.11.021 · Cited by 126
Self-citationSmart hydrogel: A new platform for cancer therapy
Li, G., Fu, Z.-M., Li, H., Wei, R., Guo, J., Wang, H., & Qi, J. (2025) · Advances in Colloid and Interface Science · doi:10.1016/j.cis.2025.103470 · Cited by 100
Self-citationAdvancing Synthetic Hydrogels through Nature‐Inspired Materials Chemistry
Soliman, B. G., Nguyen, A. K., Gooding, J. J., & Kilian, K. A. (2024) · Advanced Materials · doi:10.1002/adma.202404235 · Cited by 100
Engineered Bio‐Based Hydrogels for Cancer Immunotherapy
Peng, Y., Liang, S., Meng, Q., Liu, D., Ma, K., Zhou, M., Yun, K., Rao, L., & Wang, Z. (2024) · Advanced Materials · doi:10.1002/adma.202313188 · Cited by 91
Wang, Y., Rencus‐Lazar, S., Zhou, H., Yin, Y., Jiang, X., Cai, K., Gazit, E., & Ji, W. (2023) · ACS Nano · doi:10.1021/acsnano.3c08183 · Cited by 77
Context dependence in assembly code for supramolecular peptide materials and systems
Kaygisiz, K., Sementa, D., Athiyarath, V., Chen, X., & Ulijn, R. V. (2025) · Nature Reviews Materials · doi:10.1038/s41578-025-00782-6 · Cited by 86
Functional Hydrogels for Aqueous Zinc‐Based Batteries: Progress and Perspectives
Mao, L., Li, G., Zhang, B., Wen, K., Wang, C., Cai, Q., Zhao, X., Guo, Z., & Zhang, S. (2024) · Advanced Materials · doi:10.1002/adma.202416345 · Cited by 68
Njirjak, M., Žužić, L., Babić, M., Janković, P., Otović, E., Kalafatović, D., & Mauša, G. (2024) · Nature Machine Intelligence · doi:10.1038/s42256-024-00928-1 · Cited by 64
Surface engineering of nanoparticles for precision medicine
Zheng, J., Sun, Y., Shen, Y., & Zhou, Z. (2025) · Precision medicine and engineering. · doi:10.1016/j.preme.2025.100037 · Cited by 55
Self-citationIntelligent Biomaterialomics: Molecular Design, Manufacturing, and Biomedical Applications
Yi, Y., An, H., & Wang, H. (2023) · Advanced Materials · doi:10.1002/adma.202305099 · Cited by 52
Self-citationLu, K., ABOUZEID, R. E., Wu, Q., Chen, Q., & Liu, S. (2024) · Giant · doi:10.1016/j.giant.2024.100270 · Cited by 48
Stimuli-responsive hydrogels based on protein/peptide and their sensing applications
Zhao, F., Liu, M., Guo, H., Wang, Y., Zhang, Y., He, M., & Cai, Z. (2024) · Progress in Materials Science · doi:10.1016/j.pmatsci.2024.101355 · Cited by 49
Machine Learning in Gel-Based Additive Manufacturing: From Material Design to Process Optimization
Zhang, Z., Wang, Y., & Wang, W. (2025) · Gels · doi:10.3390/gels11080582 · Cited by 54
Ren, X., Wei, J., Luo, X., Liu, Y., Li, K., Zhang, Q., Gao, X., Yan, S., Wu, X., Jiang, X., et al. (2024) · Advanced Science · doi:10.1002/advs.202400829 · Cited by 48
Computational and AI‐Driven Design of Hydrogels for Bioelectronic Applications
Finster, R., Sankaran, P., & Bihar, E. (2025) · Advanced Electronic Materials · doi:10.1002/aelm.202400763 · Cited by 50
Deep Learning Empowers the Discovery of Self‐Assembling Peptides with Over 10 Trillion Sequences
Wang, J., Liu, Z., Zhao, S. Z., Xu, T., Wang, H., Li, S. Z., & Li, W. (2023) · Advanced Science · doi:10.1002/advs.202301544 · Cited by 47
Self-citationEngineering Peptide Self-Assembly: Modulating Noncovalent Interactions for Biomedical Applications
Li, Y., Lu, H., Lu, L., & Wang, H. (2025) · Accounts of Materials Research · doi:10.1021/accountsmr.4c00391 · Cited by 44
Self-citationZhao, J., Liu, Q., Tong, X., Wang, Y., Cai, K., & Ji, W. (2024) · Advanced Functional Materials · doi:10.1002/adfm.202401466 · Cited by 44
Self-assembling peptide hydrogels: design, mechanisms, characterization, and biomedical applications
Zhang, Z., Gao, J., Yuan, L., Duan, B., Yang, H., Ma, L., & Lu, K. (2025) · Soft Matter · doi:10.1039/d5sm00396b · Cited by 43
Advanced construction strategies to obtain nanocomposite hydrogels for bone repair and regeneration
Ding, W., Ge, Y., Zhang, T., Zhang, C., & Yin, X. (2024) · NPG Asia Materials · doi:10.1038/s41427-024-00533-z · Cited by 45
Recent progress in low hysteresis gels: Strategies, applications, and challenges
Liu, F.-X., Jing, X., Yang, J., Mi, H., Feng, F.-Y., & Liu, Y. (2024) · Nano Today · doi:10.1016/j.nantod.2024.102601 · Cited by 37
Artificial intelligence-enabled hydrogels: innovations and applications
Zhang, S., Wang, H., Liu, F., Su, Y., Han, K., Liu, Y., Guan, F., Liu, H., & Ma, S. (2025) · Journal of Materials Chemistry B · doi:10.1039/d5tb01944c · Cited by 36
Self-citationFacile Reactive Oxygen Species-Scavenging Supramolecular Hydrogel to Promote Diabetic Wound Healing
Jia, D., Li, S., Jiang, M., Lv, Z., Wang, H., & Zheng, Z. (2024) · ACS Applied Materials & Interfaces · doi:10.1021/acsami.3c17667 · Cited by 33
Self-citationPeptide‐Based Supramolecular Therapeutics for Fighting Major Diseases
Wang, Z., Luo, H., Wang, H., Meng, X., Jia, H., Ren, C., & Liu, J. (2024) · Advanced Functional Materials · doi:10.1002/adfm.202314492 · Cited by 33
Self-citationComputational Design of Peptide Assemblies
Min, J., Rong, X., Zhang, J., Su, R., Wang, Y., & Qi, W. D. (2024) · Journal of Chemical Theory and Computation · doi:10.1021/acs.jctc.3c01054 · Cited by 31
From cells to subcellular organelles: Next-generation cancer therapy based on peptide self-assembly
Liu, H., & Wang, H. (2024) · Advanced Drug Delivery Reviews · doi:10.1016/j.addr.2024.115327 · Cited by 29
Self-citationLearning the rules of peptide self-assembly through data mining with large language models
Yang, Z., Yorke, S. K., Knowles, T. P. J., & Buehler, M. J. (2025) · Science Advances · doi:10.1126/sciadv.adv1971 · Cited by 34
He, W., Lin, R., Kong, S., Qiang, M., Huang, L., Dai, B., Yao, X., Su, L., & Zhang, X. (2025) · Advanced Science · doi:10.1002/advs.202517851 · Cited by 28
Enhancing calvarial defects repair with PDGF-BB mimetic peptide hydrogels
Wu, X., Yan, M., Shen, J., Xiang, Y., Jian, K., Pan, X., Yuan, D., & Shi, J. (2024) · Journal of Controlled Release · doi:10.1016/j.jconrel.2024.04.045 · Cited by 28
Li, F., Gan, L., Yang, X., Tan, Z., Shi, H. S., Lai, C., & Zhang, D. (2024) · International Journal of Biological Macromolecules · doi:10.1016/j.ijbiomac.2024.138643 · Cited by 29
Multiphasic condensates formed with mono-component of tetrapeptides via phase separation
Zhou, L., Zhu, L., Wang, C., Xu, T., Wang, J., Zhang, B., Zhang, X., & Wang, H. (2025) · Nature Communications · doi:10.1038/s41467-025-58060-6 · Cited by 31
Self-citationUsing Machine Learning to Fast-Track Peptide Nanomaterial Discovery
Dražić, E., Jelušić, D., Janković, P., Mauša, G., & Kalafatović, D. (2025) · ACS Nano · doi:10.1021/acsnano.5c00670 · Cited by 31
Aggregation Rules of Short Peptides
Wang, J., Liu, Z., Zhao, S., Zhang, Y. L., Xu, T., Li, S. Z., & Li, W. (2024) · JACS Au · doi:10.1021/jacsau.4c00501 · Cited by 24
Self-citationCao, J., Fan, G., Wang, C., & Lu, B. (2024) · Food Hydrocolloids · doi:10.1016/j.foodhyd.2024.110960 · Cited by 25
AI-guided biomaterials and biofabrication strategies for enhanced tumor extracellular matrix mimicry
Yan, J., Hu, M., Zhao, P., Zhang, C., Lin, J., Shen, Y., Chen, H., Zhang, W., Tang, M., & Luan, X. (2025) · Cell Biomaterials · doi:10.1016/j.celbio.2025.100188 · Cited by 25
Polymer gels for aqueous metal batteries
Zhang, T., Wang, K., Wang, H., Wei, M., Chen, Z., Zhong, D., Chen, Y., & Pei, P. (2025) · Progress in Materials Science · doi:10.1016/j.pmatsci.2025.101426 · Cited by 25
Self-citationSelf-assembly and hydrogelation of a potential bioactive peptide derived from quinoa proteins
Cheng, L., Rodriguez, L. M. D. L., Gilbert, E. P., Loo, T. S., Petters, L., & Yang, Z. (2024) · International Journal of Biological Macromolecules · doi:10.1016/j.ijbiomac.2024.129296 · Cited by 22
Integrated computational approaches for advancing antimicrobial peptide development
Fang, Y., Ma, Y., Yu, K., Dong, J. N., & Zeng, W. (2024) · Trends in Pharmacological Sciences · doi:10.1016/j.tips.2024.09.011 · Cited by 22
Self-citationTalluri, Y. N., Sankaranarayanan, S. K. R. S., Fry, H. C., & Batra, R. (2025) · Science Advances · doi:10.1126/sciadv.adt9466 · Cited by 23
Li, L., Zheng, R., & Sun, R. (2025) · Macromolecular Bioscience · doi:10.1002/mabi.202400523 · Cited by 16
A Review on the Rheological Properties of Single Amino Acids and Short Dipeptide Gels
Veloso, S. R. S., Rosa, M., Diaferia, C., & Fernandes, C. B. P. (2024) · Gels · doi:10.3390/gels10080507 · Cited by 16
Recent Advances in Machine Learning‐Assisted Design and Development of Polymer Materials
Ma, L., Li, W., Yuan, J., Zhu, J., Wu, Y., He, H., & Pan, X. (2025) · Macromolecular Rapid Communications · doi:10.1002/marc.202500361 · Cited by 17
Self-citationArtificial intelligence for nanomedicine
Song, X., Gao, X., Wang, H., Yu, F., Qin, M., Li, Y., Liu, Y., Feng, W., Zhou, C., Chukavin, N. N., et al. (2025) · Science China Chemistry · doi:10.1007/s11426-025-2942-5 · Cited by 16
Self-citationLayered nanomaterials for renewable energy generation and storage
Nikitina, A. A., Lavrentev, F. V., Yurova, V. Y., Piarnits, D. Y., Volkova, O., Скорб, Е. В., & Shchukin, D. G. (2023) · Materials Advances · doi:10.1039/d3ma00924f · Cited by 17
Hausleitner, C., Mueller, H., Holzinger, A., & Pfeifer, B. (2024) · Scientific Reports · doi:10.1038/s41598-024-72748-7 · Cited by 15
Xing, H., Dong, H., Guo, C., Wang, Z., & He, R. (2025) · Trends in Food Science & Technology · doi:10.1016/j.tifs.2025.105483 · Cited by 14
Mao, X., Ding, X., Wang, Q., Sun, X., Qin, L., Huang, F., Wen, L., & Xiang, X. (2023) · Small · doi:10.1002/smll.202308739 · Cited by 13
Tips and Tricks in the Modeling of Supramolecular Peptide Assemblies
Piskorz, T. K., Perez‐Chirinos, L., Qiao, B., & Sasselli, I. R. (2024) · ACS Omega · doi:10.1021/acsomega.4c02628 · Cited by 20
Zheng, G., Zhang, S., Meng, L., Zhang, S., & Wang, X. (2024) · Advanced Functional Materials · doi:10.1002/adfm.202410075 · Cited by 14
Revolutionizing supramolecular materials design with artificial intelligence
Zhu, H., Wang, Z., Li, L., Dong, L., Li, Y., Xue, B., & Cao, Y. (2024) · Supramolecular Materials · doi:10.1016/j.supmat.2024.100090 · Cited by 13
Guan, X., Zheng, S., Zhang, B., Sun, X., Meng, K., Elafify, M. S., Zhu, Y., El‐Gowily, A. H., An, M., Li, D., et al. (2024) · ACS Applied Materials & Interfaces · doi:10.1021/acsami.3c18077 · Cited by 13
Cao, J., Fan, G., & Lu, B. (2024) · Journal of Food Engineering · doi:10.1016/j.jfoodeng.2024.112351 · Cited by 12
Zhang, M., Deng, Y., Zhou, Q., Gao, J., Zhang, D., & Pan, X. (2024) · Environmental Science Processes & Impacts · doi:10.1039/d4em00662c · Cited by 12
Cai, D., Li, C., Zhu, T., Li, R., Zhang, M., Li, X., Liu, Y., Dai, Z., Wan, L., & Lu, H. (2025) · Journal of Materials Chemistry B · doi:10.1039/d5tb01846c · Cited by 11
Functional Design of Peptide Materials Based on Supramolecular Cohesion
Egner, S. A., Agrawal, M., Sai, H., Dore, M. D., Palmer, L. C., & Stupp, S. I. (2025) · Journal of the American Chemical Society · doi:10.1021/jacs.4c17867 · Cited by 10
Castillo, T., Flores, C., Salgado‐Lugo, H., Peña, C., & Galindo, E. (2023) · Electronic Journal of Biotechnology · doi:10.1016/j.ejbt.2023.09.001 · Cited by 9
Puerarin hydrogel: Design and applications in biomedical engineering
Geng, S., Zhang, H., Zhang, Y., Liu, L.-Z., Yu, S., Lan, X., Gao, Y., Ling, Z., Zhang, Y. L., Li, X., et al. (2024) · Journal of Drug Delivery Science and Technology · doi:10.1016/j.jddst.2024.105802 · Cited by 10
Self-citationRahaman, K. A., Mukim, M. S. I., Hasan, M. L., Kim, H., Pan, C., Kwon, O., Song, D., & Han, H. (2025) · Bioactive Materials · doi:10.1016/j.bioactmat.2025.02.008 · Cited by 9
Molecular design drives nanoarchitecture in self-assembling antimicrobial peptides
Rios, T. B., Maximiano, M. R., Oliveira-Júnior, N. G., Nascimento, A. S., & Franco, O. L. (2025) · Trends in Biochemical Sciences · doi:10.1016/j.tibs.2025.08.003 · Cited by 9
Benchmark of Coacervate Formation and Mechanism Exploration Using the Martini Force Field
Zou, R., Wang, Y., Zhang, X., Zhou, Y., Liu, Y., & Ding, M.-M. (2025) · Journal of Chemical Theory and Computation · doi:10.1021/acs.jctc.4c01571 · Cited by 7
Emerging self-assembled peptide hydrogels for enhanced wound healing
Yang, Z., Wang, Y., & Zhu, H. (2025) · Nanomedicine · doi:10.1080/17435889.2025.2544535 · Cited by 8
Machine learning-driven mass transfer modeling and inverse design for nanofiltration membranes
Meng, C., Zhu, H., & Ghoufi, A. (2025) · Desalination · doi:10.1016/j.desal.2025.119338 · Cited by 8
Applications of peptide-based nanomaterials in targeting cancer therapy
Sun, B., Zhang, L., Li, M., Wang, X., & Wang, W. (2024) · Biomaterials Science · doi:10.1039/d3bm02026f · Cited by 8
Reprogramming Macrophages toward Pro-inflammatory Polarization by Peptide Hydrogel
Kong, N., Chen, D., Liang, J., Wu, B., & Wang, H. (2024) · Biomacromolecules · doi:10.1021/acs.biomac.4c00585 · Cited by 8
Self-citationSelf‐Assembling Peptide‐Based Materials for Therapy of Inflammatory Diseases
Shen, J., Shen, G., Li, T., Yang, C., Xing, R., & Yan, X. (2025) · Advanced Functional Materials · doi:10.1002/adfm.202521597 · Cited by 9
In situ peptide assemblies for bacterial infection imaging and treatment
Zhou, Y., Xu, L., Sun, X., Zhan, W., & Liang, G. (2024) · Nanoscale · doi:10.1039/d3nr05557d · Cited by 7
A two-component peptide-based hydrogel for endometrial repair and restoring fertility
Zhang, W., Wu, H., Xie, L., Liang, Y., Huang, X., Yang, Z., Xu, T., & Lin, F. (2024) · Chinese Chemical Letters · doi:10.1016/j.cclet.2024.110800 · Cited by 6
Self-citationResearch Progress in Artificial Intelligence-Assisted Preparation of High-Quality Biomaterials
Wei, D., Wang, Z., Lin, H., Yin, X. P., & Wang, Y. (2026) · ACS Omega · doi:10.1021/acsomega.5c09392 · Cited by 7
Bertouille, J., Lommel, R. V., Aerts, R., Dockx, L., Mangialetto, J., Brande, N. P. V. D., Willaert, R., Proft, F. D., Hennecke, U., Martin, C., et al. (2025) · Materials Today Chemistry · doi:10.1016/j.mtchem.2025.102593 · Cited by 6
Smart responsive hydrogels combined with AI design for tumor therapy
Wang, Q., Li, J., Feng, N., & Zhang, Y. (2026) · Acta Pharmaceutica Sinica B · doi:10.1016/j.apsb.2026.02.019 · Cited by 7
Machine-Learning-Enabled Hydrogel Biosensors for Wearable Health Monitoring
Zhang, Z. (2026) · Gels · doi:10.3390/gels12050449 · Cited by 6
Anuar, W. A. N. W., Ramli, R. A., Lian, Y. M., Nazlan, R., Tan, S. H., & Roslan, R. (2026) · Journal of Polymer Research · doi:10.1007/s10965-025-04720-6 · Cited by 4
Precise Design of Hydrogels by Machine Learning-Assisted Solvent Exchange Strategy
Ma, L., Li, W., Li, Z., Qian, J., Zhao, C., Wu, Y. F., He, H., Jin, G., Zhu, J., Pan, X., et al. (2026) · Macromolecules · doi:10.1021/acs.macromol.5c02582 · Cited by 4
Self-citationSelf-assembled hydrogels promote wound healing
Lin, D., Huang, Y.-Q., Qian, Y., Shen, J., & Wei, H. (2026) · Journal of Materials Chemistry B · doi:10.1039/d5tb02548f · Cited by 4
Cao, F., Xu, J., Wang, X., Liu, Y., Pang, S., Jiao, Q., Zhou, S., Zhong, W., & Xu, K. (2024) · New Journal of Chemistry · doi:10.1039/d3nj05745c · Cited by 4
Kadir, F. F. N. A., Nordin, M. A. C., Shuid, A. N., & Omar, M. T. C. (2024) · Molecular Simulation · doi:10.1080/08927022.2024.2378833 · Cited by 4
Ultrashort Peptides as Stabilizing Agents for Colloidal Nanogold
Figueroa, J. D., Schejtman, S. D. G., Tu, R., Muñoz, M. A., Salas-Sepúlveda, F., Poblete, H., Langlois, M., Suuronen, E. J., & Alarcon, E. I. (2025) · ACS Applied Materials & Interfaces · doi:10.1021/acsami.4c17794 · Cited by 4
Multiscale Biophysical Characterization of Ultra‐Short Peptide Hydrogels
Patel, K., Chakraborty, S., Dutta, P., Biswas, I., Senapati, B., Roy, S., & Bhunia, A. (2026) · ChemBioChem · doi:10.1002/cbic.70402 · Cited by 3
Self‐Assembly Pathway Influence on Dehydropeptide‐Based Gel Properties and Drug Release
Veloso, S. R. S., Vijayakanth, T., Shankar, S., Fridman, N., Rencus‐Lazar, S., Hilliou, L. H. G., Rodrigues, P. V., Moura, C., Ferreira, P. M. T., Correa‐Duarte, M. A., et al. (2025) · Macromolecular Bioscience · doi:10.1002/mabi.202400449 · Cited by 3
Peptide Designs for Cell‐Interfacing Assemblies
Guo, P., Jiang, Y., & Jiang, T. (2024) · Chemistry - A European Journal · doi:10.1002/chem.202402880 · Cited by 2
Dynamic and adaptive self‐healing hydrogels: from network engineering to advanced functional systems
Behroozi, B., & Afshar, H. (2026) · Polymer International · doi:10.1002/pi.70166 · Cited by 2
Predicting milk-derived hydrogel-forming peptides with TANGO
Khan, M. A., Hémar, Y., Cheng, K., Stadler, F. J., & Rodriguez, L. M. D. L. (2024) · International Dairy Journal · doi:10.1016/j.idairyj.2024.105920 · Cited by 2
Chen, X., Zhou, H., He, X., & Wang, J. (2025) · bioRxiv (Cold Spring Harbor Laboratory) · doi:10.1101/2025.06.25.661460 · Cited by 2
Self-citationIntegrating sequence and chemical insights: a co-modeling AI prediction framework for peptides
Liu, Z., Yan, M., Zhu, Z., Guo, Y., Xu, M. H., & Wang, J. (2025) · Journal of Materials Informatics · doi:10.20517/jmi.2024.91 · Cited by 1
Self-citationLiu, S., Zhou, H., Bian, W., Huan, K., Zhao, M. Q., & Wang, J. (2025) · ACS Omega · doi:10.1021/acsomega.5c06570 · Cited by 1
Self-citationDashti, R., Safaei, F., Sadeghian, G., Hosseini, S. A., & Bani, M. S. (2025) · Journal of Biomaterials Applications · doi:10.1177/08853282251395196 · Cited by 3
From protein sequences to super-adhesion: A data-driven pipeline for hydrogel design
Zou, S., Xiao, L., & Sun, R. (2025) · Matter · doi:10.1016/j.matt.2025.102484 · Cited by 1
Noncovalent Coassembly Strategy for Electron Redistribution-Driven Hemoglobin Stabilization
Zhao, C., Zhang, C., Guo, S., Zheng, Y., Li, Y., Wang, Y., Huang, H., Shi, Z., Jiaojiao, M., Liu, X., et al. (2025) · ACS Applied Materials & Interfaces · doi:10.1021/acsami.5c14650 · Cited by 1
Yan, M., Abuduhebaier, A., Zhou, H., & Wang, J. (2025) · Advanced Intelligent Discovery · doi:10.1002/aidi.202500163 · Cited by 1
Self-citationAI-guided engineering of super-adhesive hydrogels for wet environments
Wu, M., & Wang, C. (2025) · 中国科学通报:英文版 · doi:10.1016/j.scib.2025.12.015 · Cited by 1
Chen, S., Shi, Y., Liang, H., Lin, H., Geng, P., Luo, D., Lan, H., & Xiao, S. (2026) · Chinese Journal of Structural Chemistry · doi:10.1016/j.cjsc.2026.100919 · Cited by 1
Comprehensive Evaluation and Optimization of Martini Simulations for Dipeptide Self-Assembly
He, Z. X., Bai, C., Ma, R., Zhang, S., Fan, X., Li, J., Guo, S., Luo, C., Jin, J., & Ye, F. (2026) · The Journal of Physical Chemistry B · doi:10.1021/acs.jpcb.5c08159 · Cited by 1
Li, J., Shi, Y., Ye, M., Cai, H., & Chen, J. (2026) · ACS Biomaterials Science & Engineering · doi:10.1021/acsbiomaterials.5c01967 · Cited by 1
Design and applications of metal-binding peptides
Boas, D., & Reches, M. (2026) · Nano Today · doi:10.1016/j.nantod.2026.103057 · Cited by 1
Wang, C., Birchall, M., & Mehrban, N. (2026) · Interface Focus · doi:10.1098/rsfs.2025.0050 · Cited by 1
Artificial intelligence-assisted design of Chinese herbal medicine based hydrogels
林升圭, He, Z., Xia, X., Li, W., Mao, Y., & Shi, H. S. (2026) · Colloids and Surfaces B Biointerfaces · doi:10.1016/j.colsurfb.2026.115745 · Cited by 1
Self-citationDeep learning mechanism and its application in biomacromolecules
Li, H., Zhang, G., Yan, B., Ye, Z. P., Zhen, X., & Liu, Y. (2026) · RSC Advances · doi:10.1039/d6ra00550k · Cited by 2
Metadata
- Authors
- Xu, T., Wang, J., Zhao, S., Chen, D., Zhang, H., Fang, Y., Kong, N., Zhou, Z., Li, W., & Wang, H.
- Affiliations
- Westlake University (CN)
- Corresponding author
- Li, Wenbin
- Wang, Huaimin
- ORCID
- Venue
- Nature Communications
- Published
- 2023-06-30
- Volume
- 14
- Issue
- 1
- Pages
- 3880-3880
- ISSN
- 2041-1723 (ISSN-L)
- PMC
- PMC10313671
- OpenAlex
- W4382775111
- Cited by
- 132
- References
- 62
- Citations by year
- 2026: 42 · 2025: 44 · 2024: 39 · 2023: 7
- FWCI
- 8.45
- Type
- journal article
- Language
- en
- Open access
- gold
- doi.org
- Locations
- Nature Communications (publishedVersion, cc-by)
- PubMed Central (publishedVersion, cc-by)
- PubMed (publishedVersion)
- RePEc: Research Papers in Economics (submittedVersion)
- DOAJ (DOAJ: Directory of Open Access Journals) (submittedVersion, cc-by-sa)
- The HKU Scholars Hub (University of Hong Kong) (submittedVersion)
- Funders
- National Natural Science Foundation of China (82022038)
- Topics
- Physical Sciences › Materials Science › Biomaterials › Supramolecular Self-Assembly in Materials
- Physical Sciences › Chemistry › Organic Chemistry › Chemical Synthesis and Analysis
- Physical Sciences › Materials Science › Materials Chemistry › Machine Learning in Materials Science
- Keywords
- peptide hydrogels, tetrapeptide, machine learning, human-in-the-loop, interactive machine learning, peptide self-assembly, aggregation propensity, hydrophobicity, de novo peptide design, SARS-CoV-2 receptor-binding domain, immune response
- MeSH terms
- COVID-19, SARS-CoV-2, Amino Acid Sequence, Animals, Humans, Peptides, Hydrogels, Mice
About these checks
Registry, retraction, Cites and statistics results are computed, not judged, with one exception: a printed reference that no index lists is read once by a model before it counts as a citation error. Claims are extracted by a model and kept only when their quote appears verbatim in the text; each cited source is then checked, with a model’s help, for whether it says what the claim relies on. Those verdicts can be wrong — read the claim’s quote and the cited source before relying on one.
Statistics and arithmetic are recomputed, not judged.
Confidence bands are shown only for fields calibrated on our annotated test set. None is calibrated yet, so no band is shown.
What counts as a claim ›How we measure confidence ›How we check this ›
Are you an author, or do you see a problem with this page? Request a review
