

The DOI matches its Crossref record; 51 of the 51 references it cites were found in a registry or an index.
High density lithium niobate photonic integrated circuits
Open accessPublished version of a preprint
Abstract
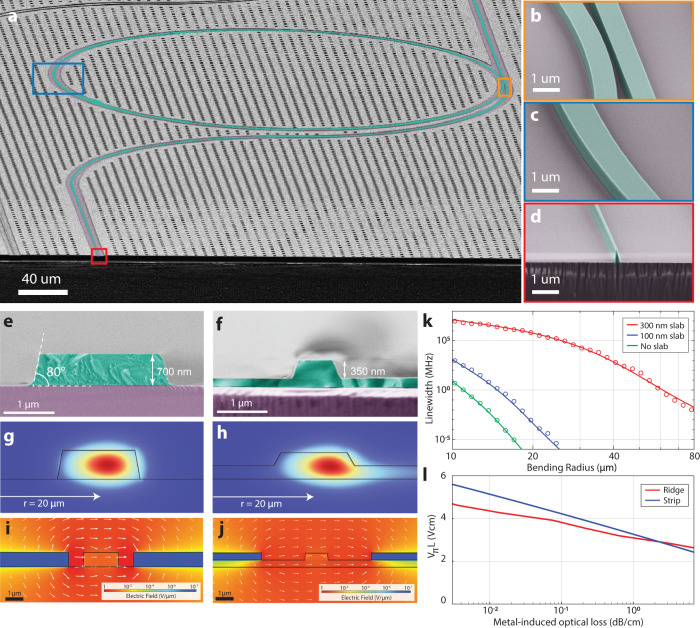
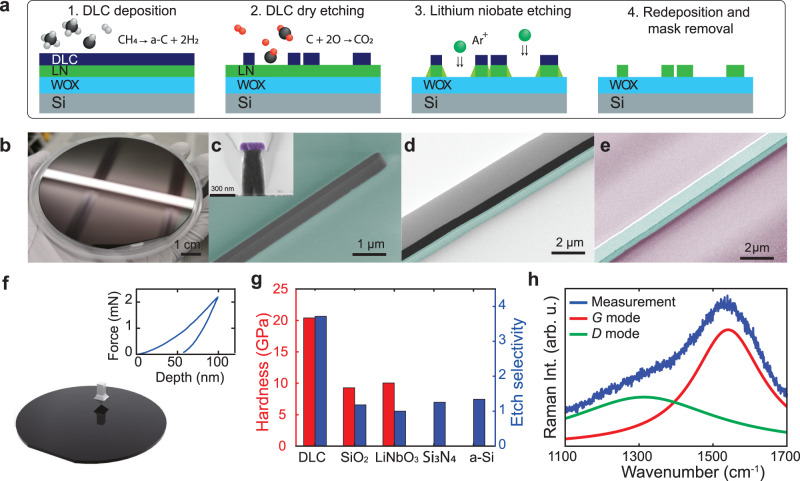
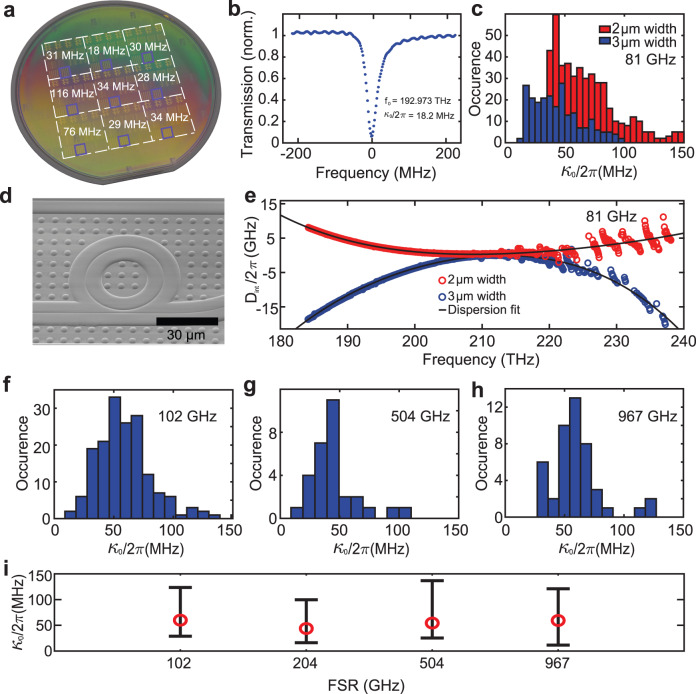
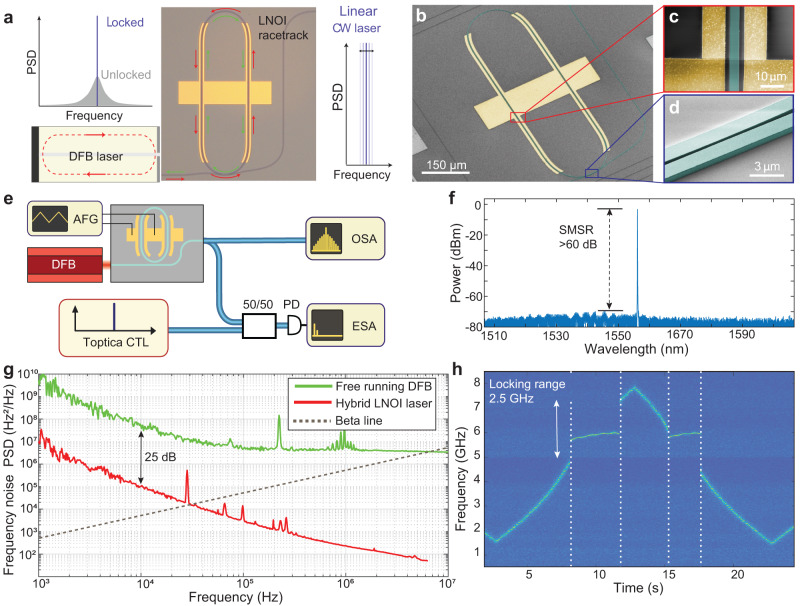
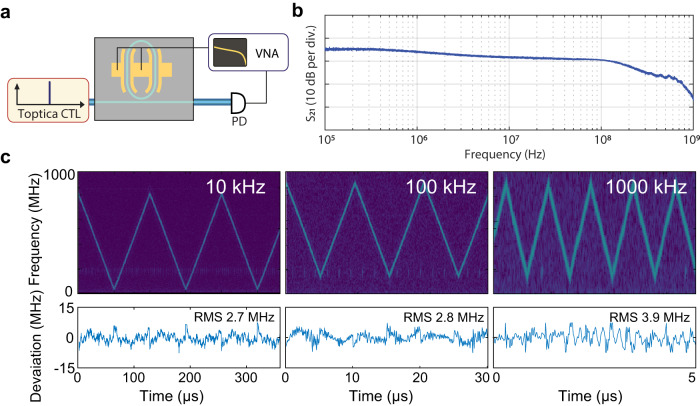
Abstract Photonic integrated circuits are indispensable for data transmission within modern datacenters and pervade into multiple application spheres traditionally limited for bulk optics, such as LiDAR and biosensing1. New applications and higher performance are enabled by the diversification of optical waveguide materials past silicon-on-insulator. Of particular interest are ferroelectrics such as Lithium Niobate, which exhibit a large electro-optical Pockels effect enabling ultrafast and efficient modulation, but are difficult to process via dry etching2. For this reason, etching tightly confining waveguides - routinely achieved in silicon or silicon nitride - has not been possible. Diamond-like carbon (DLC) was discovered in the 1950s 3 and is a material that exhibits an amorphous phase, excellent hardness, and the ability to be deposited in nano-metric thin films. Its use today is pervasive, ranging from applications for hard disk surfaces 4 and medical devices 5 to low friction coatings for automotive components 6. It has excellent thermal, mechanical, and electrical properties, making it an ideal protective coating. Here we demonstrate that DLC is also a superior material for the manufacturing of next-generation photonic integrated circuits based on ferroelectrics, specifically Lithium Niobate on insulator (LNOI). Using DLC as a hard mask, we demonstrate the fabrication of deeply etched, tightly confining, low loss photonic integrated circuits with losses as low as 4 dB/m and Q-factor as high as 10 · 106. In contrast to widely employed ridge waveguides 7,8, this approach benefits from a more than 1 order of magnitude higher area integration density while maintaining efficient electro-optical modulation, low loss, and offering a route for efficient optical fiber interfaces. As a proof of concept, we demonstrate a frequency agile hybrid integrated III-V Lithium Niobate based laser with sub-kHz linewidth and tuning rate of 0.7 Peta-Hertz per second with excellent linearity and CMOS-compatible driving voltage. Our approach can herald a new generation of high density ferroelectric photonic integrated circuits, in particular for applications in coherent laser based ranging 9 and beamforming 10, optical communications 7, and classical 11 and quantum computing networks 12.
Overview
The claims and statistics of this paper haven’t been checked yet.
Run the check — free, no account needed. It reads the open-access text and checks the sources it cites.
Integrity signals
Registry
Cites
Statistics
Figures
Verification
Claims the paper makes
The claims and statistics of this paper haven’t been checked yet.
Run the check — free, no account needed. It reads the open-access text and checks the sources it cites.
Claims other papers make about this one
Each is checked against this paper’s own text: does it say what the citing paper says it does?
The source backs part of the claim, not all of it — or backs it for a different population, condition or comparison.
In the citing paper
“recently, Li et al. [192] fabricated the first PIC platform on LNOI through direct etching using diamond-like carbon (DLC) masks”
From Metal Oxide Thin Films for Advanced Photonic Applications (2026) · cites this paper as [192]
Experimental — accuracy not yet measured
Self-check
Percentages, sums and reported differences re-computed from the paper’s own numbers.
The self-check needs the paper’s full text.
Citations
Cites
Robertson, J. (2002) · Materials Science and Engineering R Reports · doi:10.1016/s0927-796x(02)00005-0 · Cited by 6,210
Integrated lithium niobate electro-optic modulators operating at CMOS-compatible voltages
Wang, C., Zhang, M., Chen, X., Bertrand, M., Shams-Ansari, A., Chandrasekhar, S., Winzer, P., & Lončar, M. (2018) · Nature · doi:10.1038/s41586-018-0551-y · Cited by 2,593
Integrated photonics on thin-film lithium niobate
Zhu, D., Shao, L., Yu, M., Cheng, R., Desiatov, B., Xin, C. J., Hu, Y., Holzgrafe, J., Ghosh, S., Shams-Ansari, A., et al. (2021) · Advances in Optics and Photonics · doi:10.1364/aop.411024 · Cited by 1,516
Thomson, D., Zilkie, A., Bowers, J. E., Komljenovic, T., Reed, G. T., Vivien, L., Marris-Morini, D., Cassan, E., Virot, L., Fédéli, J.-M., et al. (2016) · Journal of Optics · doi:10.1088/2040-8978/18/7/073003 · Cited by 1,363
He, M., Xu, M., Ren, Y., Jian, J., Ruan, Z., Xu, Y., Gao, S., Sun, S., Wen, X., Zhou, L., et al. (2019) · Nature Photonics · doi:10.1038/s41566-019-0378-6 · Cited by 1,204
Photonic-chip-based frequency combs
Gaeta, A. L., Lipson, M. F., & Kippenberg, T. J. (2019) · Nature Photonics · doi:10.1038/s41566-019-0358-x · Cited by 1,112
Self-citationBroadband electro-optic frequency comb generation in a lithium niobate microring resonator
Zhang, M., Buscaino, B., Wang, C., Shams-Ansari, A., Reimer, C., Zhu, R., Kahn, J. M., & Lončar, M. (2019) · Nature · doi:10.1038/s41586-019-1008-7 · Cited by 980
Monolithic ultra-high-Q lithium niobate microring resonator
Zhang, M., Wang, C., Cheng, R., Shams-Ansari, A., & Lončar, M. (2017) · Optica · doi:10.1364/optica.4.001536 · Cited by 878
Photonic chip–based optical frequency comb using soliton Cherenkov radiation
Brasch, V., Geiselmann, M., Herr, T., Lihachev, G., Pfeiffer, M. H. P., Gorodetsky, M. L., & Kippenberg, T. J. (2016) · Science · doi:10.1126/science.aad4811 · Cited by 872
Self-citationBattery-operated integrated frequency comb generator
Stern, B., Ji, X., Okawachi, Y., Gaeta, A. L., & Lipson, M. F. (2018) · Nature · doi:10.1038/s41586-018-0598-9 · Cited by 804
Research works printed but not linked: 2
- Wang, C. et al. Integrated lithium niobate electro-optic modulators operating at CMOS-compatible voltages. Nature 562, 101–104 (2018). · DOI · Paper page
- He, M. et al. High-performance hybrid silicon and lithium niobate mach–zehnder modulators for 100 Gbit s−1 and beyond. Nat. Photonics 13, 359–364 (2019). · DOI · Paper page
Cited by
Sorted by citations
Items 101–171 of 171
High-speed electro-optic engine for a quantized photonic neural network
Han, F., Li, X., Zhao, C.-M., Liu, B.-J., Nie, Y.-L., Zhang, C.-Y., Xia, C.-S., Peng, Y.-Q., Ma, W., Tan, X. G., et al. (2026) · Optica · doi:10.1364/optica.584297 · Cited by 2
Thin-film lithium niobate waveguide polarizer with a high extinction ratio exceeding 40 dB
Song, L. Y., Liu, T., Chi, X., Zhang, H., Feng, L., & Liu, X. (2026) · Optics Letters · doi:10.1364/ol.593105 · Cited by 2
Visible and Near-Infrared Thin-Film Lithium Niobate Modulators with Thermo-Optic Bias
Liu, T., Bebeti, E., Straguzzi, J. N., Poon, J. K. S., & Sacher, W. D. (2026) · ACS Photonics · doi:10.1021/acsphotonics.6c00668 · Cited by 2
Wei, Y., Zhang, L., & Ge, D. (2024) · Optical Engineering · doi:10.1117/1.oe.63.3.037104 · Cited by 2
Sub-kHz linewidth integrated Pockels laser
Xue, S., Li, M., Ling, J., Gao, Z., Hu, Q., Lopez‐Rios, R., Staffa, J., Xiang, C., Wang, H., Bowers, J. E., et al. (2024) · Conference on Lasers and Electro-Optics · doi:10.1364/cleo_si.2024.sth3m.4 · Cited by 2
Oxygen Plasma Surface‐Activated Lithium Niobate for Controlling Protons Diffusion Rate
Sosunov, A. V., Петухов, И. В., Козлов, А. А., Masalkin, D. N., Kornilicyn, A. R., Sheremet, A. G., & Kuneva, M. K. (2025) · physica status solidi (a) · doi:10.1002/pssa.202400924 · Cited by 2
Zhang, L., Xie, M., Yu, Y., Li, J. M., Ma, W., Chu, T., & Xiong, B. (2025) · Optics Communications · doi:10.1016/j.optcom.2025.132032 · Cited by 2
Herath, K., Gunapala, S. D., & Premaratne, M. (2024) · Physica Scripta · doi:10.1088/1402-4896/ad3022 · Cited by 2
Metal Oxide Thin Films for Advanced Photonic Applications
Stîngescu, M.-L., Șopronyi, M.-A., Antohe, Ș., & Scărișoreanu, N.-D. (2026) · Crystals · doi:10.3390/cryst16030164 · Cited by 2
Topology Optimization of Lithium Niobate Mode Converter
Bae, M., Kim, C., Lee, S., Choi, M., Lee, M., Jung, H., Kwon, H., & Chung, H. (2024) · Conference on Lasers and Electro-Optics Pacific Rim (CLEO-PR) · doi:10.1109/cleo-pr60912.2024.10676517 · Cited by 1
Highly efficient 1.76 μm on-chip amplification in in-band pumped Tm3+-doped LNOI photonic wire
Zhang, P., Li, S., Meng, F.-S., Yang, Y., & Zhang, D. (2025) · Optical and Quantum Electronics · doi:10.1007/s11082-025-08587-1 · Cited by 1
Wang, W., Xu, Q., Wang, S., Liu, H., Zheng, D., Liu, Y. W. Q., & Kong, Y. (2026) · The European Physical Journal Special Topics · doi:10.1140/epjs/s11734-026-02276-0 · Cited by 1
Research progress on ultrafast optical switches
Yue, M., Huang, J., Xu, P., Chang, G., Zhao, L., Hui, D., & Fu, Y. (2026) · Applied Physics Reviews · doi:10.1063/5.0314225 · Cited by 1
Monolithically Integrated Silicon Photonic Transceiver for Compact CV-QKD
Fatkhiev, D. M., Frazão, J., Derkani, A. H., Gümüş, K., van den Hout, M., Albores-Mejía, A., & Okonkwo, C. M. (2026) · Journal of Lightwave Technology · doi:10.1109/jlt.2026.3713826 · Cited by 1
Loss-tolerant cross-Kerr enhancement via modulated squeezing
Tiwari, A., Burgarth, D. K., Fan, L., Guha, S., & Arenz, C. (2025) · Optics Express · doi:10.1364/oe.577300 · Cited by 2
Origin of electro-optic response in trigonal lithium tantalate LiTaO 3
Hussain, I., Gao, Y., Gu, Y., Hong, W., Iitaka, T., Su, H., & Li, Z. (2025) · Physical review. B./Physical review. B · doi:10.1103/z9gy-z927 · Cited by 1
Self-citationChen, W., Guo, H., Liu, S., Zhou, X., Jin, X., Mao, K., Ma, F., Hu, Y., Tu, X., & Liu, X. (2025) · Journal of Alloys and Compounds · doi:10.1016/j.jallcom.2025.184027 · Cited by 1
Self-injection-locking FMCW laser source on the lithium niobate platform
Li, X., Cai, M., Xu, R., Fan, Y., Liu, C., Guo, Y., Siyu, E., Jin, M., Wu, K., Li, Y., et al. (2024) · Conference on Lasers and Electro-Optics · doi:10.1364/cleo_si.2024.sth1o.3 · Cited by 1
Lithium tantalate photonic integrated circuits for high volume manufacturing
Wang, C., Li, Z., Riemensberger, J., Lihachev, G., Churaev, M., Ji, X., Huang, K., Ou, X., & Kippenberg, T. J. (2024) · Conference on Lasers and Electro-Optics · doi:10.1364/cleo_at.2024.ath1j.5 · Cited by 1
Self-citationTurygin, A. P., Alikin, D., Kosobokov, M. S., Akhmatkhanov, A. R., & Shur, V. Y. (2024) · Applied Physics Letters · doi:10.1063/5.0240090 · Cited by 1
Ultrafast Tunable Photonic Integrated Extended-DBR Pockels Laser
Siddharth, A., Bianconi, S., Wang, R. N., Qiu, Z., Voloshin, A., Bereyhi, M. J., Riemensberger, J., & Kippenberg, T. J. (2025) · Conference on Lasers and Electro-Optics Europe & European Quantum Electronics Conference (CLEO/Europe-EQEC) · doi:10.1109/cleo/europe-eqec65582.2025.11109417 · Cited by 1
Self-citationUltrafast tunable photonic integrated extended-DBR Pockels laser
Siddharth, A., Bianconi, S., Qiu, Z., Wang, R. N., Bereyhi, M. J., Riemensberger, J., & Kippenberg, T. J. (2025) · Conference on Lasers and Electro-Optics · doi:10.1364/cleo_at.2025.aa122_8 · Cited by 1
Self-citationKumar, S., Nagarajan, R., Babu, S. V., & Ignatious, J. J. (2024) · Optical and Quantum Electronics · doi:10.1007/s11082-024-06888-5
Ultrafast Tunable Photonic Integrated E-DBR Pockels Laser
Siddharth, A., Bianconi, S., Qiu, Z., Wang, R. N., Bereyhi, M. J., Kippenberg, T. J., & Riemensberger, J. (2024) · Springer proceedings in physics · doi:10.1007/978-3-031-63378-2_8
Self-citationLarge, deterministic and tunable thermo-optic shift for all photonic platforms
Lopez-Rodriguez, B., Sharma, N., Li, Z., van der Kolk, R. J. H., van der Boom, J., Scholte, T., Chang, J., Pereira, S. F., & Zadeh, I. E. (2024) · Integrated Photonics Platforms · doi:10.1117/12.3022107
Self-citationIntegrated Lithium Niobate Microwave Photonic Applications
Feng, H., Ge, T., & Wang, C. (2024) · International Topical Meeting on Microwave Photonics · doi:10.1109/mwp62612.2024.10736288
Power Clamping in Second Harmonic Generation Within an On‐Chip Lithium Niobate Microdisk
Fu, B., Gao, R., Yao, N., Lin, J., Wang, M., Qiao, L., & Cheng, Y. (2024) · Laser & Photonics Review · doi:10.1002/lpor.202401575
Ultrafast Pockels-tunable hybrid integrated E-DBR laser
Bianconi, S., Riemensberger, J., Siddharth, A., Qiu, Z., Wang, R. N., Bereyhi, M. J., & Kippenberg, T. J. (2024) · IEEE Photonics Conference · doi:10.1109/ipc60965.2024.10799656
Self-citationMetal Forming Using Underwater Shock Waves and Polymer Molds
Tanaka, S., & Hasegawa, K. (2024) · The Review of High Pressure Science and Technology · doi:10.4131/jshpreview.34.165
Shi, H., Zhang, T., Zhang, Y., Zheng, T., Nie, C., Liu, C., & Sun, J. (2025) · Journal of Physics Conference Series · doi:10.1088/1742-6596/2988/1/012002
Wafer Scale TFLN Platform Exhibiting 0.1 dB/cm Single Mode Propagation Loss
Lv, L., Hong, B., Fang, S., Shen, R., Yu, Y., Wang, Y., Zhou, Y., Cai, H., & Chu, W. (2025) · Optical Fiber Communication Conference · doi:10.1364/ofc.2025.w2a.1
Yan, S., Zhao, J.-H., Zhao, Y., Li, B., Zang, W.-Z., Gu, D., Yao, Y., & Yue, Q.-Y. (2025) · Applied Physics A · doi:10.1007/s00339-025-08691-9
Fabrication of Ultrasmooth, High-Aspect Ratio Nanostructures
Scott, J. A., Zotev, P. G., Sortino, L., Wang, Y., Akande, A. A., Wood, M. L., Tartakovskii, A. I., Toth, M., & Palomba, S. (2025) · ACS Applied Materials & Interfaces · doi:10.1021/acsami.5c09669
Chong, J. L., Kopf, R. F., Kaufman, J., Xu, C., Cappuzzo, M. A., Tate, A., Hu, T.-C., & Earnshaw, M. P. (2025) · Journal of Vacuum Science & Technology B Nanotechnology and Microelectronics Materials Processing Measurement and Phenomena · doi:10.1116/6.0004440
Localized carbon deposition enables trimming of photonic integrated circuits
Xu, R., Tang, Z., McRae, L., Varri, A., Brückerhoff‐Plückelmann, F., Brückerhoff‐Plückelmann, F., Bankwitz, J. R., Römer, J., Pradip, R., Zhang, Q., et al. (2026) · Nature Communications · doi:10.1038/s41467-026-73411-7
Frequency Conversion in Periodically Poled Thin-Film Lithium Tantalate Photonic Integrated Circuits
Kuznetsov, N., Li, Z., Wang, C., & Kippenberg, T. J. (2025) · Conference on Lasers and Electro-Optics Europe & European Quantum Electronics Conference (CLEO/Europe-EQEC) · doi:10.1109/cleo/europe-eqec65582.2025.11109163
Self-citationPockels Laser For Driving Ultrafast Optical Metrology
Xue, S., Li, M., Lopez‐Rios, R., Ling, J., Gao, Z., Hu, Q., Qiu, T., Staffa, J., Chang, L., Wang, H., et al. (2025) · Conference on Lasers and Electro-Optics · doi:10.1364/cleo_si.2025.ss124_3
Frequency Conversion in Periodically Poled Lithium Tantalate Photonic Integrated Circuits
Kuznetsov, N., Wang, C., Li, Z., & Kippenberg, T. J. (2025) · Conference on Lasers and Electro-Optics · doi:10.1364/cleo_si.2025.ss193_5
Self-citationThyagarajan, K. (2025) · Graduate texts in physics · doi:10.1007/978-3-031-85728-7_1
Design and Performance Analysis of Lithium Niobate-Based Optical Modulator
Prabha, K., Chaya, B. M., & Sindhu, S. (2025) · International Conference on Networks, Multimedia and Information Technology (NMITCON) · doi:10.1109/nmitcon65824.2025.11188296
Lin, M., He, J., Liu, L., Lin, F.-C., & Ma, F. (2025) · Journal of Applied Physics · doi:10.1063/5.0293768
Hou, S., Zhu, C., Zhang, J., Xu, M., Xiao, H., Hu, H., Yu, J., Liu, Z., Xie, Z., He, X., et al. (2025) · Nanotechnology · doi:10.1088/1361-6528/ae2131
Self-citationSOI Based Broadband LiNbO 3 Interferometer Using Slot Waveguide Phase Modulator
Priyanka, K., Srivastava, D., Vardhan, S., & Singh, R. R. (2025) · Advanced Theory and Simulations · doi:10.1002/adts.202501378
Ultrafast Tunable Photonic Integrated Pockels Extended-DBR Laser
Bianconi, S., Siddharth, A., Qiu, Z., Wang, R. N., Bereyhi, M. J., Riemensberger, J., & Kippenberg, T. J. (2025) · European Conference on Optical Communication · doi:10.1109/ecoc66593.2025.11263390
Self-citationCenti-combs: low-noise sub-GHz repetition-rate soliton frequency combs from crystalline resonators
Murakami, T., Ogawa, K., Kumazaki, H., & Fujii, S. (2026) · Optics Letters · doi:10.1364/ol.588924
Low-noise self-injection-locked laser on LNOI platform achieving high-performance FMCW generation
Shao, S., Wu, Y., Yang, S., Chen, H., & Chen, M. (2025) · Conference on Lasers and Electro-Optics · doi:10.1364/cleo_si.2025.ss166_3
Ultrafast tunable photonic integrated extended-DBR Pockels laser
Bianconi, S., Siddharth, A., Qiu, Z., Wang, R. N., Bereyhi, M. J., Riemensberger, J., & Kippenberg, T. J. (2025) · OSA Advanced Photonics Congress · doi:10.1364/iprsn.2025.im2a.2
Self-citationCharacteristic of LiNbO 3 thin film ICP etching for micro/nano fabrication
Huang, Y., Liu, Y., & Wu, T. (2026) · Journal of Micromechanics and Microengineering · doi:10.1088/1361-6439/ae36b6
Savchenko, M. L., Solonenko, D. I., Azeem, S., Andrianov, N. A., & Cassese, T. (2026) · Journal of Applied Physics · doi:10.1063/5.0304642
Exploration of TFLN pedestal waveguides for high-speed modulation applications
Alvarado, M. A., Jara, F., Escudero-Mechan, C., Hernandez-Figueroa, H. E., Alayo, M. I., & Rubio-Noriega, R. E. (2026) · Physics and simulation of optoelectronic devices. Conference · doi:10.1117/12.3079902
Versatile low-noise laser via multi-material hybrid integration
Wu, Y., Shao, S., Zhang, H., Xue, Q., Yang, S., Chen, H., Wang, H., & Chen, M. (2025) · Asia Communications and Photonics Conference · doi:10.1109/acp66871.2025.11350582
Mode-dependent phase in waveguides supporting orbital angular momentum
Moura, J. V. S., Santos, L. M. S., de Oliveira, J. M., Rocha, J. C. A., Jesus‐Silva, A. J., Khoury, A. Z., & Fonseca, E. J. S. (2026) · APL Photonics · doi:10.1063/5.0292980
Sosunov, A. V., Kornilicyn, A. R., Pankov, A. S., Ponomarev, R. S., Moskalev, D. N., Voblikov, E. D., Mololkin, A. A., Fakhrtdinov, R. R., Savelyev, E., Akhmatkhanov, A. R., et al. (2026) · Journal of Advanced Dielectrics · doi:10.1142/s2010135x26500013
Erbium-Doped Glass Waveguide Featuring Metallic Nanostructured Cladding
Wang, Y., Liu, J., Zhao, Y., & Jiang, C. (2026) · Journal of Lightwave Technology · doi:10.1109/jlt.2026.3670438
Slow-light microring resonators on thin-film lithium tantalate
han, Q., Sun, M., Wang, X., Chen, Y., Huang, J., Zhang, X., Zhu, Y.-H., Zhou, W., Wang, Y., Su, Y., et al. (2026) · Optics Letters · doi:10.1364/ol.593288
Integrated coherent LiDAR: Advances in tunability, steering, and parallelization
Chen, R., Li, W., Wu, Y., Tang, Y., Shu, H., & Wang, X. (2026) · Applied Physics Reviews · doi:10.1063/5.0300784
Yilin, 吴. W., Sigang, 杨. Y., Hongwei, 陈. C., & Minghua, 陈. C. (2026) · Chinese Journal of Lasers · doi:10.3788/cjl260485
Shuo, 李. L., Yunfei, 李. L., Gong, 王. W., He, 曹. C., Ang, 孙. S., Yunpeng, 张. Z., Bingyang, 卢. L., Yu, 于. Y., Yulei, 王. W., & Zhiwei, 吕. L. (2026) · Chinese Journal of Lasers · doi:10.3788/cjl260580
Self-aligned assembly of piezoelectric nanorods for 6G wireless communications
Yang, K., Chen, J., Wang, J., Fang, J., Wang, Y., Qiu, H., Li, M., Lin, F., Long, J., Chen, S., et al. (2026) · Microsystems & Nanoengineering · doi:10.1038/s41378-026-01363-5
Fu, Y., Li, J., Li, S., Sun, S., Xu, J., Cui, W., Zhang, D., & Wang, X. (2026) · Optics Express · doi:10.1364/oe.608329
Fast and efficient extended-DBR Pockels laser based on a Lithium Tantalate photonic platform
Bianconi, S., Siddharth, A., Li, Z., & Kippenberg, T. J. (2026) · Conference on Lasers and Electro-Optics · doi:10.1364/cleo_at.2026.am4b.2
Self-citationRecirculating frequency-shifting loop for flexible optical chirp generation and FMCW LiDAR
Mrokon, A., Schöler, S., Voßgrag, L., Buse, K., & Breunig, I. (2026) · Optics Continuum · doi:10.1364/optcon.600616
Zheng, 李. L., Hongjie, 梁. L., & Chao, 向. X. (2026) · Acta Optica Sinica · doi:10.3788/aos260826
Integrated photonic devices in thin-film barium titanate: Opportunities and challenges
Lin, H., Shang, M., Yin, Y., Fu, W., Qi, L., & Danner, A. J. (2026) · Applied Physics Reviews · doi:10.1063/5.0325359
How nanophotonics can drive optical computing toward practical applications
Chen, Y., Yang, G., Yan, T., Tang, C., Wu, J., & Dai, Q. (2026) · Nature Nanotechnology · doi:10.1038/s41565-026-02264-4
Quasi-isotropic phase modulator architecture based on thin-film lithium niobate
Li, X., Jiao, H., Li, W., Huang, A., Zhang, Q., Li, Q., Liu, E., Feng, D., Guan, X., Zhen, Z., et al. (2026) · Optics & Laser Technology · doi:10.1016/j.optlastec.2026.116321
Hwang, H., Go, S., Kim, G., Kim, H.-S., Moon, K., Ju, J. J., Lee, H., & Seo, M. (2026) · Photonics Research · doi:10.1364/prj.608850
Qi, W., Zhi, Y., Peng, W., Chen, H., Cheng, F., Wang, T., & Zheng, H. (2026) · Nano Energy · doi:10.1016/j.nanoen.2026.112418
Programmable heterogeneous lithium niobate photonic circuits via active–passive joint inverse design
Zhang, L., Zhong, H., Qu, N., Yu, H., Yang, Y., Chen, Y., Cheng, Y., & Li, L. (2026) · Optica · doi:10.1364/optica.614691
All-Euler-bend lithium niobate microresonators with intrinsic Q-factors exceeding 10 million
Zhang, H., Liu, T., Zhan, B., Chi, X., & Liu, X. (2026) · Optics Letters · doi:10.1364/ol.615284
Material-Inspired High-Speed Modulators for Fiber Communications Technology
Yokoyama, S., Yin, Y., Yazdani, S. A., Sato, H., & Lu, G.-W. (2026) · International Topical Meeting on Microwave Photonics · doi:10.23919/mwp69134.2026.11734323
Metadata
- Authors
- Li, Z., Wang, R. N., Lihachev, G., Zhang, J., Tan, Z., Churaev, M., Kuznetsov, N., Siddharth, A., Bereyhi, M. J., Riemensberger, J., & Kippenberg, T. J.
- Affiliations
- École Polytechnique Fédérale de Lausanne (CH)
- Corresponding author
- Kippenberg, Tobias J.
- ORCID
- Venue
- Nature Communications
- Published
- 2023-08-10
- Volume
- 14
- Issue
- 1
- Pages
- 4856-4856
- ISSN
- 2041-1723 (ISSN-L)
- PMC
- PMC10415301
- OpenAlex
- W4385727101
- Cited by
- 169
- References
- 50
- Citations by year
- 2026: 35 · 2025: 80 · 2024: 51 · 2023: 3
- FWCI
- 19.62
- Type
- journal article
- Language
- en
- Open access
- gold
- doi.org
- Locations
- Nature Communications (publishedVersion, cc-by)
- Research Square (acceptedVersion, cc-by)
- PubMed Central (publishedVersion, cc-by)
- PubMed (publishedVersion)
- Infoscience (Ecole Polytechnique Fédérale de Lausanne) (submittedVersion, cc-by-nc-nd)
- DOAJ (DOAJ: Directory of Open Access Journals) (submittedVersion, cc-by-sa)
- Funders
- National Science Foundation
- European Commission (HORIZON2020, 835329, 812818)
- École Polytechnique Fédérale de Lausanne
- Schweizerischer Nationalfonds zur Förderung der Wissenschaftlichen Forschung (201923, 186364)
- Defense Advanced Research Projects Agency (HR0011-20-2-0046)
- Advanced Research Projects Agency
- Horizon 2020 Framework Programme (812818, EU‐H2020)
- HORIZON EUROPE Framework Programme
- HORIZON EUROPE European Innovation Council (101113260)
- Topics
- Physical Sciences › Physics and Astronomy › Atomic and Molecular Physics, and Optics › Photorefractive and Nonlinear Optics
- Physical Sciences › Engineering › Electrical and Electronic Engineering › Photonic and Optical Devices
- Physical Sciences › Materials Science › Materials Chemistry › Ferroelectric and Piezoelectric Materials
- Keywords
- lithium niobate, photonic integrated circuits, deep etching, low-loss waveguides, electro-optic modulation, Mach-Zehnder modulator, half-wave voltage, CMOS-compatible photonics, optical fiber interface, integration density
About these checks
Registry, retraction, Cites and statistics results are computed, not judged, with one exception: a printed reference that no index lists is read once by a model before it counts as a citation error. Claims are extracted by a model and kept only when their quote appears verbatim in the text; each cited source is then checked, with a model’s help, for whether it says what the claim relies on. Those verdicts can be wrong — read the claim’s quote and the cited source before relying on one.
Statistics and arithmetic are recomputed, not judged.
Confidence bands are shown only for fields calibrated on our annotated test set. None is calibrated yet, so no band is shown.
What counts as a claim ›How we measure confidence ›How we check this ›
Are you an author, or do you see a problem with this page? Request a review
