

The DOI matches its Crossref record; 12 of the 12 references it cites were found in a registry or an index.
Convergent somatic evolution commences in utero in a germline ribosomopathy
Abstract
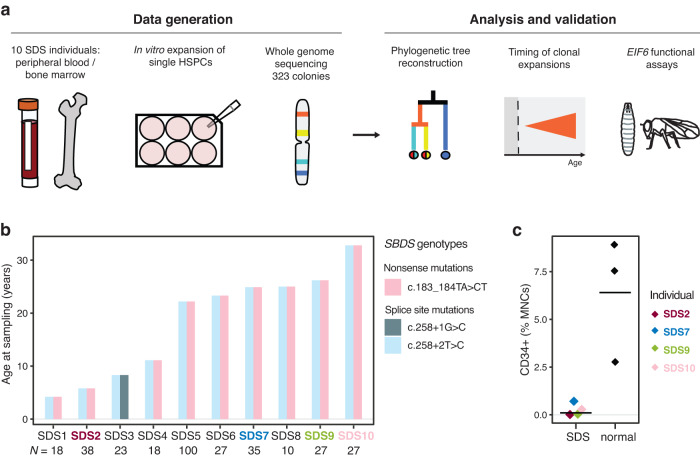
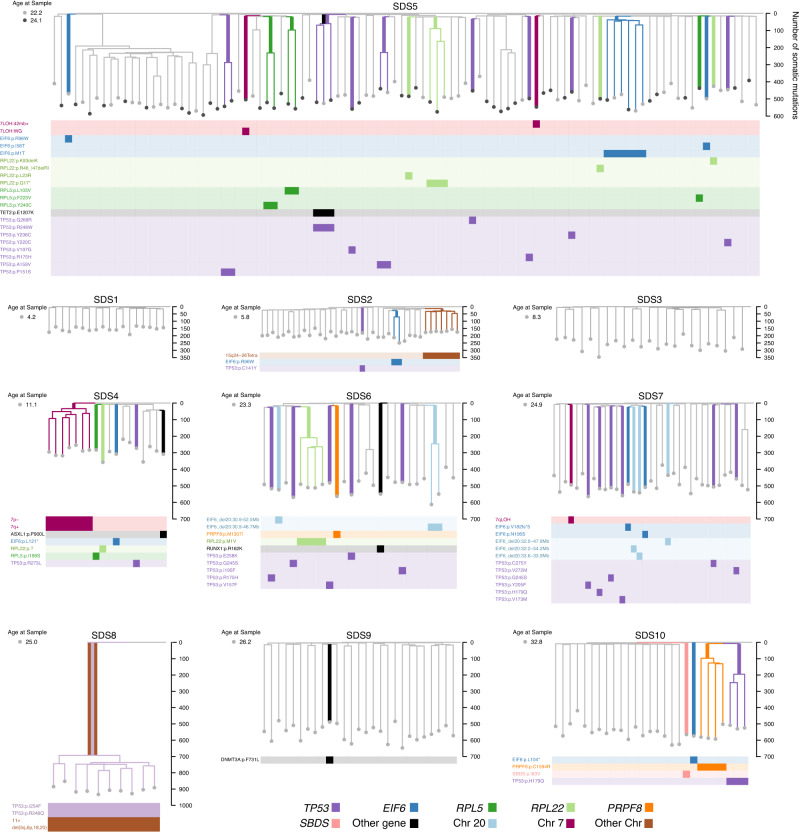
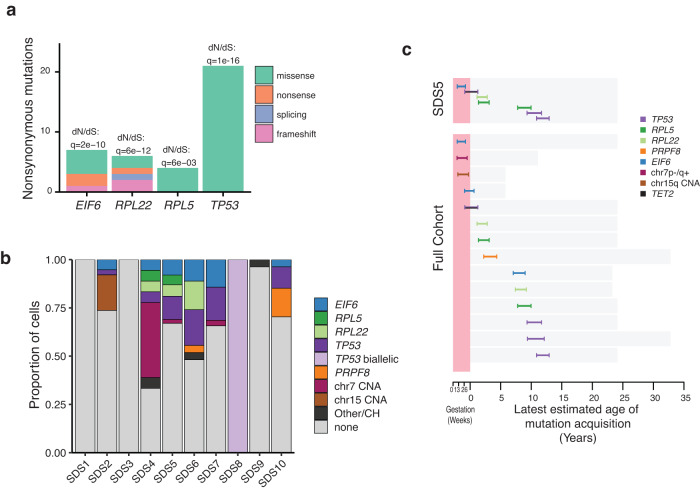
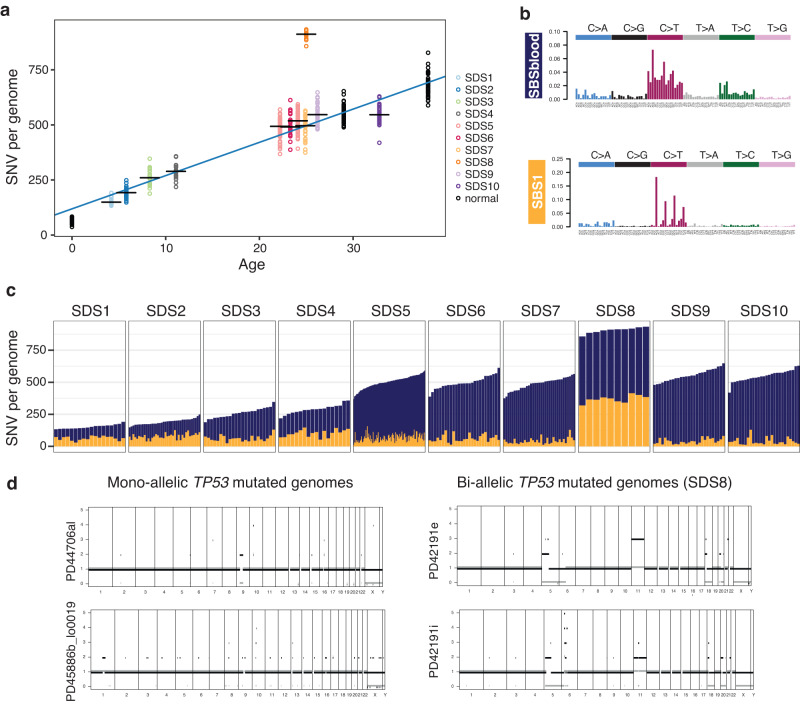
Clonal tracking of cells using somatic mutations permits exploration of clonal dynamics in human disease. Here, we perform whole genome sequencing of 323 haematopoietic colonies from 10 individuals with the inherited ribosomopathy Shwachman-Diamond syndrome to reconstruct haematopoietic phylogenies. In ~30% of colonies, we identify mutually exclusive mutations in TP53, EIF6, RPL5, RPL22, PRPF8, plus chromosome 7 and 15 aberrations that increase SBDS and EFL1 gene dosage, respectively. Target gene mutations commence in utero, resulting in a profusion of clonal expansions, with only a few haematopoietic stem cell lineages (mean 8, range 1-24) contributing ~50% of haematopoietic colonies across 8 individuals (range 4-100% clonality) by young adulthood. Rapid clonal expansion during disease transformation is associated with biallelic TP53 mutations and increased mutation burden. Our study highlights how convergent somatic mutation of the p53-dependent nucleolar surveillance pathway offsets the deleterious effects of germline ribosomopathy but increases opportunity for TP53-mutated cancer evolution.
Overview
The claims and statistics of this paper haven’t been checked yet.
Run the check — free, no account needed. It reads the open-access text and checks the sources it cites.
Integrity signals
Registry
Cites
Statistics
Figures
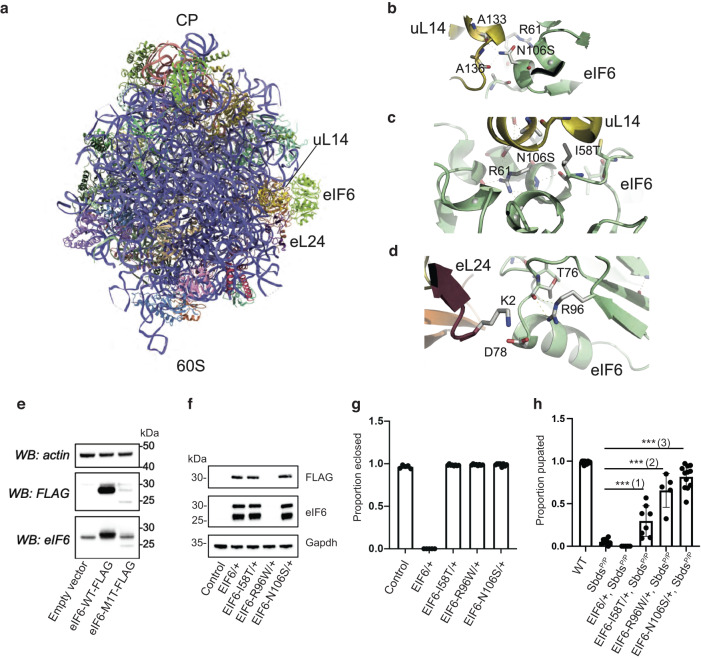
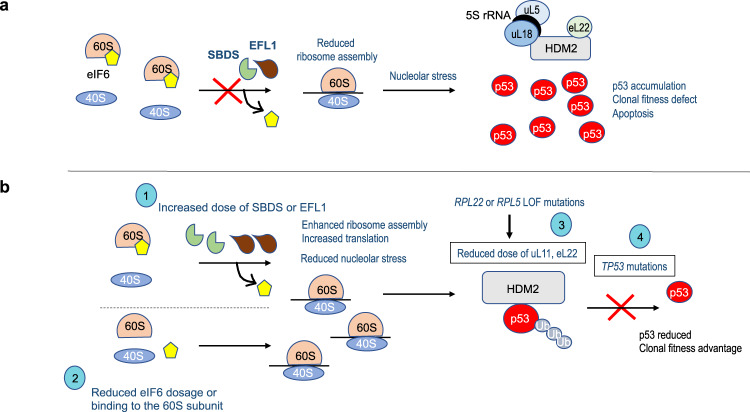
Verification
Claims the paper makes
The claims and statistics of this paper haven’t been checked yet.
Run the check — free, no account needed. It reads the open-access text and checks the sources it cites.
Claims other papers make about this one
Each is checked against this paper’s own text: does it say what the citing paper says it does?
In the citing paper
“Recurrent genetic driver mutations have been identified, conferring on hematopoietic stem cells (HSCs) a competitive advantage over their non-mutant counterparts”
From A scalable in vitro cell competition model identifies preleukemic super competitor clones (2026) · cites this paper as Machado et al, 2023
Self-check
Percentages, sums and reported differences re-computed from the paper’s own numbers.
The self-check needs the paper’s full text.
Citations
Cites
Clonal hematopoiesis and risk of atherosclerotic cardiovascular disease
Jaiswal, S., Natarajan, P., Silver, A. J., Gibson, C. J., Bick, A. G., Shvartz, E., McConkey, M., Gupta, N., Gabriel, S., Ardissino, D., et al. (2017) · New England Journal of Medicine · doi:10.1056/nejmoa1701719 · Cited by 2,683
Landscape of somatic mutations in 560 breast cancer whole-genome sequences
Nik-Zainal, S., Davies, H., Staaf, J., Ramakrishna, M., Glodzik, D., Zou, X., Martincorena, I., Alexandrov, L. B., Martin, S., Wedge, D. C., et al. (2016) · Nature · doi:10.1038/nature17676 · Cited by 2,218
Self-citationMolecular International Prognostic Scoring System for Myelodysplastic Syndromes
Bernard, E., Tuechler, H., Greenberg, P. L., Hasserjian, R. P., Arango Ossa, J. E., Nannya, Y., Devlin, S. M., Creignou, M., Pinel, P., Monnier, L., et al. (2022) · NEJM Evidence · doi:10.1056/evidoa2200008 · Cited by 867
Prognostic Mutations in Myelodysplastic Syndrome after Stem-Cell Transplantation
Lindsley, R. C., Saber, W., Mar, B. G., Redd, R., Wang, T., Haagenson, M. D., Grauman, P. V., Hu, Z.-H., Spellman, S. R., Lee, S. J., et al. (2017) · New England Journal of Medicine · doi:10.1056/nejmoa1611604 · Cited by 776
Inherited causes of clonal haematopoiesis in 97,691 whole genomes
Bick, A. G., Weinstock, J. S., Nandakumar, S. K., Fulco, C. P., Bao, E. L., Zekavat, S. M., Szeto, M. D., Liao, X., Leventhal, M. J., Nasser, J., et al. (2020) · Nature · doi:10.1038/s41586-020-2819-2 · Cited by 733
Bernard, E., Nannya, Y., Hasserjian, R. P., Devlin, S. M., Tuechler, H., Medina-Martinez, J. S., Yoshizato, T., Shiozawa, Y., Saiki, R., Malcovati, L., et al. (2020) · Nature Medicine · doi:10.1038/s41591-020-1008-z · Cited by 648
Population dynamics of normal human blood inferred from somatic mutations
Lee-Six, H., Øbro, N. F., Shepherd, M. S., Grossmann, S., Dawson, K., Belmonte, M., Osborne, R. J., Huntly, B. J. P., Martincorena, I., Anderson, E., et al. (2018) · Nature · doi:10.1038/s41586-018-0497-0 · Cited by 604
Self-citationLeukemia-associated somatic mutations drive distinct patterns of age-related clonal hemopoiesis
McKerrell, T., Park, N., Moreno, T., Grove, C. S., Ponstingl, H., Stephens, J., Crawley, C., Craig, J., Scott, M. A., Hodkinson, C., et al. (2015) · Cell Reports · doi:10.1016/j.celrep.2015.02.005 · Cited by 534
The mutational landscape of normal human endometrial epithelium
Moore, L., Leongamornlert, D., Coorens, T. H. H., Sanders, M. A., Ellis, P., Dentro, S. C., Dawson, K. J., Butler, T., Rahbari, R., Mitchell, T. J., et al. (2020) · Nature · doi:10.1038/s41586-020-2214-z · Cited by 499 · cited 1×
“We removed artefacts from the SV calls using AnnotateBRASS (https://github.com/ MathijsSanders/AnnotateBRASS 66 ) with default settings.”
Self-citationThe evolutionary dynamics and fitness landscape of clonal hematopoiesis
Watson, C. J., Papula, A. L., Poon, G. Y. P., Wong, W. H., Young, A. L., Druley, T. E., Fisher, D. S., & Blundell, J. R. (2020) · Science · doi:10.1126/science.aay9333 · Cited by 444
Research works printed but not linked: 57
- Osorio, F. G. et al. Somatic mutations reveal lineage relationships and age-related mutagenesis in human hematopoiesis. Cell Rep. 25, 2308–2316.e4 (2018). · DOI · Paper page
- Mitchell, E. et al. Clonal dynamics of haematopoiesis across the human lifespan. Nature 606, 343–350 (2022). · DOI · Paper page
- Zink, F. et al. Clonal hematopoiesis, with and without candidate driver mutations, is common in the elderly. Blood 130, 742–752 (2017). · DOI · Paper page
- Boocock, G. R. B. et al. Mutations in SBDS are associated with Shwachman–Diamond syndrome. Nat. Genet. 33, 97–101 (2003). · DOI
- Menne, T. F. et al. The Shwachman-Bodian-Diamond syndrome protein mediates translational activation of ribosomes in yeast. Nat. Genet. 39, 486–495 (2007). · DOI
- Warren, A. J. Molecular basis of the human ribosomopathy Shwachman-Diamond syndrome. Adv. Biol. Regul. 67, 109–127 (2018). · DOI
- Finch, A. J. et al. Uncoupling of GTP hydrolysis from eIF6 release on the ribosome causes Shwachman-Diamond syndrome. Genes Dev. 25, 917–929 (2011). · DOI
- Weis, F. et al. Mechanism of eIF6 release from the nascent 60S ribosomal subunit. Nat. Struct. Mol. Biol. 22, 914–919 (2015). · DOI
- Jaako, P. et al. eIF6 rebinding dynamically couples ribosome maturation and translation. Nat. Commun. 13, 1562 (2022). · DOI
- Donadieu, J. et al. Classification of and risk factors for hematologic complications in a French national cohort of 102 patients with Shwachman-Diamond syndrome. Haematologica 97, 1312–1319 (2012). · DOI
- Dror, Y. et al. Clonal evolution in marrows of patients with Shwachman-Diamond syndrome: a prospective 5-year follow-up study. Exp. Hematol. 30, 659–669 (2002). · DOI
- Parikh, S. et al. Acquired copy number neutral loss of heterozygosity of chromosome 7 associated with clonal haematopoiesis in a patient with Shwachman-Diamond syndrome. Br. J. Haematol. 159, 480–482 (2012). · DOI
- Minelli, A. et al. The isochromosome i(7)(q10) carrying c.258+2t>c mutation of the SBDS gene does not promote development of myeloid malignancies in patients with Shwachman syndrome. Leukemia 23, 708–711 (2009). · DOI
- Lee, S. et al. Somatic uniparental disomy mitigates the most damaging EFL1 allele combination in Shwachman-Diamond syndrome. Blood 138, 2117–2128 (2021). · DOI
- Kennedy, A. L. et al. Distinct genetic pathways define pre-malignant versus compensatory clonal hematopoiesis in Shwachman-Diamond syndrome. Nat. Commun. 12, 1334 (2021). · DOI · Paper page
- Pressato, B. et al. Deletion of chromosome 20 in bone marrow of patients with Shwachman-Diamond syndrome, loss of the EIF6 gene and benign prognosis. Br. J. Haematol. 157, 503–505 (2012). · DOI
- Valli, R. et al. Different loss of material in recurrent chromosome 20 interstitial deletions in Shwachman-Diamond syndrome and in myeloid neoplasms. Mol. Cytogenet. 6, 56 (2013). · DOI
- Tan, S. et al. Somatic genetic rescue of a germline ribosome assembly defect. Nat. Commun. 12, 5044 (2021).
- Sloan, K. E., Bohnsack, M. T. & Watkins, N. J. The 5S RNP couples p53 homeostasis to ribosome biogenesis and nucleolar stress. Cell Rep. 5, 237–247 (2013). · DOI
- Elghetany, M. T. & Alter, B. P. p53 protein overexpression in bone marrow biopsies of patients with Shwachman-Diamond syndrome has a prevalence similar to that of patients with refractory anemia. Arch. Pathol. Lab. Med. 126, 452–455 (2002). · DOI
- Tourlakis, M. E. et al. In vivo senescence in the Sbds-deficient murine pancreas: cell-type specific consequences of translation insufficiency. PLoS Genet. 11, e1005288 (2015). · DOI · Paper page
- Zambetti, N. A. et al. Deficiency of the ribosome biogenesis gene Sbds in hematopoietic stem and progenitor cells causes neutropenia in mice by attenuating lineage progression in myelocytes. Haematologica 100, 1285–1293 (2015). · DOI
- Xia, J. et al. Somatic mutations and clonal hematopoiesis in congenital neutropenia. Blood 131, 408–416 (2018). · DOI
- Kandoth, C. et al. Mutational landscape and significance across 12 major cancer types. Nature 502, 333–339 (2013). · DOI · Paper page
- Gerstung, M. et al. The evolutionary history of 2,658 cancers. Nature 578, 122–128 (2020). · DOI · Paper page
- Kuhn, E. et al. TP53 mutations in serous tubal intraepithelial carcinoma and concurrent pelvic high-grade serous carcinoma–evidence supporting the clonal relationship of the two lesions. J. Pathol. 226, 421–426 (2012). · DOI
- Folkins, A. K. et al. A candidate precursor to pelvic serous cancer (p53 signature) and its prevalence in ovaries and fallopian tubes from women with BRCA mutations. Gynecol. Oncol. 109, 168–173 (2008). · DOI
- Fearon, E. R. & Vogelstein, B. A genetic model for colorectal tumorigenesis. Cell 61, 759–767 (1990). · DOI · Paper page
- Mercuri, A. et al. Immunophenotypic analysis of hematopoiesis in patients suffering from Shwachman–Bodian–Diamond syndrome. Eur. J. Haematol. 95, 308–315 (2015). · DOI
- Grinfeld, J. et al. Classification and personalized prognosis in myeloproliferative neoplasms. N. Engl. J. Med. 379, 1416–1430 (2018). · DOI
- Myers, K. C. et al. Myelodysplastic syndrome and acute myeloid leukemia in patients with Shwachman Diamond syndrome: a multicentre, retrospective, cohort study. Lancet Haematol. 7, e238–e246 (2020). · DOI
- Steele, C. D. et al. Signatures of copy number alterations in human cancer. Nature 606, 984–991 (2022). · DOI
- Light, N. et al. Germline TP53 mutations undergo copy number gain years prior to tumor diagnosis. Nat. Commun. 14, 77 (2023). · DOI
- Abascal, F. et al. Somatic mutation landscapes at single-molecule resolution. Nature 593, 405–410 (2021). · DOI · Paper page
- Machado, H. E. et al. Diverse mutational landscapes in human lymphocytes. Nature 608, 724–732 (2022). · DOI · Paper page
- Alexandrov, L. B. et al. Signatures of mutational processes in human cancer. Nature 500, 415–421 (2013). · DOI · Paper page
- Alexandrov, L. B. et al. The repertoire of mutational signatures in human cancer. Nature 578, 94–101 (2020). · DOI · Paper page
- Wong, C. C., Traynor, D., Basse, N., Kay, R. R. & Warren, A. J. Defective ribosome assembly in Shwachman-Diamond syndrome. Blood 118, 4305–4312 (2011). · DOI
- Jaiswal, S. et al. Age-related clonal hematopoiesis associated with adverse outcomes. N. Engl. J. Med. 371, 2488–2498 (2014). · DOI · Paper page
- van Zeventer, I. A. et al. Evolutionary landscape of clonal hematopoiesis in 3,359 individuals from the general population. Cancer Cell 41, 1017–1031.e4 (2023). · DOI · Paper page
- Hecker, J. S. et al. CHIP and hips: clonal hematopoiesis is common in patients undergoing hip arthroplasty and is associated with autoimmune disease. Blood 138, 1727–1732 (2021). · DOI · Paper page
- Mayerhofer, C. et al. Clonal hematopoiesis in older patients with breast cancer receiving chemotherapy. J. Natl Cancer Inst. 115, 981–988 (2023). · DOI
- Cao, B. et al. Cancer-mutated ribosome protein L22 (RPL22/eL22) suppresses cancer cell survival by blocking p53-MDM2 circuit. Oncotarget 8, 90651–90661 (2017). · DOI
- Arzalluz-Luque, Á. et al. Mutant PRPF8 causes widespread splicing changes in spliceosome components in retinitis pigmentosa patient iPSC-derived RPE cells. Front. Neurosci. 15, 636969 (2021). · DOI
- Zemp, I. et al. CK1δ and CK1ε are components of human 40S subunit precursors required for cytoplasmic 40S maturation. J. Cell Sci. 127, 1242–1253 (2014).
- Ameur, A., Kloosterman, W. P. & Hestand, M. S. Single-molecule sequencing: towards clinical applications. Trends Biotechnol. 37, 72–85 (2019). · DOI
- Papaemmanuil, E. et al. Genomic classification and prognosis in acute myeloid leukemia. N. Engl. J. Med. 374, 2209–2221 (2016). · DOI · Paper page
- Gerstung, M. et al. Precision oncology for acute myeloid leukemia using a knowledge bank approach. Nat. Genet. 49, 332–340 (2017). · DOI
- Li, H. Aligning sequence reads, clone sequences and assembly contigs with BWA-MEM. https://doi.org/10.48550/arXiv.1303.3997 (2013). · DOI
- Li, H. & Durbin, R. Fast and accurate short read alignment with Burrows-Wheeler transform. Bioinformatics 25, 1754–1760 (2009). · DOI · Paper page
- Jones, D. et al. cgpCaVEManWrapper: simple execution of CaVEMan in order to detect somatic single nucleotide variants in NGS data. Curr. Protoc. Bioinforma. 56, 15.10.1–15.10.18 (2016). · DOI
- Ellis, P. et al. Reliable detection of somatic mutations in solid tissues by laser-capture microdissection and low-input DNA sequencing. Nat. Protoc. 16, 841–871 (2021). · DOI
- Ye, K., Schulz, M. H., Long, Q., Apweiler, R. & Ning, Z. Pindel: a pattern growth approach to detect break points of large deletions and medium sized insertions from paired-end short reads. Bioinformatics 25, 2865–2871 (2009). · DOI
- Loo, P. V. et al. Allele-specific copy number analysis of tumors. PNAS 107, 16910–16915 (2010). · DOI
- Hoang, D. T. et al. MPBoot: fast phylogenetic maximum parsimony tree inference and bootstrap approximation. BMC Evolut. Biol. 18, 11 (2018). · DOI
- Martincorena, I. et al. Universal patterns of selection in cancer and somatic tissues. Cell 171, 1029–1041.e21 (2017). · DOI · Paper page
- Gori, K. & Baez-Ortega, A. sigfit: flexible Bayesian inference of mutational signatures. bioRxiv 372896 https://doi.org/10.1101/372896 (2020). · DOI
Cited by
A scalable in vitro cell competition model identifies preleukemic super competitor clones
Cabrera-Cosme, L., Rubio-Lara, J. A., Bennett, E., Miłek, J., Baldreki, C., Dowle, A., Vijayabaskar, M. S., Davies, S. J., Taylor-Smith, E., Bain, F. M., et al. (2026) · doi:10.64898/2026.10.21.760611
Self-citation
Metadata
- Authors
- Machado, H. E., Øbro, N. F., Williams, N., Tan, S., Boukerrou, A. Z., Davies, M., Belmonte, M., Mitchell, E., Baxter, E. J., Mende, N., Clay, A., Ancliff, P., Köglmeier, J., Killick, S. B., Kulasekararaj, A., Meyer, S., Laurenti, E., Campbell, P. J., Kent, D. G., Nangalia, J., & Warren, A. J.
- ORCID
- Venue
- Nature Communications
- Published
- 2023-08-22
- Volume
- 14
- Issue
- 1
- ISSN
- 2041-1723
- PMC
- PMC10444798
- Cited by
- 26
- References
- 12
- Language
- en
About these checks
Registry, retraction, Cites and statistics results are computed, not judged, with one exception: a printed reference that no index lists is read once by a model before it counts as a citation error. Claims are extracted by a model and kept only when their quote appears verbatim in the text; each cited source is then checked, with a model’s help, for whether it says what the claim relies on. Those verdicts can be wrong — read the claim’s quote and the cited source before relying on one.
Statistics and arithmetic are recomputed, not judged.
Confidence bands are shown only for fields calibrated on our annotated test set. None is calibrated yet, so no band is shown.
What counts as a claim ›How we measure confidence ›How we check this ›
Are you an author, or do you see a problem with this page? Request a review
