

The DOI matches its Crossref record; 70 of the 70 references it cites were found in a registry or an index.
Cell-free biosynthesis combined with deep learning accelerates de novo-development of antimicrobial peptides
Open accessPublished version of a preprint
Abstract
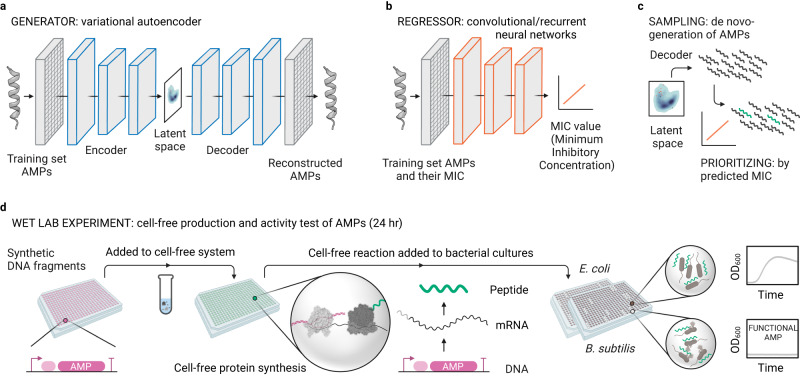
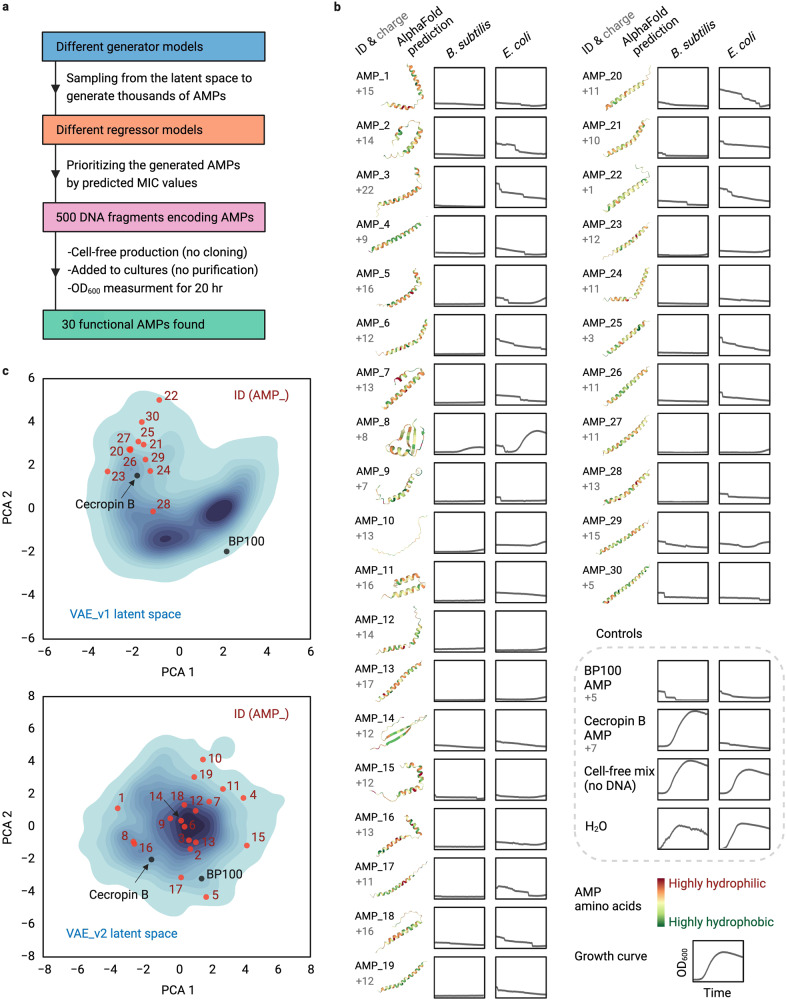
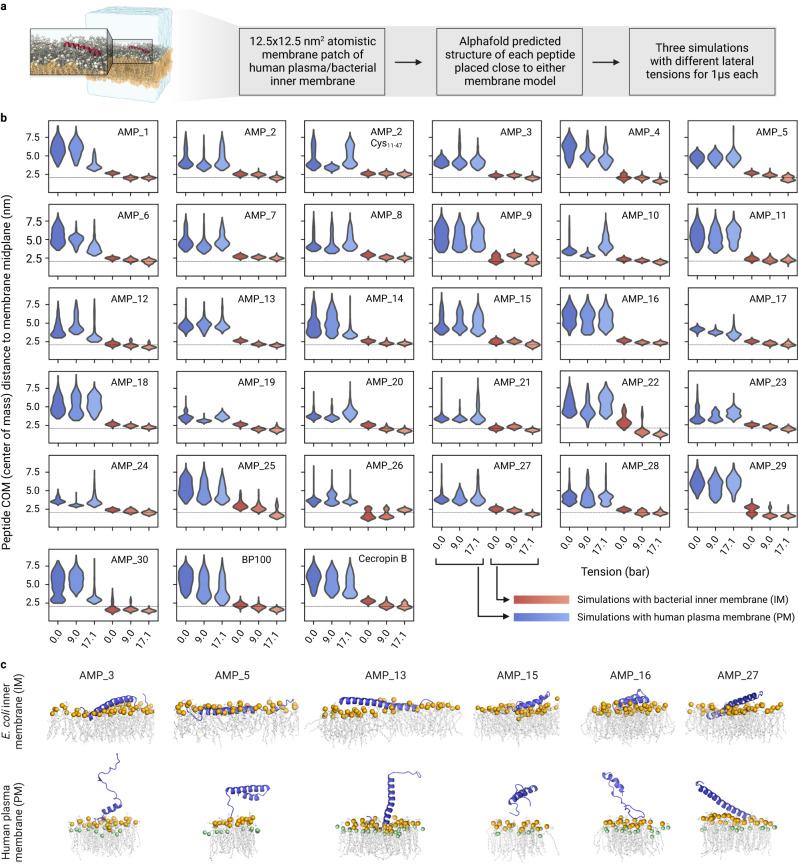
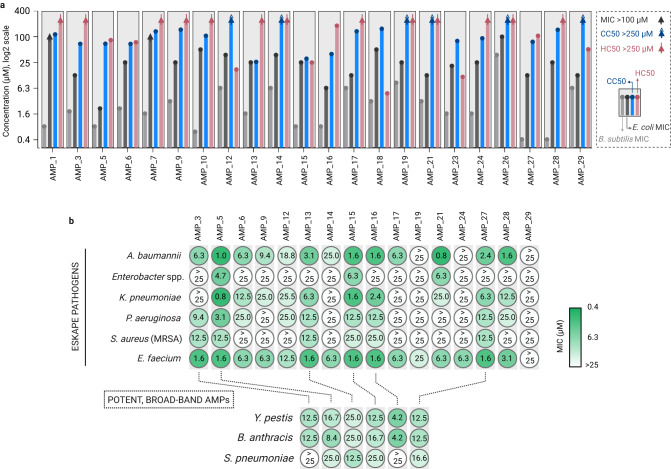
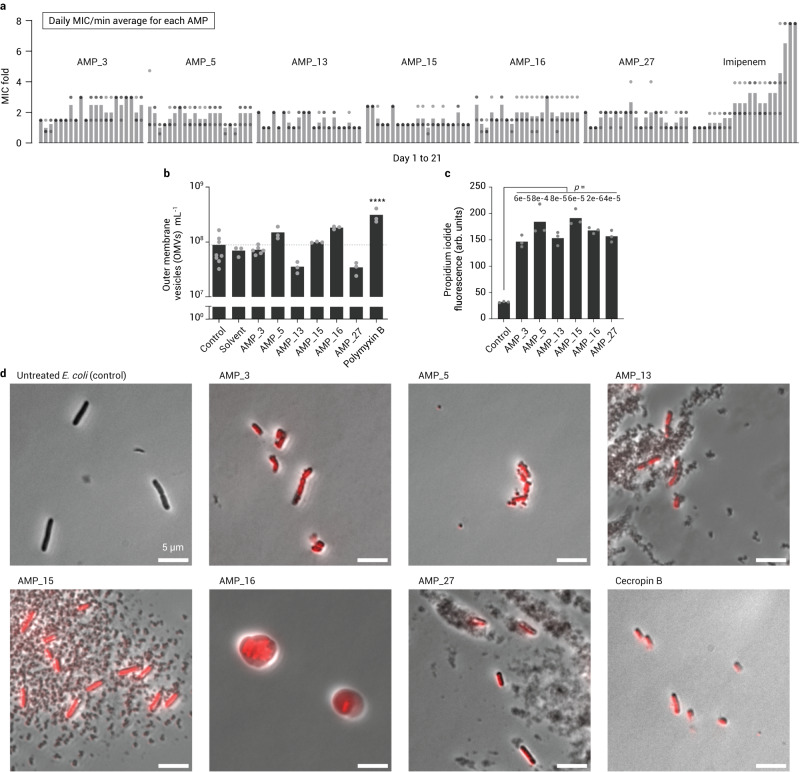
Bioactive peptides are key molecules in health and medicine. Deep learning holds a big promise for the discovery and design of bioactive peptides. Yet, suitable experimental approaches are required to validate candidates in high throughput and at low cost. Here, we established a cell-free protein synthesis (CFPS) pipeline for the rapid and inexpensive production of antimicrobial peptides (AMPs) directly from DNA templates. To validate our platform, we used deep learning to design thousands of AMPs de novo. Using computational methods, we prioritized 500 candidates that we produced and screened with our CFPS pipeline. We identified 30 functional AMPs, which we characterized further through molecular dynamics simulations, antimicrobial activity and toxicity. Notably, six de novo-AMPs feature broad-spectrum activity against multidrug-resistant pathogens and do not develop bacterial resistance. Our work demonstrates the potential of CFPS for high throughput and low-cost production and testing of bioactive peptides within less than 24 h.
Overview
The claims and statistics of this paper haven’t been checked yet.
Run the check — free, no account needed. It reads the open-access text and checks the sources it cites.
Integrity signals
Registry
Cites
Statistics
Figures
Verification
Claims the paper makes
The claims and statistics of this paper haven’t been checked yet.
Run the check — free, no account needed. It reads the open-access text and checks the sources it cites.
Self-check
Percentages, sums and reported differences re-computed from the paper’s own numbers.
The self-check needs the paper’s full text.
Citations
Cites
VMD: visual molecular dynamics
Humphrey, W., Dalke, A., & Schulten, K. (1996) · Journal of Molecular Graphics · doi:10.1016/0263-7855(96)00018-5 · Cited by 66,952
Highly accurate protein structure prediction with AlphaFold
Jumper, J., Evans, R., Pritzel, A., Green, T., Figurnov, M., Ronneberger, O., Tunyasuvunakool, K., Bates, R., Žídek, A., Potapenko, A., et al. (2021) · Nature · doi:10.1038/s41586-021-03819-2 · Cited by 43,764
Comparison of simple potential functions for simulating liquid water
Jorgensen, W. L., Chandrasekhar, J., Madura, J., Impey, R., & Klein, M. (1983) · The Journal of Chemical Physics · doi:10.1063/1.445869 · Cited by 38,397
Molecular dynamics with coupling to an external bath
Berendsen, H. J. C., Postma, J. P. M., van Gunsteren, W. F., DiNola, A., & Haak, J. R. (1984) · The Journal of Chemical Physics · doi:10.1063/1.448118 · Cited by 31,057
Abraham, M. J., Murtola, T., Schulz, R., Páll, S., Smith, J. C., Hess, B., & Lindahl, E. (2015) · SoftwareX · doi:10.1016/j.softx.2015.06.001 · Cited by 27,190
A smooth particle mesh Ewald method
Essmann, U., Perera, L., Berkowitz, M., Darden, T., Lee, H.-C., & Pedersen, L. (1995) · The Journal of Chemical Physics · doi:10.1063/1.470117 · Cited by 21,378
Polymorphic transitions in single crystals: A new molecular dynamics method
Parrinello, M., & Rahman, A. (1981) · Journal of Applied Physics · doi:10.1063/1.328693 · Cited by 20,009
LINCS: A linear constraint solver for molecular simulations
Hess, B., Bekker, H., Berendsen, H. J. C., & Fraaije, J. G. E. M. (1997) · Journal of Computational Chemistry · doi:10.1002/(sici)1096-987x(199709)18:12 · Cited by 18,479
Canonical sampling through velocity rescaling
Bussi, G., Donadio, D., & Parrinello, M. (2007) · The Journal of Chemical Physics · doi:10.1063/1.2408420 · Cited by 18,327
Global burden of bacterial antimicrobial resistance in 2019: a systematic analysis
Murray, C. J. L., Ikuta, K. S., Sharara, F., Swetschinski, L., Robles Aguilar, G., Gray, A., Han, C., Bisignano, C., Rao, P., Wool, E., et al. (2022) · The Lancet · doi:10.1016/s0140-6736(21)02724-0 · Cited by 16,316
Research works printed but not linked: 1
- Konur, O. Handbook of Algal Science, Technology and Medicine (Academic Press, 2020).
Cited by
Sorted by citations
Artificial intelligence in drug development
Zhang, K., Yang, X., Wang, Y., Yu, Y., Huang, N., Li, G. L., Li, X., Wu, J. C., & Yang, S. (2025) · Nature Medicine · doi:10.1038/s41591-024-03434-4 · Cited by 585
Advances in antimicrobial peptides: From mechanistic insights to chemical modifications
Yang, R., Ma, X., Peng, F., Wen, J., Allahou, L. W., Williams, G. R., Knowles, J. C., & Poma, A. (2025) · Biotechnology Advances · doi:10.1016/j.biotechadv.2025.108570 · Cited by 131
Antimicrobial resistance crisis: could artificial intelligence be the solution?
Liu, G., Yu, D., Fan, M.-M., Zhang, X., Jin, Z., Tang, C. M., & Liu, X. (2024) · Military Medical Research · doi:10.1186/s40779-024-00510-1 · Cited by 138
Wang, J., Feng, J., Kang, Y., Pan, P., Ge, J., Wang, Y., Wang, M., Wu, Z., Zhang, X., Yu, J., et al. (2025) · Science Advances · doi:10.1126/sciadv.ads8932 · Cited by 125
A review on the screening methods for the discovery of natural antimicrobial peptides
Yang, B., Yang, H., Liang, J., Chen, J., Wang, C., Wang, Y., Wang, J., Luo, W., Deng, T., & Guo, J. (2024) · Journal of Pharmaceutical Analysis · doi:10.1016/j.jpha.2024.101046 · Cited by 110
Metadata
- Authors
- Pandi, A., Adam, D., Zare, A., Trinh, V. T., Schaefer, S. L., Burt, M., Klabunde, B., Bobkova, E., Kushwaha, M., Foroughijabbari, Y., Braun, P., Spahn, C., Preußer, C., Pogge von Strandmann, E., Bode, H. B., von Buttlar, H., Bertrams, W., Jung, A. L., Abendroth, F., Schmeck, B., Hummer, G., Vázquez, O., & Erb, T. J.
- Affiliations
- Max Planck Institute for Terrestrial Microbiology (DE)
- Philipps University of Marburg (DE)
- Max Planck Institute of Biophysics (DE)
- AgroParisTech (FR)
- Fraunhofer Institute for Translational Medicine and Pharmacology (DE)
- Goethe University Frankfurt (DE)
- German Center for Infection Research (DE)
- Corresponding author
- Pandi, Amir
- Erb, Tobias J.
- ORCID
- Pandi, Amir
- Zare, Amir
- Trinh, Van Tuan
- Schaefer, Stefan L.
- Klabunde, Björn
- Bobkova, Elizaveta
- Kushwaha, Manish
- Foroughijabbari, Yeganeh
- Braun, Peter
- Spahn, Christoph
- Preußer, Christian
- Bode, Helge B.
- von Buttlar, Heiner
- Bertrams, Wilhelm
- Jung, Anna Lena
- Abendroth, Frank
- Schmeck, Bernd
- Hummer, Gerhard
- Vázquez, Olalla
- Erb, Tobias J.
- Venue
- Nature Communications
- Published
- 2023-11-08
- Volume
- 14
- Issue
- 1
- Pages
- 7197-7197
- ISSN
- 2041-1723 (ISSN-L)
- PMC
- PMC10632401
- OpenAlex
- W4388492286
- Cited by
- 173
- References
- 69
- Citations by year
- 2026: 54 · 2025: 67 · 2024: 50 · 2023: 2
- FWCI
- 31.50
- Type
- journal article
- Language
- en
- Open access
- gold
- doi.org
- Locations
- Nature Communications (publishedVersion, cc-by)
- bioRxiv (Cold Spring Harbor Laboratory) (acceptedVersion, cc-by)
- PubMed Central (publishedVersion, cc-by)
- PubMed (publishedVersion)
- HAL (submittedVersion, other-oa)
- RePEc: Research Papers in Economics (submittedVersion)
- DOAJ (DOAJ: Directory of Open Access Journals) (submittedVersion, cc-by-sa)
- Fraunhofer-Publica (Fraunhofer-Gesellschaft) (submittedVersion)
- Funders
- Max-Planck-Gesellschaft
- European Molecular Biology Organization (ALTG 165-2020)
- Topics
- Life Sciences › Immunology and Microbiology › Microbiology › Antimicrobial Peptides and Activities
- Physical Sciences › Chemistry › Organic Chemistry › Chemical Synthesis and Analysis
- Life Sciences › Immunology and Microbiology › Applied Microbiology and Biotechnology › Microbial Natural Products and Biosynthesis
- Keywords
- antimicrobial peptides, cell-free protein synthesis, de novo peptide design, deep learning, bioactive peptides, multidrug-resistant pathogens, broad-spectrum antimicrobial activity, peptide toxicity, molecular dynamics simulation
- MeSH terms
- Deep Learning, Antimicrobial Peptides, DNA Replication, Protein Biosynthesis, Molecular Dynamics Simulation
About these checks
Registry, retraction, Cites and statistics results are computed, not judged, with one exception: a printed reference that no index lists is read once by a model before it counts as a citation error. Claims are extracted by a model and kept only when their quote appears verbatim in the text; each cited source is then checked, with a model’s help, for whether it says what the claim relies on. Those verdicts can be wrong — read the claim’s quote and the cited source before relying on one.
Statistics and arithmetic are recomputed, not judged.
Confidence bands are shown only for fields calibrated on our annotated test set. None is calibrated yet, so no band is shown.
What counts as a claim ›How we measure confidence ›How we check this ›
Are you an author, or do you see a problem with this page? Request a review
