

The DOI matches its Crossref record; 3 of the 3 references it cites were found in a registry or an index.
A computational toolbox for the assembly yield of complex and heterogeneous structures
Open accessPublished version of a preprint
Abstract
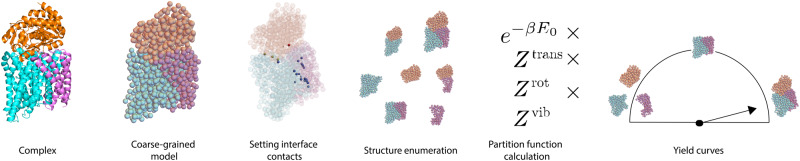
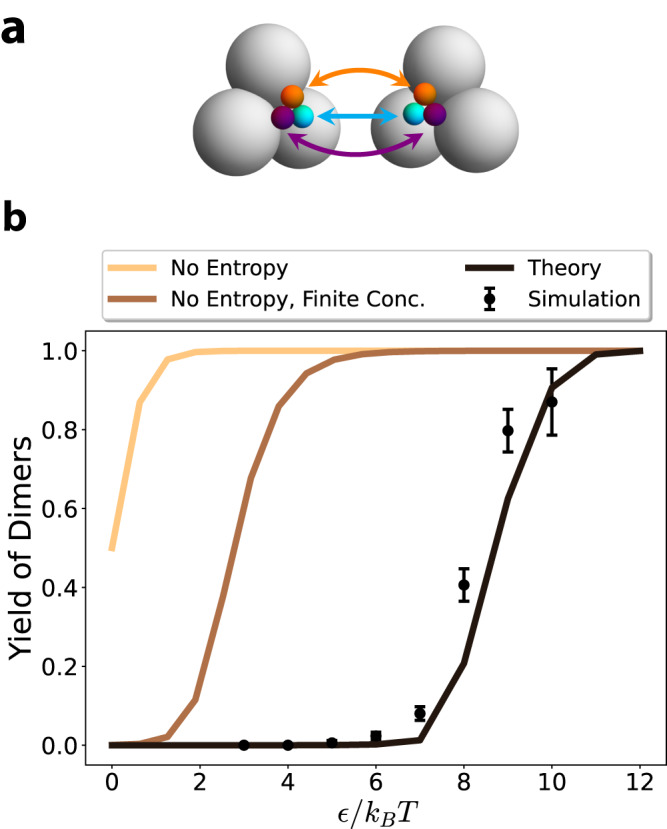
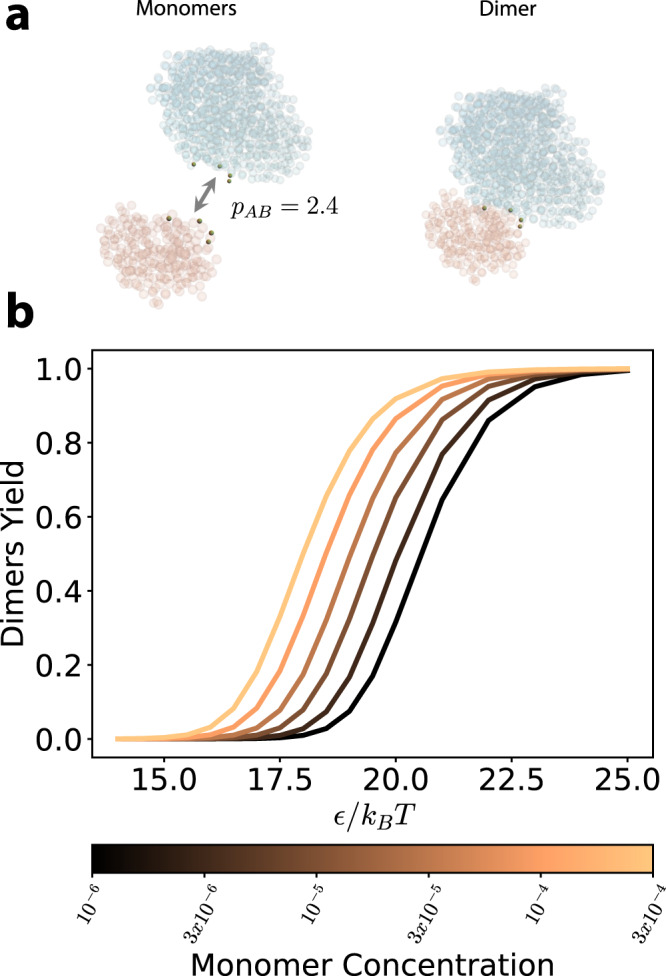
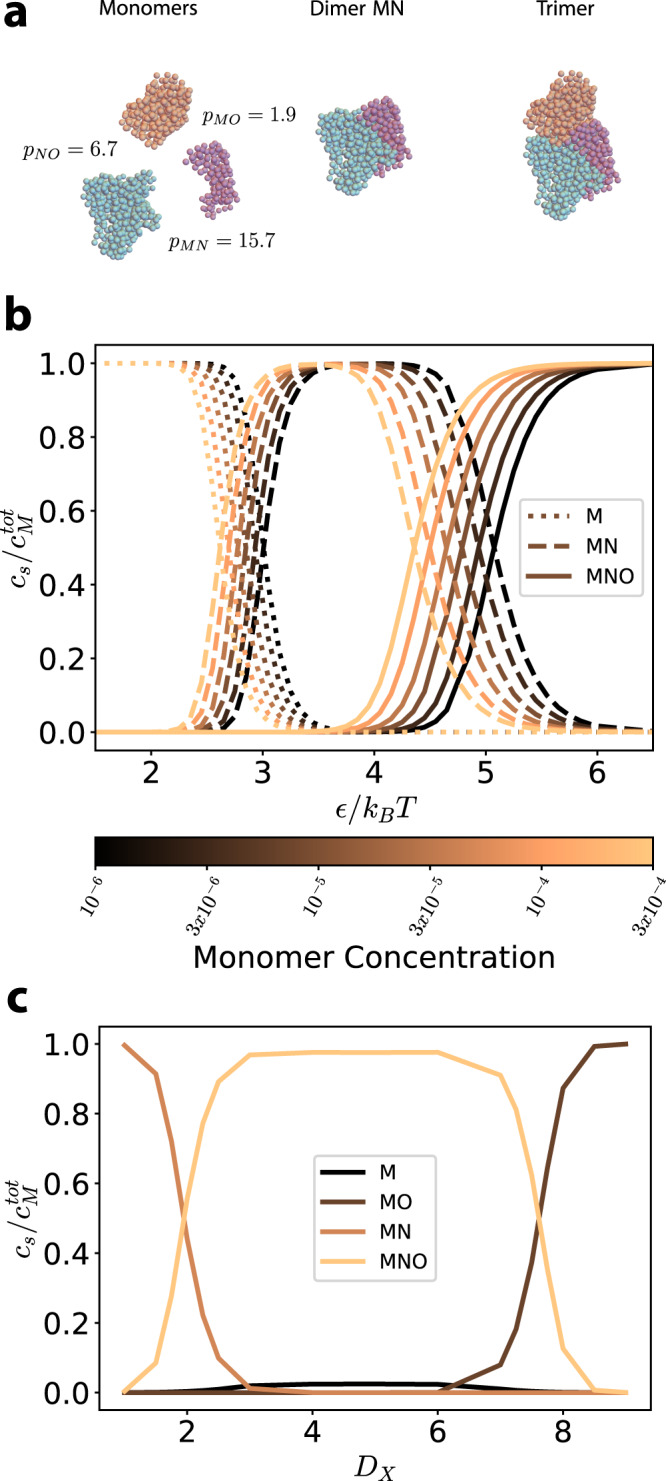
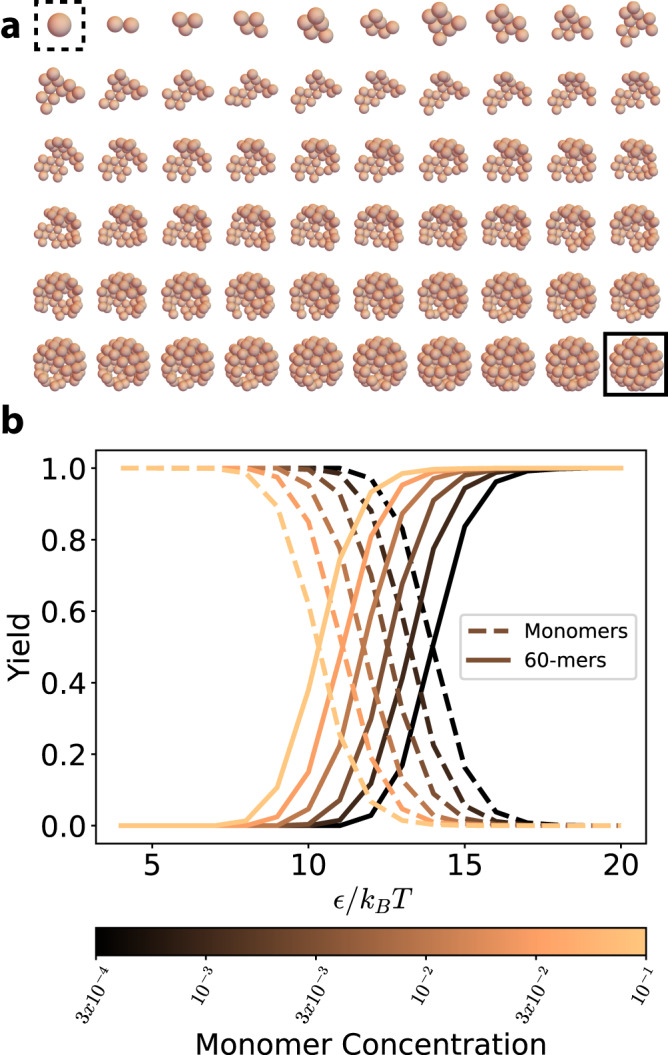
The self-assembly of complex structures from a set of non-identical building blocks is a hallmark of soft matter and biological systems, including protein complexes, colloidal clusters, and DNA-based assemblies. Predicting the dependence of the equilibrium assembly yield on the concentrations and interaction energies of building blocks is highly challenging, owing to the difficulty of computing the entropic contributions to the free energy of the many structures that compete with the ground state configuration. While these calculations yield well known results for spherically symmetric building blocks, they do not hold when the building blocks have internal rotational degrees of freedom. Here we present an approach for solving this problem that works with arbitrary building blocks, including proteins with known structure and complex colloidal building blocks. Our algorithm combines classical statistical mechanics with recently developed computational tools for automatic differentiation. Automatic differentiation allows efficient evaluation of equilibrium averages over configurations that would otherwise be intractable. We demonstrate the validity of our framework by comparison to molecular dynamics simulations of simple examples, and apply it to calculate the yield curves for known protein complexes and for the assembly of colloidal shells.
Overview
The claims and statistics of this paper haven’t been checked yet.
Run the check — free, no account needed. It reads the open-access text and checks the sources it cites.
Integrity signals
Registry
Cites
Statistics
Figures
Verification
Claims the paper makes
The claims and statistics of this paper haven’t been checked yet.
Run the check — free, no account needed. It reads the open-access text and checks the sources it cites.
Self-check
Percentages, sums and reported differences re-computed from the paper’s own numbers.
The self-check needs the paper’s full text.
Citations
Cites
Highly accurate protein structure prediction with AlphaFold
Jumper, J., Evans, R., Pritzel, A., Green, T., Figurnov, M., Ronneberger, O., Tunyasuvunakool, K., Bates, R., Žídek, A., Potapenko, A., et al. (2021) · Nature · doi:10.1038/s41586-021-03819-2 · Cited by 43,764
The coming of age of de novo protein design
Huang, P.-S., Boyken, S. E., & Baker, D. (2016) · Nature · doi:10.1038/nature19946 · Cited by 1,478
Advancement of the emerging field of RNA nanotechnology
Jasinski, D., Haque, F., Binzel, D. W., & Guo, P. (2017) · ACS Nano · doi:10.1021/acsnano.6b05737 · Cited by 352
Research works printed but not linked: 52
- Mirkin, C. A., Letsinger, R. L., Mucic, R. C. & Storhoff, J. J. A DNA-based method for rationally assembling nanoparticles into macroscopic materials. Nature 382, 3 (1996). · DOI
- Wei, B., Dai, M. & Yin, P. Complex shapes self-assembled from single-stranded DNA tiles. Nature 485, 623 (2012). · DOI
- Ke, Y., Ong, L. L., Shih, W. M. & Yin, P. Three-dimensional structures self-assembled from DNA bricks. Science 338, 1177 (2012). · DOI
- King, N. P. et al. Computational design of self-assembling protein nanomaterials with atomic level accuracy. Science 828, 1171 (2012). · DOI
- Lai, Y. T., King, N. P. & Yeates, T. O. Principles for designing ordered protein assemblies. Trends Cell Biol. 22, 653 (2012). · DOI
- Niu, R. et al. Magnetic handshake materials as a scale-invariant platform for programmed self-assembly. Proc. Natl Acad. Sci. USA 116, 24402 (2019). · DOI
- Sánchez-Iglesias, A. et al. Hydrophobic interactions modulate self-assembly of nanoparticles. ACS Nano 6, 11059 (2012). · DOI
- Law, A. D., Auriol, M., Smith, D., Horozov, T. S. & Buzza, D. M. A. Self-assembly of two-dimensional colloidal clusters by tuning the hydrophobicity, composition, and packing geometry. Phys. Rev. Lett. 110, 1 (2013). · DOI
- Sacanna, S., Irvine, W. T., Chaikin, P. M. & Pine, D. J. Lock and key colloids. Nature 464, 575 (2010). · DOI
- Sacanna, S. & Pine, D. J. Shape-anisotropic colloids: building blocks for complex assemblies. Curr. Opin. Colloid Interface Sci. 16, 96 (2011). · DOI
- Hormoz, S. & Brenner, M. P. Design principles for self-assembly with short-range interactions. Proc. Natl Acad. Sci. USA 108, 5193 (2011). · DOI
- Zhang, J., Maslov, S. & Shakhnovich, E. I. Constraints imposed by non-functional protein-protein interactions on gene expression and proteome size. Mol. Syst. Biol. 4, 1 (2008). · DOI
- Johnson, M. E. & Hummer, G. Nonspecific binding limits the number of proteins in a cell and shapes their interaction networks. Proc. Natl Acad. Sci. USA 108, 603 (2011). · DOI
- Zeravcic, Z., Manoharan, V. N. & Brenner, M. P. Size limits of self-assembled colloidal structures made using specific interactions. Proc. Natl Acad. Sci. USA 111, 15918 (2014). · DOI
- Murugan, A., Zou, J. & Brenner, M. P. Undesired usage and the robust self-assembly of heterogeneous structures. Nat. Commun. 6, 1 (2015). · DOI
- Glotzer, S. C., Solomon, M. J. & Kotov, N. A. Self-assembly: from nanoscale to microscale colloids. AIChE J. 50, 2978 (2004). · DOI
- Klein, E. D., Perry, R. W. & Manoharan, V. N. Physical interpretation of the partition function for colloidal clusters. Phys. Rev. E 98, 1 (2018). · DOI
- Margossian, C. C. A review of automatic differentiation and its efficient implementation. Wiley Interdiscip. Rev. Data Mining Knowl. Discov. 9, e1305 (2019). · DOI
- Baydin, A. G., Pearlmutter, B. A., Radul, A. A. & Siskind, J. M. Automatic differentiation in machine learning: a survey. J. Mach. Learn. Res. 18, 1 (2018).
- Gebremedhin, A. H. & Walther, A. An introduction to algorithmic differentiation. Wiley Interdiscip. Rev. Data Mining Knowl. Discov. 10, e1334 (2020). · DOI
- Frostig, R., Johnson, M. J. & Leary, C. Compiling machine learning programs via high-level tracing. SysML https://doi.org/10.1016/j.agrformet.2015.03.011 (2018). · DOI
- Franke, G., Hilf, E. R. & Borrmann, P. The structure of small clusters: multiple normal-modes model. J. Chem. Phys. 98, 3496 (1993). · DOI
- Kardar, M. Statistical Physics of Particles (Cambridge University Press, 2007). · DOI · Paper page
- Holmes-Cerfon, M. C. Enumerating rigid sphere packings. SIAM Rev. 58, 229 (2016). · DOI
- Holmes-Cerfon, M., Gortler, S. J. & Brenner, M. P. A geometrical approach to computing free-energy landscapes from short-ranged potentials. Proc. Natl Acad. Sci. USA 110, E5 (2013). · DOI
- Butler, R. W. Saddlepoint Approximations with Applications (Cambridge University Press, 2007). · DOI
- Perez-Sala, X., Igual, L., Escalera, S. & Angulo, C. Uniform sampling of rotations for discrete and continuous learning of 2D shape models. In Robotic Vision: Technologies for Machine Learning and Vision Applications 23–42 (IGI Global, 2012). · DOI
- Ouldridge, T. E., Louis, A. A. & Doye, J. P. Extracting bulk properties of self-assembling systems from small simulations. J. Phys. Condens. Matter 22, 104102 (2010). · DOI
- De Jong, D. H. et al. Determining equilibrium constants for dimerization reactions from molecular dynamics simulations. J. Comput. Chem. 32, 1919 (2011). · DOI
- Ouldridge, T. E. Inferring bulk self-assembly properties from simulations of small systems with multiple constituent species and small systems in the grand canonical ensemble. J. Chem. Phys. 137, 144105 (2012). · DOI
- Anderson, J. A., Glaser, J. & Glotzer, S. C. Hoomd-blue: a python package for high-performance molecular dynamics and hard particle monte carlo simulations. Comput. Mater. Sci. 173, 109363 (2020). · DOI
- Ovchinnikov, S., Kamisetty, H. & Baker, D. Robust and accurate prediction of residue-residue interactions across protein interfaces using evolutionary information. eLife 3, e02030 (2014). · DOI · Paper page
- Rohl, C. A., Strauss, C. E. M., Misura, K. M. S. & Baker, D. Protein structure prediction using Rosetta. Methods Enzymol. 383, 66 (2004). · DOI
- Senior, A. W. et al. Improved protein structure prediction using potentials from deep learning. Nature 577, 706 (2020). · DOI · Paper page
- Xu, J. Distance-based protein folding powered by deep learning. Proc. Natl Acad. Sci. USA 116, 16856 (2019). · DOI · Paper page
- Saito, Y. et al. Machine-learning-guided mutagenesis for directed evolution of fluorescent proteins. ACS Synth. Biol. 7, 2014 (2018). · DOI
- Schmiedel, J. M. & Lehner, B. Determining protein structures using deep mutagenesis. Nat. Genet. 51, 1177 (2019). · DOI
- Sayous, V., Lubrano, P., Li, Y. & Acevedo-Rocha, C. G. Unbiased libraries in protein directed evolution. Biochim. Biophys. Acta Proteins Proteomics 1868, 140321 (2020). · DOI
- Marcandalli, J. et al. Induction of potent neutralizing antibody responses by a designed protein nanoparticle vaccine for respiratory syncytial virus. Cell 176, 1420 (2019). · DOI
- Boyoglu-Barnum, S. et al. Elicitation of broadly protective immunity to influenza by multivalent hemagglutinin nanoparticle vaccines. Preprint at bioRxiv https://doi.org/10.1101/2020.05.30.125179 (2020). · DOI
- Walls, A. C. et al. Elicitation of potent neutralizing antibody responses by designed protein nanoparticle vaccines for SARS-CoV-2. Cell 183, 1367 (2020). · DOI · Paper page
- Bryant, D. H. et al. Deep diversification of an AAV capsid protein by machine learning, Nat. Biotechnol. https://doi.org/10.1038/s41587-020-00793-4 (2021). · DOI
- Chidchob, P. & Sleiman, H. F. Recent advances in DNA nanotechnology. Curr. Opin. Chem. Biol. 46, 63 (2018). · DOI
- Bermeo, S. et al. De novo design of obligate ABC-type heterotrimeric proteins. Nat. Struct. Mol. Biol. 29, 1266–1276 (2022). · DOI
- Frenkel, D. Simulations: the dark side. Eur. Phys. J. Plus 128, 1 (2013). · DOI
- Blondel, M. et al. Efficient and modular implicit differentiation. Adv. Neural Inf. Process. Syst. 35, 5230 (2022).
- Huang, P. S., Boyken, S. E. & Baker, D. The coming of age of de novo protein design. Nature 537, 320 (2016). · DOI · Paper page
- Xue, L. C., Rodrigues, J. P., Kastritis, P. L., Bonvin, A. M. & Vangone, A. Prodigy: a web server for predicting the binding affinity of protein–protein complexes. Bioinformatics 32, 3676 (2016). · DOI
- Raucci, R., Laine, E. & Carbone, A. Local interaction signal analysis predicts protein-protein binding affinity. Structure 26, 905 (2018). · DOI
- Cates, M. E. & Manoharan, V. N. Celebrating Soft Matter’s 10th anniversary: testing the foundations of classical entropy: colloid experiments. Soft Matter 11, 6538 (2015). · DOI
- Mukhopadhyay, R., Huang, K. C. & Wingreen, N. S. Lipid localization in bacterial cells through curvature-mediated microphase separation. Biophys. J. 95, 1034 (2008). · DOI
- Güneş Baydin, A., Pearlmutter, B. A., Andreyevich Radul, A. & Mark Siskind, J. Automatic differentiation in machine learning: a survey. J. Mach. Learn. Res. 18, 1 (2018).
Metadata
- Authors
- Curatolo, A. I., Kimchi, O., Goodrich, C. P., Krueger, R. K., & Brenner, M. P.
- Affiliations
- Harvard University (US)
- Princeton University (US)
- Institute of Science and Technology Austria (AT)
- Corresponding author
- Brenner, Michael P.
- Venue
- Nature Communications
- Published
- 2023-12-14
- Volume
- 14
- Issue
- 1
- Pages
- 8328-8328
- ISSN
- 2041-1723 (ISSN-L)
- PMC
- PMC10721878
- OpenAlex
- W4389726621
- Cited by
- 15
- References
- 3
- Citations by year
- 2026: 7 · 2025: 5 · 2024: 2 · 2023: 1
- FWCI
- 0.96
- Type
- journal article
- Language
- en
- Open access
- gold
- doi.org
- Locations
- Nature Communications (publishedVersion, cc-by)
- bioRxiv (Cold Spring Harbor Laboratory) (acceptedVersion, cc-by)
- Research Square (acceptedVersion, cc-by)
- PubMed Central (publishedVersion, cc-by)
- PubMed (publishedVersion)
- RePEc: Research Papers in Economics (submittedVersion)
- DOAJ (DOAJ: Directory of Open Access Journals) (submittedVersion, cc-by-sa)
- Funders
- United States Department of Defense | United States Navy | Office of Naval Research (N00014-17- 1-3029, N00014-17- 1-3029,)
- Simons Foundation (Investigator Award)
- National Science Foundation (PHY-1734030)
- Topics
- Physical Sciences › Materials Science › Biomaterials › Supramolecular Self-Assembly in Materials
- Life Sciences › Biochemistry, Genetics and Molecular Biology › Molecular Biology › Protein Structure and Dynamics
- Physical Sciences › Chemistry › Physical and Theoretical Chemistry › Advanced Physical and Chemical Molecular Interactions
- Keywords
- self-assembly, assembly yield, entropic contribution, free energy, automatic differentiation, protein complexes, colloidal clusters, statistical mechanics
About these checks
Registry, retraction, Cites and statistics results are computed, not judged, with one exception: a printed reference that no index lists is read once by a model before it counts as a citation error. Claims are extracted by a model and kept only when their quote appears verbatim in the text; each cited source is then checked, with a model’s help, for whether it says what the claim relies on. Those verdicts can be wrong — read the claim’s quote and the cited source before relying on one.
Statistics and arithmetic are recomputed, not judged.
Confidence bands are shown only for fields calibrated on our annotated test set. None is calibrated yet, so no band is shown.
What counts as a claim ›How we measure confidence ›How we check this ›
Are you an author, or do you see a problem with this page? Request a review
