

Seismic arrival-time picking on distributed acoustic sensing data using semi-supervised learning
Open accessPublished version of a preprint
The DOI matches its Crossref record; 81 of the 81 references it cites were found in a registry or an index.
Abstract
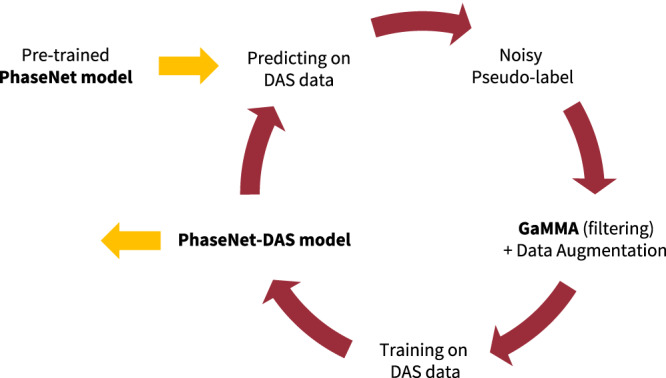
Distributed Acoustic Sensing (DAS) is an emerging technology for earthquake monitoring and subsurface imaging. However, its distinct characteristics, such as unknown ground coupling and high noise level, pose challenges to signal processing. Existing machine learning models optimized for conventional seismic data struggle with DAS data due to its ultra-dense spatial sampling and limited manual labels. We introduce a semi-supervised learning approach to address the phase-picking task of DAS data. We use the pre-trained PhaseNet model to generate noisy labels of P/S arrivals in DAS data and apply the Gaussian mixture model phase association (GaMMA) method to refine these noisy labels and build training datasets. We develop PhaseNet-DAS, a deep learning model designed to process 2D spatio-temporal DAS data to achieve accurate phase picking and efficient earthquake detection. Our study demonstrates a method to develop deep learning models for DAS data, unlocking the potential of integrating DAS in enhancing earthquake monitoring.
Overview
The claims and statistics of this paper haven’t been checked yet.
Free: it reads the open-access text and checks the first 5 claims that cite a source we can check. Create a free account to check every claim.
Integrity signals
Registry
Cites
Statistics
Figures



Verification
Claims the paper makes
The claims and statistics of this paper haven’t been checked yet.
Free: it reads the open-access text and checks the first 5 claims that cite a source we can check. Create a free account to check every claim.
Self-check
Percentages, sums and reported differences re-computed from the paper’s own numbers.
The self-check needs the paper’s full text.
Citations
Cites
Vaswani, A., Shazeer, N., Parmar, N., Uszkoreit, J., Jones, L., Gomez, A. N., Kaiser, L., & Polosukhin, I. (2017) · arXiv · doi:10.48550/arxiv.1706.03762 · Cited by 120,404
Adam: A Method for Stochastic Optimization
Kingma, D. P., & Ba, J. (2014) · arXiv · doi:10.48550/arxiv.1412.6980 · Cited by 98,946
LeCun, Y., Bengio, Y., & Hinton, G. (2015) · Nature · doi:10.1038/nature14539 · Cited by 84,126
Swin Transformer: Hierarchical Vision Transformer using Shifted Windows
Liu, Z., Lin, Y., Cao, Y., Hu, H., Wei, Y., Zhang, Z., Lin, S., & Guo, B. (2021) · 2021 IEEE/CVF International Conference on Computer Vision (ICCV) · doi:10.1109/iccv48922.2021.00986 · Cited by 35,534
Rethinking the Inception Architecture for Computer Vision
Szegedy, C., Vanhoucke, V., Ioffe, S., Shlens, J., & Wojna, Z. (2016) · 2016 IEEE Conference on Computer Vision and Pattern Recognition (CVPR) · doi:10.1109/cvpr.2016.308 · Cited by 32,138
U-Net: Convolutional Networks for Biomedical Image SegmentationPreprint
Ronneberger, O., Fischer, P., & Brox, T. (2015) · arXiv (Cornell University) · doi:10.48550/arxiv.1505.04597 · Cited by 17,815
A survey on Image Data Augmentation for Deep Learning
Shorten, C., & Khoshgoftaar, T. M. (2019) · Journal of Big Data · doi:10.1186/s40537-019-0197-0 · Cited by 13,203 · cited 1×
“Data augmentation, such as superposing noise onto seismic events, can synthesize new training samples with noisy waveforms, significantly expand the training dataset, and improve model generalization on noisy DAS data and weak earthquake signals (Shorten & Khoshgoftaar, 2019; W. Zhu et al., 2020a).”
BackgroundDecoupled Weight Decay Regularization
Loshchilov, I., & Hutter, F. (2017) · arXiv · doi:10.48550/arxiv.1711.05101 · Cited by 12,522
Rethinking Atrous Convolution for Semantic Image Segmentation
Chen, L.-C., Papandreou, G., Schroff, F., & Adam, H. (2017) · arXiv · doi:10.48550/arxiv.1706.05587 · Cited by 7,517
Learning Deconvolution Network for Semantic Segmentation
Noh, H., Hong, S., & Han, B. (2015) · 2015 IEEE International Conference on Computer Vision (ICCV) · doi:10.1109/iccv.2015.178 · Cited by 4,422
Research works printed but not linked: 11
- Li, Z. & Zhan, Z. Pushing the limit of earthquake detection with distributed acoustic sensing and template matching: a case study at the brady geothermal field. Geophys. J. Int. 215, 1583–1593 (2018b). · DOI
- Zhu, W. & Beroza, G. C. PhaseNet: a deep-neural-network-based seismic arrival-time picking method. Geophys. J. Int. 216, 261–273 (2019).
- Su, J. et al. High resolution earthquake catalog building for the 21 May 2021 Yangbi, Yunnan, M S 6.4 earthquake sequence using deep-learning phase picker. Chin. J. Geophys. 64, 2647–2656 (2021).
- Wilding, J. D., Zhu, W., Ross, Z. E. & Jackson, J. M. The magmatic web beneath Hawai‘i. Science 0, eade5755 (2022).
- Hernández, Pablo D., Ramírez, Jaime A. & Soto, Marcelo A. Improving earthquake detection in fibre-optic distributed acoustic sensors using deep-learning and hybrid datasets. In 2022 European Conference on Optical Communication (ECOC) 1–4 (Optica Publishing Group, 2022).
- VanDecar, J. C. & Crosson, R. S. Determination of teleseismic relative phase arrival times using multi-channel cross-correlation and least squares. Bull. Seismol. Soc. Am. 80, 150–169 (1990).
- Zhu, W., Mousavi, S. M. & Beroza, G. C. Seismic signal augmentation to improve generalization of deep neural networks. Adv. Geophys. 61, 151–177 (2020). · DOI
- Luo, W., Li, Y., Urtasun, R. & Zemel, R. Understanding the effective receptive field in deep convolutional neural networks. In Advances in Neural Information Processing Systems (Curran Associates, Inc., 2016).
- Ioffe, S. & Szegedy, C. Batch normalization: accelerating deep network training by reducing internal covariate shift. In Proc. 32nd International Conference on Machine Learning 448–456 (PMLR, 2015).
- Glorot, X., Bordes, A. & Bengio, Y. Deep sparse rectifier neural networks. In Proc. 14h International Conference on Artificial Intelligence and Statistics 315–323 (JMLR Workshop and Conference Proceedings, 2011).
- Biondi, E., Wang, X., Williams, E. F. & Zhan, Z. Geolocalization of large-scale das channels using a GPS-tracked moving vehicle. Seismol. Soc. Am. 94, 318–330 (2023).
Cited by
Earthquake focal mechanisms with distributed acoustic sensing
Li, J., Zhu, W., Biondi, E., & Zhan, Z. (2023) · Nature Communications · doi:10.1038/s41467-023-39639-3 · Cited by 92
Self-citationAdaptive decentralized AI scheme for signal recognition of distributed sensor systems
Zhang, S.-X., Li, H., Fan, C., Zeng, Z., Xiong, C., Wu, J., Yan, Z., Liu, D., & Sun, Q. (2024) · Opto-Electronic Advances · doi:10.29026/oea.2024.240119 · Cited by 72
Earthquake Magnitude With DAS: A Transferable Data‐Based Scaling Relation
Yin, J., Zhu, W., Li, J., Biondi, E., Miao, Y., Spica, Z. J., Viens, L., Shinohara, M., Ide, S., Mochizuki, K., et al. (2023) · Geophysical Research Letters · doi:10.1029/2023gl103045 · Cited by 71
Self-citationAn upper-crust lid over the Long Valley magma chamber
Biondi, E., Zhu, W., Li, J., Williams, E., & Zhan, Z. (2023) · Science Advances · doi:10.1126/sciadv.adi9878 · Cited by 67
Self-citationReal-Data Testing of Distributed Acoustic Sensing for Offshore Earthquake Early Warning
Yin, J., Soto, M. A., Ramírez, J., Kamalov, V. F., Zhu, W., Husker, A. L., & Zhan, Z. (2023) · The Seismic Record · doi:10.1785/0320230018 · Cited by 50
Self-citation
Metadata
- Authors
- Zhu, W., Biondi, E., Li, J., Yin, J., Ross, Z. E., & Zhan, Z.
- Affiliations
- California Institute of Technology (US)
- Corresponding author
- Zhu, Weiqiang
- Venue
- Nature Communications
- Published
- 2023-12-11
- Volume
- 14
- Issue
- 1
- Pages
- 8192-8192
- ISSN
- 2041-1723 (ISSN-L)
- PMC
- PMC10713581
- OpenAlex
- W4389560491
- Semantic Scholar
- 7b31b15d90a8f92cf697bae7bc6c2eed19ea0f2c
- Cited by
- 130
- References
- 78
- Citations by year
- 2026: 53 · 2025: 44 · 2024: 30 · 2023: 3
- FWCI
- 12.25
- Type
- journal article
- Language
- en
- Open access
- gold
- doi.org
- Licence
- cc-by
- creativecommons.org/licenses/by/4.0 (tdm)
- creativecommons.org/licenses/by/4.0 (vor)
- Locations
- Nature Communications (publishedVersion, cc-by)
- PubMed Central (publishedVersion, cc-by)
- PubMed (publishedVersion)
- eScholarship (California Digital Library) (submittedVersion, cc-by)
- DOAJ (DOAJ: Directory of Open Access Journals) (submittedVersion, cc-by-sa)
- Funders
- National Science Foundation (1848166)
- Department of the Interior | United States Geological Survey | Wyoming-Montana Water Science Center (G22AP00067)
- Gordon and Betty Moore Foundation
- Topics
- Physical Sciences › Computer Science › Artificial Intelligence › Seismology and Earthquake Studies
- Physical Sciences › Earth and Planetary Sciences › Geophysics › Seismic Waves and Analysis
- Physical Sciences › Earth and Planetary Sciences › Geophysics › Seismic Imaging and Inversion Techniques
- Keywords
- distributed acoustic sensing, semi-supervised learning, PhaseNet, earthquake detection, seismic monitoring, ground coupling
About these checks
Registry, retraction, Cites and statistics results are computed, not judged, with one exception: a printed reference that no index lists is read once by a model before it counts as a citation error. Claims are extracted by a model and kept only when their quote appears verbatim in the text; each cited source is then checked, with a model’s help, for whether it says what the claim relies on. Those verdicts can be wrong — read the claim’s quote and the cited source before relying on one.
Statistics and arithmetic are recomputed, not judged.
Confidence bands are shown only for fields calibrated on our annotated test set. None is calibrated yet, so no band is shown.
What counts as a claim ›How we measure confidence ›How we check this ›
Are you an author, or do you see a problem with this page? Request a review
How to cite
Cite CoChat for the checks on this page, and the paper for its own findings.
- This page
- CoChat. (2026). Citation check: Seismic arrival-time picking on distributed acoustic sensing data using semi-supervised learning. https://app.cochat.ai/papers/10.1038/s41467-023-43355-3
- The paper
- Zhu, W., Biondi, E., Li, J., Yin, J., Ross, Z. E., & Zhan, Z. (2023). Seismic arrival-time picking on distributed acoustic sensing data using semi-supervised learning. Nature Communications. https://doi.org/10.1038/s41467-023-43355-3
Data sources
Bibliographic data: Semantic Scholar, OpenAlex, Crossref.
Contains information from the Semantic Scholar Academic Graph Datasets, made available under the ODC Attribution License (ODC-BY 1.0).
Semantic Scholar’s data is described in: Kinney, R., et al. (2023). The Semantic Scholar Open Data Platform. arXiv:2301.10140.
