Cited by 27Bacterial Genetics and BiotechnologyDrug Transport and Resistance MechanismsEscherichia coli research studies

The DOI matches its Crossref record; 3 of the 3 references it cites were found in a registry or an index.

Ton motor conformational switch and peptidoglycan role in bacterial nutrient uptake

Open access
Zinke, Maximilian, Lejeune, Maylis, Mechaly, Ariel, Bardiaux, Benjamin, Boneca, Ivo Gomperts, Delepelaire, Philippe, Izadi-Pruneyre, Nadia·2024·Nature Communications

Published version of a preprint

Abstract

Active nutrient uptake is fundamental for survival and pathogenicity of Gram-negative bacteria, which operate a multi-protein Ton system to transport essential nutrients like metals and vitamins. This system harnesses the proton motive force at the inner membrane to energize the import through the outer membrane, but the mechanism of energy transfer remains enigmatic. Here, we study the periplasmic domain of ExbD, a crucial component of the proton channel of the Ton system. We show that this domain is a dynamic dimer switching between two conformations representing the proton channel’s open and closed states. By in vivo phenotypic assays we demonstrate that this conformational switch is essential for the nutrient uptake by bacteria. The open state of ExbD triggers a disorder to order transition of TonB, enabling TonB to supply energy to the nutrient transporter. We also reveal the anchoring role of the peptidoglycan layer in this mechanism. Herein, we propose a mechanistic model for the Ton system, emphasizing ExbD duality and the pivotal catalytic role of peptidoglycan. Sequence analysis suggests that this mechanism is conserved in other systems energizing gliding motility and membrane integrity. Our study fills important gaps in understanding bacterial motor mechanism and proposes novel antibacterial strategies.

Overview

The claims and statistics of this paper haven’t been checked yet.

Run the check — free, no account needed. It reads the open-access text and checks the sources it cites.

A few free checks a day · papers already verified open instantly · results are public

Integrity signals

Registry

Crossref · 10.1038/s41467-023-44606-z

Cites

3 of 3 references verified0 citation errors · 0 not checkable

Statistics

Figures

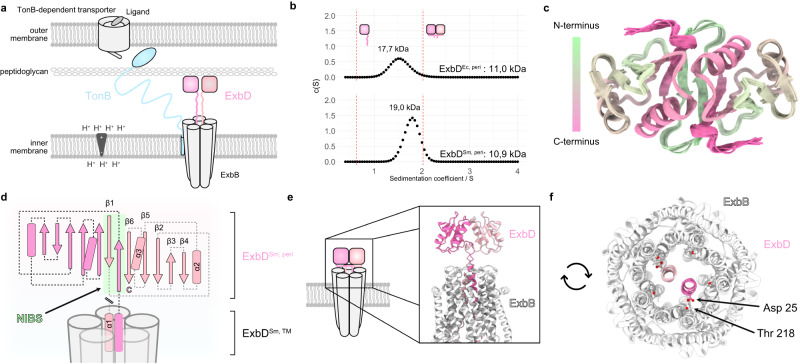
Fig. 1 The periplasmic domain of ExbD forms a homodimer. a The Ton system consists of an inner membrane proton channel – formed by ExbB (grey) and ExbD (pink) – and the periplasm spanning protein TonB (blue). The latter links the system to a TonB-dependent transporter in the outer membrane. The globular C-terminal domain of ExbD (pink boxes) is connected to its helical N-terminus, which is inserted into the ExbB channel, by a disordered region (pink, wiggly lines). b Sedimentation coefficient distribution obtained from analytical ultracentrifugation of ExbDSm, peri and ExbDEc, peri indicates that both proteins exist in a dimeric state at physiological pH. The red dashed lines represent estimated sedimentation coefficients for monomeric ExbD and dimeric ExbD as depicted by the cartoons (pink). The sedimentation coefficient-derived molecular weights of both species are indicated above. c The top view of the NMR structure ensemble of dimeric ExbDSm, peri reveals that the N-terminal residues 44–49 (green) form an intermolecular β-sheet. d Homodimeric ExbDSm, peri consists of two monomers (pink and light pink), each with a β-sheet (arrows) and two α-helices (barrels). Part of the dimeric interface is formed by a swapped, intermolecular, and anti-parallel β-sheet called the N-terminal Intermolecular Beta-Strand (NIBS, green). The NIBS, composed of residues 44-49, connects the intramolecular β-sheets, creating a continuous β-sheet across the dimer interface. In the full-length protein, ExbDSm, peri is N-terminally connected to two α-helices (α1) that are embedded in the ExbB channel (grey). e Side view and f Top view of the AlphaFold2 model of the full ExbB-ExbD complex, generated using the NMR structure (PDB ID 8PEK structure of the dimeric, periplasmic domain of ExbD, this work) as a template. In this model, the dimeric organization of the periplasmic domain of ExbD (pink and light pink) imposes the alignment of its helices in similar positions and orientations, and locking both Asp 25 sidechains in hydrogen bonds with Thr 218 from ExbB. In the top view, the periplasmic domain of ExbD is not visible due to its location above the clipping plane. Source data are provided as a Source Data file.
Fig. 1 The periplasmic domain of ExbD forms a homodimer. a The Ton system consists of an inner membrane proton channel – formed by ExbB (grey) and ExbD (pink) – and the periplasm spanning protein TonB (blue). The latter links the system to a TonB-dependent transporter in the outer membrane. The globular C-terminal domain of ExbD (pink boxes) is connected to its helical N-terminus, which is inserted into the ExbB channel, by a disordered region (pink, wiggly lines). b Sedimentation coefficient distribution obtained from analytical ultracentrifugation of ExbDSm, peri and ExbDEc, peri indicates that both proteins exist in a dimeric state at physiological pH. The red dashed lines represent estimated sedimentation coefficients for monomeric ExbD and dimeric ExbD as depicted by the cartoons (pink). The sedimentation coefficient-derived molecular weights of both species are indicated above. c The top view of the NMR structure ensemble of dimeric ExbDSm, peri reveals that the N-terminal residues 44–49 (green) form an intermolecular β-sheet. d Homodimeric ExbDSm, peri consists of two monomers (pink and light pink), each with a β-sheet (arrows) and two α-helices (barrels). Part of the dimeric interface is formed by a swapped, intermolecular, and anti-parallel β-sheet called the N-terminal Intermolecular Beta-Strand (NIBS, green). The NIBS, composed of residues 44-49, connects the intramolecular β-sheets, creating a continuous β-sheet across the dimer interface. In the full-length protein, ExbDSm, peri is N-terminally connected to two α-helices (α1) that are embedded in the ExbB channel (grey). e Side view and f Top view of the AlphaFold2 model of the full ExbB-ExbD complex, generated using the NMR structure (PDB ID 8PEK structure of the dimeric, periplasmic domain of ExbD, this work) as a template. In this model, the dimeric organization of the periplasmic domain of ExbD (pink and light pink) imposes the alignment of its helices in similar positions and orientations, and locking both Asp 25 sidechains in hydrogen bonds with Thr 218 from ExbB. In the top view, the periplasmic domain of ExbD is not visible due to its location above the clipping plane. Source data are provided as a Source Data file.CC BY · PubMed Central
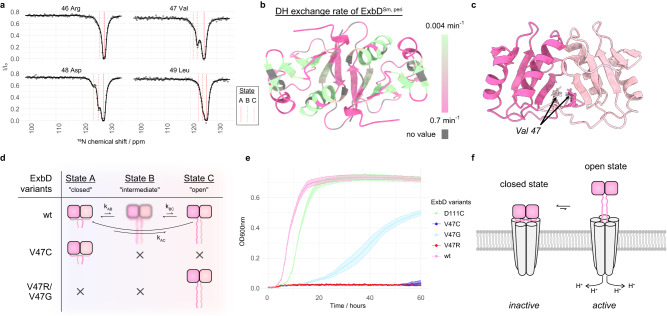
Fig. 2 The periplasmic domain of ExbD samples different conformational states. a 15N-Chemical exchange saturation transfer (CEST) profiles reveal a 3-state exchange of the NIBS in 15N-labeled ExbDSm, peri. The experimental data points and the least-square fit are represented by dots and solid lines, respectively. The fitted chemical shift values for states A, B, and C are indicated by red lines. Intensity ratios of NMR signals from residues 46 to 49 are shown. Peak intensities are plotted as mean values with error bars showing the standard deviation (SD), which quantifies the relative measurement error arising from noise in the NMR spectra. b Deuterium hydrogen (DH) exchange rates measured by NMR spectroscopy mapped onto the structure of ExbDSm, peri (fast exchange: pink, slow exchange: green, no value: grey) show that the NIBS undergoes faster amide proton exchange than adjacent β-strands, supporting the disordered nature of state C. c Side view of dimeric ExbDSm, peri where the monomeric units are colored in pink and light pink. The residue Val 47 is located at the dimer interface in the closed state. d Schematic representation of the exchange dynamics of the ExbD variants. Wild type (wt) ExbDSm, peri (pink) samples a major state A, and the minor states B and C. State A is characterized by a folded NIBS, while state C features a disordered NIBS. State B represents an intermediate state between these two extremes. The V47C mutant forms a disulfide bridge that locks ExbDSm, peri in the closed state, while the V47R and V47G mutants mainly yield the open state. The pink rectangles depict the protomers of ExbDSm, peri. The intertwined pink lines symbolize the folded NIBS in the closed state, while the wiggly lines illustrate the disordered NIBS in the open state. e Bacterial growth curves of ExbDSm, peri variants wt (pink), V47R (red), V47G (light blue), V47C (blue), and the control D111C (green). Under in vivo conditions that necessitate the activity of the Has system, these mutations substantially impact bacterial growth, emphasizing that not merely the individual states of ExbD, but the exchange between them, is vital for the system’s proper functioning. Each data point in the growth curves represents the mean of the optical density for each variant, measured in triplicate (n = 3 biologically independent experiments). Error bars denote the SD from these replicates. f In a schematic representation of the ExbB-ExbD complex, the ExbD dimer exchanges between a closed, main state and a sparsely populated open state. The transition between the states is characterized by the unfolding and refolding of the NIBS residues. Herein, only the open state might be permeable to protons. Source data are provided as a Source Data file.
Fig. 2 The periplasmic domain of ExbD samples different conformational states. a 15N-Chemical exchange saturation transfer (CEST) profiles reveal a 3-state exchange of the NIBS in 15N-labeled ExbDSm, peri. The experimental data points and the least-square fit are represented by dots and solid lines, respectively. The fitted chemical shift values for states A, B, and C are indicated by red lines. Intensity ratios of NMR signals from residues 46 to 49 are shown. Peak intensities are plotted as mean values with error bars showing the standard deviation (SD), which quantifies the relative measurement error arising from noise in the NMR spectra. b Deuterium hydrogen (DH) exchange rates measured by NMR spectroscopy mapped onto the structure of ExbDSm, peri (fast exchange: pink, slow exchange: green, no value: grey) show that the NIBS undergoes faster amide proton exchange than adjacent β-strands, supporting the disordered nature of state C. c Side view of dimeric ExbDSm, peri where the monomeric units are colored in pink and light pink. The residue Val 47 is located at the dimer interface in the closed state. d Schematic representation of the exchange dynamics of the ExbD variants. Wild type (wt) ExbDSm, peri (pink) samples a major state A, and the minor states B and C. State A is characterized by a folded NIBS, while state C features a disordered NIBS. State B represents an intermediate state between these two extremes. The V47C mutant forms a disulfide bridge that locks ExbDSm, peri in the closed state, while the V47R and V47G mutants mainly yield the open state. The pink rectangles depict the protomers of ExbDSm, peri. The intertwined pink lines symbolize the folded NIBS in the closed state, while the wiggly lines illustrate the disordered NIBS in the open state. e Bacterial growth curves of ExbDSm, peri variants wt (pink), V47R (red), V47G (light blue), V47C (blue), and the control D111C (green). Under in vivo conditions that necessitate the activity of the Has system, these mutations substantially impact bacterial growth, emphasizing that not merely the individual states of ExbD, but the exchange between them, is vital for the system’s proper functioning. Each data point in the growth curves represents the mean of the optical density for each variant, measured in triplicate (n = 3 biologically independent experiments). Error bars denote the SD from these replicates. f In a schematic representation of the ExbB-ExbD complex, the ExbD dimer exchanges between a closed, main state and a sparsely populated open state. The transition between the states is characterized by the unfolding and refolding of the NIBS residues. Herein, only the open state might be permeable to protons. Source data are provided as a Source Data file.CC BY · PubMed Central
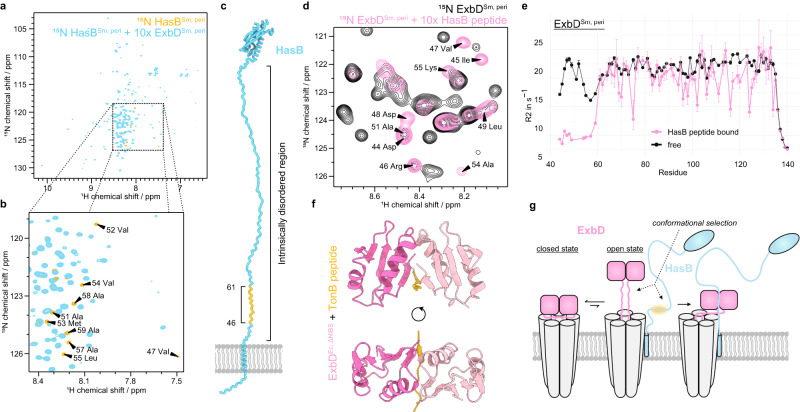
Fig. 3 The open state of the periplasmic domain of ExbD is conformationally selected upon binding to TonB/HasB. a, b 2D [1H-15N]-TROSY spectra of 15N-labeled HasBSm, peri alone (orange) and in the presence of unlabeled ExbDSm, peri (blue). The presence of ExbD leads to the disappearance (broadening) of the peaks corresponding to the residues 46-61 of HasBSm, peri indicating binding of this region to ExbD. c Model of HasB inserted in the inner membrane: The HasB-ExbD region of interaction (orange) is located in an intrinsically disordered region (IDR) of HasB (blue) close to the inner membrane inserted N-terminal α-helix. d 2D [1H-15N]-HMQC spectra of 15N-labeled ExbDSm, peri without (black) and with (pink) the HasB peptide (corresponding to the binding region on the HasB side). Binding of the peptide leads to signal intensity decrease and appearance of new peaks that can be assigned to the NIBS residues. e R2 relaxation rate measurements of the free (black) and HasB peptide bound state (pink) of 15N ExbDSm, peri reveal that the binding stabilizes the open state of ExbDSm, peri characterized by the disordered nature of the NIBS residues (lower relaxation rates). This suggests a conformational selection of the open state of ExbD. Data points represent mean R2 values obtained from fitting NMR data, with error bars reflecting the SD from Monte Carlo simulations performed for each residue, as detailed in the Methods. f Deletion of the NIBS residues of ExbDEc, peri allows for crystallization with a peptide corresponding to the binding region on the TonB side. Herein, the TonB peptide (orange) replaces the NIBS residues at the interface in between the two subunits of the ExbD dimer (pink, light pink). g Schematic mechanism: The open state of ExbD (pink, right side) is conformationally selected by TonB/HasB (blue) leading to a disorder-to-order transition of the IDR of TonB/HasB. The binding motif on the TonB/HasB side is highlighted in orange.
Fig. 3 The open state of the periplasmic domain of ExbD is conformationally selected upon binding to TonB/HasB. a, b 2D [1H-15N]-TROSY spectra of 15N-labeled HasBSm, peri alone (orange) and in the presence of unlabeled ExbDSm, peri (blue). The presence of ExbD leads to the disappearance (broadening) of the peaks corresponding to the residues 46-61 of HasBSm, peri indicating binding of this region to ExbD. c Model of HasB inserted in the inner membrane: The HasB-ExbD region of interaction (orange) is located in an intrinsically disordered region (IDR) of HasB (blue) close to the inner membrane inserted N-terminal α-helix. d 2D [1H-15N]-HMQC spectra of 15N-labeled ExbDSm, peri without (black) and with (pink) the HasB peptide (corresponding to the binding region on the HasB side). Binding of the peptide leads to signal intensity decrease and appearance of new peaks that can be assigned to the NIBS residues. e R2 relaxation rate measurements of the free (black) and HasB peptide bound state (pink) of 15N ExbDSm, peri reveal that the binding stabilizes the open state of ExbDSm, peri characterized by the disordered nature of the NIBS residues (lower relaxation rates). This suggests a conformational selection of the open state of ExbD. Data points represent mean R2 values obtained from fitting NMR data, with error bars reflecting the SD from Monte Carlo simulations performed for each residue, as detailed in the Methods. f Deletion of the NIBS residues of ExbDEc, peri allows for crystallization with a peptide corresponding to the binding region on the TonB side. Herein, the TonB peptide (orange) replaces the NIBS residues at the interface in between the two subunits of the ExbD dimer (pink, light pink). g Schematic mechanism: The open state of ExbD (pink, right side) is conformationally selected by TonB/HasB (blue) leading to a disorder-to-order transition of the IDR of TonB/HasB. The binding motif on the TonB/HasB side is highlighted in orange.CC BY · PubMed Central
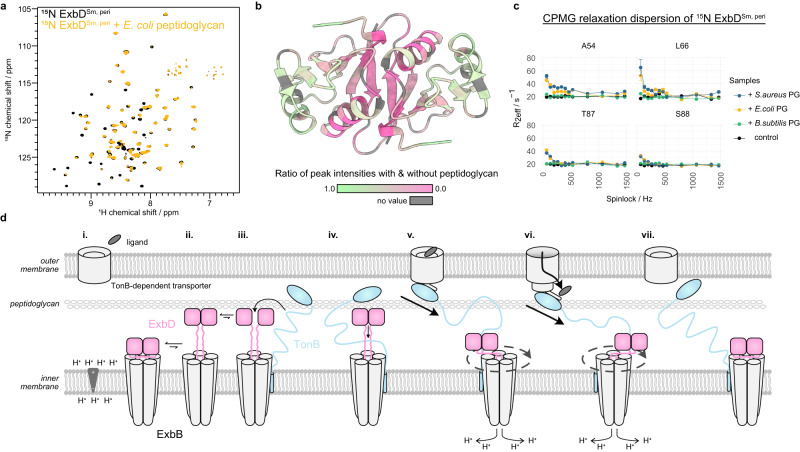
Fig. 4 The periplasmic domain of ExbD interacts with the peptidoglycan layer. a 2D [1H-15N]-TROSY spectra of 15N ExbDSm, peri without (black) and with (orange) E. coli peptidoglycan. The interaction of ExbDSm, peri with peptidoglycan leads to the disappearance (broadening) of peaks. b Mapping this peak intensity loss in terms of a peak height ratio (pink to green, grey color means no value) onto the dimeric ExbDSm, peri structure shows that the interface within the dimer experiences the largest increase in exchange contribution to the R2 relaxation rate upon interaction with peptidoglycan. This suggests that possibly the dimer dissociates upon interaction. c This increase in R2 relaxation rate due to exchange can be measured by Car-Purcell-Meiboom-Gill (CPMG) relaxation dispersion experiments and reveals that ExbDSm, peri selectively interacts with peptidoglycan from E. coli (orange), S. aureus (blue) – they all show decaying profiles – but not B. subtilis (green), which shows the same flat curve as the control experiment without peptidoglycan (black). Peak intensities are plotted as mean values with error bars showing the SD, which quantifies the relative measurement error arising from noise in the NMR spectra. d Schematic representation of the full mechanism. In the resting state in the absence of ligand (i.), closed ExbD (pink) is in exchange with a minor open conformation (ii.). This extended, open conformation can reach the peptidoglycan layer, in interaction with which its dimer interface is loosened (iii.). This allows TonB/HasB (blue) to enter in between the ExbD monomers (iv.) and to subsequently select the open state of ExbD by binding to it (v.). Also, the C-terminal domain of TonB/HasB interacts with a ligand (grey) bound TonB-dependent transporter (TBDT). Proton motive force induced rotation of ExbD within ExbB leads to a pulling through the IDR of TonB/HasB, opening the TBDT and enabling active transport of ligands (vi.). Eventually, the pulling force becomes too large and leads to the dissociation of TonB/HasB from the TBDT, and the return to the resting state of the system (vii.). Source data are provided as a Source Data file.
Fig. 4 The periplasmic domain of ExbD interacts with the peptidoglycan layer. a 2D [1H-15N]-TROSY spectra of 15N ExbDSm, peri without (black) and with (orange) E. coli peptidoglycan. The interaction of ExbDSm, peri with peptidoglycan leads to the disappearance (broadening) of peaks. b Mapping this peak intensity loss in terms of a peak height ratio (pink to green, grey color means no value) onto the dimeric ExbDSm, peri structure shows that the interface within the dimer experiences the largest increase in exchange contribution to the R2 relaxation rate upon interaction with peptidoglycan. This suggests that possibly the dimer dissociates upon interaction. c This increase in R2 relaxation rate due to exchange can be measured by Car-Purcell-Meiboom-Gill (CPMG) relaxation dispersion experiments and reveals that ExbDSm, peri selectively interacts with peptidoglycan from E. coli (orange), S. aureus (blue) – they all show decaying profiles – but not B. subtilis (green), which shows the same flat curve as the control experiment without peptidoglycan (black). Peak intensities are plotted as mean values with error bars showing the SD, which quantifies the relative measurement error arising from noise in the NMR spectra. d Schematic representation of the full mechanism. In the resting state in the absence of ligand (i.), closed ExbD (pink) is in exchange with a minor open conformation (ii.). This extended, open conformation can reach the peptidoglycan layer, in interaction with which its dimer interface is loosened (iii.). This allows TonB/HasB (blue) to enter in between the ExbD monomers (iv.) and to subsequently select the open state of ExbD by binding to it (v.). Also, the C-terminal domain of TonB/HasB interacts with a ligand (grey) bound TonB-dependent transporter (TBDT). Proton motive force induced rotation of ExbD within ExbB leads to a pulling through the IDR of TonB/HasB, opening the TBDT and enabling active transport of ligands (vi.). Eventually, the pulling force becomes too large and leads to the dissociation of TonB/HasB from the TBDT, and the return to the resting state of the system (vii.). Source data are provided as a Source Data file.CC BY · PubMed Central

Verification

Claims the paper makes

The claims and statistics of this paper haven’t been checked yet.

Run the check — free, no account needed. It reads the open-access text and checks the sources it cites.

A few free checks a day · papers already verified open instantly · results are public

Self-check

Percentages, sums and reported differences re-computed from the paper’s own numbers.

The self-check needs the paper’s full text.

Citations

Cites

Research works printed but not linked: 54

  1. Blair, J. M. A., Webber, M. A., Baylay, A. J., Ogbolu, D. O. & Piddock, L. J. V. Molecular mechanisms of antibiotic resistance. Nat. Rev. Microbiol. 13, 42–51 (2015). · DOI · Paper page
  2. Noinaj, N., Guillier, M., Barnard, T. J. & Buchanan, S. K. TonB-dependent transporters: regulation, structure, and function. Annu. Rev. Microbiol. 64, 43–60 (2010). · DOI · Paper page
  3. Paquelin, A., Ghigo, J. M., Bertin, S. & Wandersman, C. Characterization of HasB, a Serratia marcescens TonB-like protein specifically involved in the haemophore-dependent haem acquisition system. Mol. Microbiol. 42, 995–1005 (2001). · DOI
  4. Biou, V. et al. Structural and molecular determinants for the interaction of ExbB from Serratia marcescens and HasB, a TonB paralog. Commun. Biol. 5, 1–15 (2022). · DOI
  5. de Amorim, G. C. et al. The structure of hasB reveals a new class of tonb protein fold. PLOS ONE 8, e58964 (2013). · DOI
  6. Celia, H. et al. Cryo-EM structure of the bacterial Ton motor subcomplex ExbB–ExbD provides information on structure and stoichiometry. Commun. Biol. 2, 1–6 (2019). · DOI
  7. Celia, H. et al. Structural insight into the role of the Ton complex in energy transduction. Nature 538, 60–65 (2016). · DOI
  8. Maki-Yonekura, S. et al. Hexameric and pentameric complexes of the ExbBD energizer in the Ton system. eLife 7, e35419 (2018). · DOI
  9. Garcia-Herrero, A., Peacock, R. S., Howard, S. P. & Vogel, H. J. The solution structure of the periplasmic domain of the TonB system ExbD protein reveals an unexpected structural homology with siderophore-binding proteins. Mol. Microbiol. 66, 872–889 (2007). · DOI
  10. Rieu, M., Krutyholowa, R., Taylor, N. M. I. & Berry, R. M. A new class of biological ion-driven rotary molecular motors with 5:2 symmetry. Front. Microbiol. 13, 948383 (2022). · DOI
  11. Deme, J. C. et al. Structures of the stator complex that drives rotation of the bacterial flagellum. Nat. Microbiol. 5, 1553–1564 (2020). · DOI
  12. Shultis, D. D., Purdy, M. D., Banchs, C. N. & Wiener, M. C. Outer membrane active transport: structure of the btub:tonb complex. Science 312, 1396–1399 (2006). · DOI
  13. Josts, I., Veith, K. & Tidow, H. Ternary structure of the outer membrane transporter FoxA with resolved signalling domain provides insights into TonB-mediated siderophore uptake. eLife 8, e48528 (2019). · DOI
  14. Domingo Köhler, S., Weber, A., Howard, S. P., Welte, W. & Drescher, M. The proline-rich domain of TonB possesses an extended polyproline II-like conformation of sufficient length to span the periplasm of Gram-negative bacteria. Protein Sci. 19, 625–630 (2010). · DOI
  15. Evans, J. S., Levine, B. A., Trayer, I. P., Dorman, C. J. & Higgins, C. F. Sequence-imposed structural constraints in the TonB protein of E. coli. FEBS Lett. 208, 211–216 (1986). · DOI
  16. Virtanen, S. I., Kiirikki, A. M., Mikula, K. M., Iwaï, H. & Ollila, O. H. S. Heterogeneous dynamics in partially disordered proteins. Phys. Chem. Chem. Phys. 22, 21185–21196 (2020). · DOI
  17. Ratliff, A. C., Buchanan, S. K. & Celia, H. The Ton Motor. Front. Microbiol. 13, 852955 (2022). · DOI
  18. Lefèvre, J., Delepelaire, P., Delepierre, M. & Izadi-Pruneyre, N. Modulation by substrates of the interaction between the hasr outer membrane receptor and its specific tonb-like protein, HasB. J. Mol. Biol. 378, 840–851 (2008). · DOI
  19. Kaserer, W. A. et al. Insight from TonB hybrid proteins into the mechanism of iron transport through the outer membrane. J. Bacteriol. 190, 4001–4016 (2008). · DOI
  20. Kojima, S. et al. The helix rearrangement in the periplasmic domain of the flagellar stator b subunit activates peptidoglycan binding and ion influx. Structure 26, 590–598.e5 (2018). · DOI
  21. Szczepaniak, J. et al. The lipoprotein Pal stabilises the bacterial outer membrane during constriction by a mobilisation-and-capture mechanism. Nat. Commun. 11, 1305 (2020). · DOI
  22. Parsons, L. M., Lin, F. & Orban, J. Peptidoglycan recognition by Pal, an outer membrane lipoprotein. Biochemistry 45, 2122–2128 (2006). · DOI
  23. Wojdyla, J. A. et al. Structure and function of the escherichia coli tol-pal stator protEin TolR*. J. Biol. Chem. 290, 26675–26687 (2015). · DOI
  24. Hantke, K. & Braun, V. Functional interaction of the tonA/tonB receptor system in Escherichia coli. J. Bacteriol. 135, 190–197 (1978). · DOI
  25. Vallurupalli, P., Bouvignies, G. & Kay, L. E. Studying “invisible” excited protein states in slow exchange with a major state conformation. J. Am. Chem. Soc. 134, 8148–8161 (2012). · DOI
  26. Kopp, D. R. & Postle, K. The intrinsically disordered region of exbd is required for signal transduction. J. Bacteriol. 202, e00687–19 (2020). · DOI
  27. Moynihan, P. J., Sychantha, D. & Clarke, A. J. Chemical biology of peptidoglycan acetylation and deacetylation. Bioorg. Chem. 54, 44–50 (2014). · DOI
  28. Parsons, L. M., Grishaev, A. & Bax, A. The periplasmic domain of tolr from haemophilus influenzae forms a dimer with a large hydrophobic groove: nmr solution structure and comparison to SAXS data. Biochemistry 47, 3131–3142 (2008). · DOI
  29. Gumbart, J., Wiener, M. C. & Tajkhorshid, E. Mechanics of force propagation in tonb-dependent outer membrane transport. Biophys. J. 93, 496–504 (2007). · DOI
  30. Grinter, R. & Lithgow, T. The structure of the bacterial iron–catecholate transporter Fiu suggests that it imports substrates via a two-step mechanism. J. Biol. Chem. 294, 19523–19534 (2019). · DOI
  31. Schuck, P. Size-distribution analysis of macromolecules by sedimentation velocity ultracentrifugation and lamm equation modeling. Biophys. J. 78, 1606–1619 (2000). · DOI
  32. Ortega, A., Amorós, D. & García de la Torre, J. Prediction of hydrodynamic and other solution properties of rigid proteins from atomic- and residue-level models. Biophys. J. 101, 892–898 (2011). · DOI
  33. Favier, A. & Brutscher, B. NMRlib: user-friendly pulse sequence tools for Bruker NMR spectrometers. J. Biomol. NMR 73, 199–211 (2019). · DOI
  34. Schanda, P. Kupče, Ē. & Brutscher, B. SOFAST-HMQC experiments for recording two-dimensional deteronuclear correlation spectra of proteins within a few seconds. J. Biomol. NMR 33, 199–211 (2005). · DOI
  35. Lescop, E., Schanda, P. & Brutscher, B. A set of BEST triple-resonance experiments for time-optimized protein resonance assignment. J. Magn. Reson. 187, 163–169 (2007). · DOI
  36. Cordier, F., Nisius, L., Dingley, A. J. & Grzesiek, S. Direct detection of N−H⋯O=C hydrogen bonds in biomolecules by NMR spectroscopy. Nat. Protoc. 3, 235–241 (2008). · DOI
  37. Delaglio, F. et al. NMRPipe: a multidimensional spectral processing system based on UNIX pipes. J. Biomol. NMR 6, 277–293 (1995). · DOI
  38. Ying, J., Delaglio, F., Torchia, D. A. & Bax, A. Sparse multidimensional iterative lineshape-enhanced (SMILE) reconstruction of both non-uniformly sampled and conventional NMR data. J. Biomol. NMR 68, 101–118 (2017). · DOI
  39. Vranken, W. F. et al. The CCPN data model for NMR spectroscopy: development of a software pipeline. Proteins Struct. Funct. Bioinforma. 59, 687–696 (2005). · DOI
  40. Skinner, S. P. et al. CcpNmr analysisassign: a flexible platform for integrated NMR analysis. J. Biomol. NMR 66, 111–124 (2016). · DOI
  41. Guenneugues, M., Berthault, P. & Desvaux, H. A method for determiningb1field inhomogeneity. are the biases assumed in heteronuclear relaxation experiments usually underestimated? J. Magn. Reson. 136, 118–126 (1999). · DOI
  42. Allain, F., Mareuil, F., Ménager, H., Nilges, M. & Bardiaux, B. ARIAweb: a server for automated NMR structure calculation. Nucleic Acids Res 48, W41–W47 (2020). · DOI
  43. Shen, Y. & Bax, A. Protein backbone and sidechain torsion angles predicted from NMR chemical shifts using artificial neural networks. J. Biomol. NMR 56, 227–241 (2013). · DOI
  44. Bardiaux, B. et al. Influence of different assignment conditions on the determination of symmetric homodimeric structures with ARIA. Proteins Struct. Funct. Bioinforma. 75, 569–585 (2009). · DOI
  45. Nilges, M. et al. Accurate NMR structures through minimization of an extended hybrid energy. Structure 16, 1305–1312 (2008). · DOI
  46. Linge, J. P., Williams, M. A., Spronk, C. A. E. M., Bonvin, A. M. J. J. & Nilges, M. Refinement of protein structures in explicit solvent. Proteins Struct. Funct. Bioinforma. 50, 496–506 (2003). · DOI
  47. Buchner, L. & Güntert, P. Systematic evaluation of combined automated NOE assignment and structure calculation with CYANA. J. Biomol. NMR 62, 81–95 (2015). · DOI
  48. Weber, P. et al. High-throughput crystallization pipeline at the crystallography core facility of the institut pasteur. Molecules 24, 4451 (2019). · DOI
  49. Kabsch, W. XDS. Acta Crystallogr. D. Biol. Crystallogr. 66, 125–132 (2010). · DOI · Paper page
  50. McCoy, A. J. et al. Phaser crystallographic software. J. Appl. Crystallogr. 40, 658–674 (2007). · DOI · Paper page
  51. Emsley, P. & Cowtan, K. Coot: model-building tools for molecular graphics. Acta Crystallogr. D. Biol. Crystallogr. 60, 2126–2132 (2004). · DOI · Paper page
  52. Murshudov, G. N. et al. REFMAC5 for the refinement of macromolecular crystal structures. Acta Crystallogr. D. Biol. Crystallogr. 67, 355–367 (2011). · DOI
  53. Liebschner, D. et al. Macromolecular structure determination using X-rays, neutrons and electrons: recent developments in Phenix. Acta Crystallogr. Sect. Struct. Biol. 75, 861–877 (2019). · DOI · Paper page
  54. Goddard, T. D. et al. UCSF chimeraX: meeting modern challenges in visualization and analysis. Protein Sci. 27, 14–25 (2018). · DOI · Paper page

Cited by

Still being checked.

Metadata

Authors
Zinke, M., Lejeune, M., Mechaly, A., Bardiaux, B., Boneca, I. G., Delepelaire, P., & Izadi-Pruneyre, N.
Affiliations
Centre National de la Recherche Scientifique (FR)
Venue
Nature Communications
Published
2024-01-06
Volume
15
Issue
1
Pages
331-331
ISSN
2041-1723 (ISSN-L)
OpenAlex
W4390639340
Cited by
27
References
3
Citations by year
2026: 8 · 2025: 12 · 2024: 7
FWCI
7.17
Type
journal article
Language
en
Open access
Locations
  • Nature Communications (publishedVersion, cc-by)
  • PubMed Central (publishedVersion, cc-by)
  • PubMed (publishedVersion)
  • HAL (submittedVersion, cc-by)
  • DOAJ (DOAJ: Directory of Open Access Journals) (submittedVersion, cc-by-sa)
Funders
Agence Nationale de la Recherche (nvestissement d’Avenir grant ANR-16-CONV-0005)
Topics
  • Life Sciences › Biochemistry, Genetics and Molecular Biology › Genetics › Bacterial Genetics and Biotechnology
  • Health Sciences › Medicine › Oncology › Drug Transport and Resistance Mechanisms
  • Life Sciences › Immunology and Microbiology › Microbiology › Escherichia coli research studies
Keywords
ExbD, TonB, conformational switching, peptidoglycan, proton channel, disorder-to-order transition, Gram-negative bacteria, proton motive force, energy transfer, antibacterial strategies, gliding motility, membrane integrity
MeSH terms
Nutrients, Bacteria, Cell Wall, Peptidoglycan, Protons

About these checks

Registry, retraction, Cites and statistics results are computed, not judged, with one exception: a printed reference that no index lists is read once by a model before it counts as a citation error. Claims are extracted by a model and kept only when their quote appears verbatim in the text; each cited source is then checked, with a model’s help, for whether it says what the claim relies on. Those verdicts can be wrong — read the claim’s quote and the cited source before relying on one.

Statistics and arithmetic are recomputed, not judged.

Confidence bands are shown only for fields calibrated on our annotated test set. None is calibrated yet, so no band is shown.

What counts as a claim ›How we measure confidence ›How we check this ›

Are you an author, or do you see a problem with this page? Request a review