

The DOI matches its Crossref record; 73 of the 73 references it cites were found in a registry or an index.
Contribution of climate change to the spatial expansion of West Nile virus in Europe
Open accessAbstract
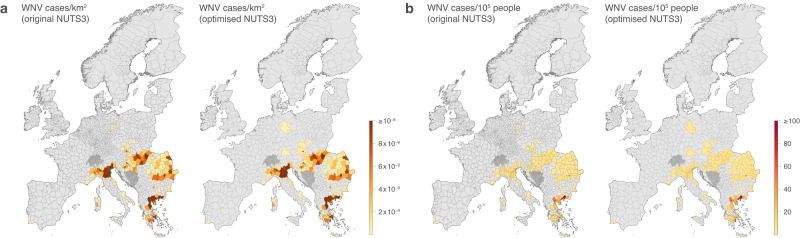
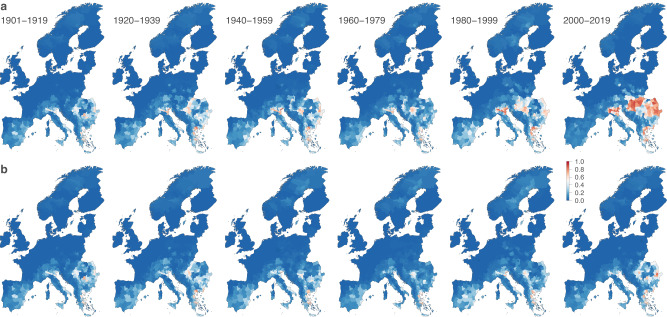
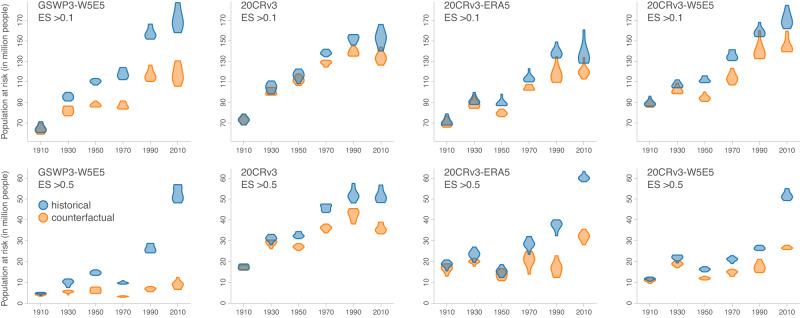
West Nile virus (WNV) is an emerging mosquito-borne pathogen in Europe where it represents a new public health threat. While climate change has been cited as a potential driver of its spatial expansion on the continent, a formal evaluation of this causal relationship is lacking. Here, we investigate the extent to which WNV spatial expansion in Europe can be attributed to climate change while accounting for other direct human influences such as land-use and human population changes. To this end, we trained ecological niche models to predict the risk of local WNV circulation leading to human cases to then unravel the isolated effect of climate change by comparing factual simulations to a counterfactual based on the same environmental changes but a counterfactual climate where long-term trends have been removed. Our findings demonstrate a notable increase in the area ecologically suitable for WNV circulation during the period 1901-2019, whereas this area remains largely unchanged in a no-climate-change counterfactual. We show that the drastic increase in the human population at risk of exposure is partly due to historical changes in population density, but that climate change has also been a critical driver behind the heightened risk of WNV circulation in Europe.
Overview
The claims and statistics of this paper haven’t been checked yet.
Run the check — free, no account needed. It reads the open-access text and checks the sources it cites.
Integrity signals
Registry
Cites
Statistics
Figures
Verification
Claims the paper makes
The claims and statistics of this paper haven’t been checked yet.
Run the check — free, no account needed. It reads the open-access text and checks the sources it cites.
Claims other papers make about this one
Each is checked against this paper’s own text: does it say what the citing paper says it does?
The source backs part of the claim, not all of it — or backs it for a different population, condition or comparison.
In the citing paper
“The virus is found across the globe, with its range expanding in some world regions.160”
From The 2024 report of the Lancet Countdown on health and climate change: facing record-breaking threats from delayed action (2024) · cites this paper as [160]
Experimental — accuracy not yet measuredThe check wasn’t confident either way, so it gives no verdict — never disputed.
In the citing paper
“Extreme heat can affect human mental health outcomes across a continuum of severity, from subclinical to life-altering.102,142–147”
From The 2024 report of the Lancet Countdown on health and climate change: facing record-breaking threats from delayed action (2024) · cites this paper as [144]
Experimental — accuracy not yet measured
Self-check
Percentages, sums and reported differences re-computed from the paper’s own numbers.
The self-check needs the paper’s full text.
Citations
Cites
Hersbach, H., Bell, B., Berrisford, P., Hirahara, S., Horányi, A., Muñoz‐Sabater, J., Nicolas, J., Peubey, C., Radu, R., Schepers, D., et al. (2020) · Quarterly Journal of the Royal Meteorological Society · doi:10.1002/qj.3803 · Cited by 31,882
Novel methods improve prediction of species’ distributions from occurrence data
Elith*, J., H. Graham*, C., P. Anderson, R., Dudík, M., Ferrier, S., Guisan, A., J. Hijmans, R., Huettmann, F., R. Leathwick, J., Lehmann, A., et al. (2006) · Ecography · doi:10.1111/j.2006.0906-7590.04596.x · Cited by 9,088
Biodiversity redistribution under climate change: Impacts on ecosystems and human well-being
Pecl, G. T., Araújo, M. B., Bell, J. D., Blanchard, J., Bonebrake, T. C., Chen, I.-C., Clark, T. D., Colwell, R. K., Danielsen, F., Evengård, B., et al. (2017) · Science · doi:10.1126/science.aai9214 · Cited by 3,668
The Twentieth Century Reanalysis Project
Compo, G. P., Whitaker, J. S., Sardeshmukh, P. D., Matsui, N., Allan, R. J., Yin, X., Gleason, B. E., Vose, R. S., Rutledge, G., Bessemoulin, P., et al. (2011) · Quarterly Journal of the Royal Meteorological Society · doi:10.1002/qj.776 · Cited by 3,518
AUC: A misleading measure of the performance of predictive distribution models
Lobo, J. M., Jiménez‐Valverde, A., & Real, R. (2008) · Global Ecology and Biogeography · doi:10.1111/j.1466-8238.2007.00358.x · Cited by 3,499
Effects of species diversity on disease risk
Keesing, F., Holt, R. D., & Ostfeld, R. S. (2006) · Ecology Letters · doi:10.1111/j.1461-0248.2006.00885.x · Cited by 1,642
Impact of climate change on human infectious diseases: Empirical evidence and human adaptation
Wu, X., Lu, Y., Zhou, S., Chen, L., & Xu, B. (2015) · Environment International · doi:10.1016/j.envint.2015.09.007 · Cited by 1,101
Valavi, R., Elith, J., Lahoz‐Monfort, J. J., & Guillera‐Arroita, G. (2019) · Methods in Ecology and Evolution · doi:10.1111/2041-210x.13107 · Cited by 1,056
Slivinski, L., Compo, G. P., Whitaker, J. S., Sardeshmukh, P. D., Giese, B. S., McColl, C., Allan, R. J., Yin, X., Vose, R. S., Titchner, H., et al. (2019) · Quarterly Journal of the Royal Meteorological Society · doi:10.1002/qj.3598 · Cited by 1,007
Jiménez‐Valverde, A. (2011) · Global Ecology and Biogeography · doi:10.1111/j.1466-8238.2011.00683.x · Cited by 822
Research works printed but not linked: 2
- IPCC. Annex II: Glossary. In Climate Change 2022: Impacts, Adaptation and Vulnerability. Contribution of Working Group II to the Sixth Assessment Report of the Intergovernmental Panel on Climate Change (Cambridge University Press, 2022).
- Elith, J., Leathwick, J. R. & Hastie, T. A working guide to boosted regression trees. J Anim. Ecology 77, 802–813 (2008).
Cited by
Sorted by citations
Romanello, M., Walawender, M., Hsu, S.-C., Moskeland, A., Palmeiro-Silva, Y., Scamman, D., Ali, Z., Ameli, N., Angelova, D., Ayeb-Karlsson, S., et al. (2024) · The Lancet · doi:10.1016/s0140-6736(24)01822-1 · Cited by 897
The European Union One Health 2023 Zoonoses report
Authority, E. F. S. (2024) · EFSA Journal · doi:10.2903/j.efsa.2024.9106 · Cited by 391
Gould, C. V., Staples, J. E., Guagliardo, S. A. J., Martin, S. W., Lyons, S., Hills, S. L., Nett, R. J., & Petersen, L. R. (2025) · JAMA · doi:10.1001/jama.2025.8737 · Cited by 72
Flavivirus infections and diagnostic challenges for dengue, West Nile and Zika Viruses
Madere, F. S., da Silva, A. V. A., Okeze, E., Tilley, E., Grinev, A., Konduru, K., García, M., & Rios, M. (2025) · npj Viruses · doi:10.1038/s44298-025-00114-z · Cited by 53
Singh, P., Khatib, M. N., Ballal, S., Kaur, M., Nathiya, D., Sharma, S., Prasad, G. V. S., Sinha, A., Gaidhane, A. M., Mohapatra, P., et al. (2024) · Emerging Microbes & Infections · doi:10.1080/22221751.2024.2437244 · Cited by 53
Münger, E., Atama, N. C., van Irsel, J., Blom, R., Krol, L., van Mastrigt, T., van den Berg, T. J., Braks, M. A. H., de Vries, A., van der Linden, A., et al. (2025) · Nature Communications · doi:10.1038/s41467-025-63122-w · Cited by 41
Frontiers in attributing climate extremes and associated impacts
Perkins-Kirkpatrick, S. E., Alexander, L. V., King, A. D., Kew, S., Philip, S. Y., Barnes, C. R., Maraun, D., Stuart-Smith, R. F., Jézéquel, A., Bevacqua, E., et al. (2024) · Frontiers in Climate · doi:10.3389/fclim.2024.1455023 · Cited by 45
Self-citationZhu, L., & Li, Y. (2025) · Physical review. E · doi:10.1103/xwt2-f1d3 · Cited by 34
The Spread of the Mosquito‐Transmitted West Nile Virus in North America and Europe
Brüssow, H., & Figuerola, J. (2025) · Microbial Biotechnology · doi:10.1111/1751-7915.70120 · Cited by 32
Health losses attributed to anthropogenic climate change
Carlson, C. J., Mitchell, D., Gibb, R., Stuart-Smith, R. F., Carleton, T. A., Lavelle, T. E., Lippi, C. A., Lukas-Sithole, M., North, M. A., Ryan, S. J., et al. (2025) · Nature Climate Change · doi:10.1038/s41558-025-02399-7 · Cited by 32
Pavia, G., Branda, F., Ciccozzi, A., Romano, C., Locci, C., Azzena, I., Pascale, N., Marascio, N., Quirino, A., Gigliotti, S., et al. (2024) · Scandinavian Journal of Infectious Diseases · doi:10.1080/23744235.2024.2437027 · Cited by 29
West Nile Virus (WNV): One-Health and Eco-Health Global Risks
Bruno, L., Nappo, M. A., Frontoso, R., Perrotta, M. G., Lecce, R. D., Guarnieri, C., Ferrari, L., & Corradi, A. (2025) · Veterinary Sciences · doi:10.3390/vetsci12030288 · Cited by 32
Alvarez, I., Díaz-Poso, A., Lorenzo, M. N., & Royé, D. (2024) · Atmospheric Research · doi:10.1016/j.atmosres.2024.107512 · Cited by 23
West Nile virus - a re-emerging global threat: recent advances in vaccines and drug discovery
Kocabiyik, D. Z., Álvarez, L. F., Durigon, E. L., & Wrenger, C. (2025) · Frontiers in Cellular and Infection Microbiology · doi:10.3389/fcimb.2025.1568031 · Cited by 19
Addressing the rise of autochthonous vector-borne diseases in a warming Europe
Fleischmann, W. A., Cao, L. C., Nurjadi, D., & Velavan, T. P. (2024) · International Journal of Infectious Diseases · doi:10.1016/j.ijid.2024.107275 · Cited by 18
Moirano, G., Fletcher, C., Semenza, J. C., & Lowe, R. (2024) · The Lancet Regional Health - Europe · doi:10.1016/j.lanepe.2024.101149 · Cited by 18
Campos, C. A. V., García-Pérez, S., Figuerola, J., la Puente, J. M., Polo, I., Rodríguez‐Fonseca, B., Fernández-Álvarez, S., Fraile, V. G., Martín‐Rey, M., Lacasaña, M., et al. (2025) · One Health · doi:10.1016/j.onehlt.2025.100984 · Cited by 19
Phylogenetic insights into the transmission dynamics of arthropod-borne viruses
Hill, V., Dellicour, S., Giovanetti, M., & Grubaugh, N. D. (2025) · Nature Reviews Genetics · doi:10.1038/s41576-025-00854-x · Cited by 17
Self-citationGobbo, F., Chiarello, G., Sgubin, S., Toniolo, F., Gradoni, F., Danca, L. I., Carlin, S., Capello, K., Conti, G. D., Bortolami, A., et al. (2025) · Pathogens · doi:10.3390/pathogens14030227 · Cited by 16
Heidecke, J., Wallin, J., Fransson, P., Singh, P., Sjödin, H., Stiles, P., Treskova, M., & Rocklöv, J. (2025) · PLoS Computational Biology · doi:10.1371/journal.pcbi.1012866 · Cited by 20
Harmonizing Multisource Data to Inform Vector-Borne Disease Risk Management Strategies
Lowe, R., & Codeço, C. T. (2024) · Annual Review of Entomology · doi:10.1146/annurev-ento-040124-015101 · Cited by 17
Strengthening arbovirus surveillance: bridging gaps for global health preparedness
Cella, E., Cunha, M. V., Alcantara, L. C. J., Lourenço, J., & Giovanetti, M. (2025) · Trends in Microbiology · doi:10.1016/j.tim.2025.03.010 · Cited by 14
Serres, K., Erazo, D., Despréaux, G., Vincenti-Gonzalez, M. F., Bortel, W. V., Arsevska, E., & Dellicour, S. (2024) · Eurosurveillance · doi:10.2807/1560-7917.es.2024.29.44.2400084 · Cited by 14
Self-citationMosquito-borne diseases are surging in Europe — how worried are scientists?
Naddaf, M. (2024) · Nature · doi:10.1038/d41586-024-03031-y · Cited by 13
Cholvi-Simó, M., Moretti, R., Osório, H. C., L’Ambert, G., Seixas, G., Kavran, M., Michaelakis, Α., Stephanou, A., Antoniou, C., Martinou, A. F., et al. (2026) · Insects · doi:10.3390/insects17030254 · Cited by 12
Blood under pressure: how climate change threatens blood safety and supply chains
Viennet, E., Dean, M. M., Kircher, J., Leder, K. S., Guo, Y., Jones, P., & Faddy, H. M. (2025) · The Lancet Planetary Health · doi:10.1016/s2542-5196(25)00051-8 · Cited by 14
Effect of Climate Change on West Nile Virus Transmission in Italy: A Systematic Review
Lorenzon, A., Granata, M., Verzelloni, P., Tommasi, L., Palandri, L., Malavolti, M., Bargellini, A., Righi, E., Vinceti, M., Paduano, S., et al. (2025) · Public health reviews · doi:10.3389/phrs.2025.1607444 · Cited by 11
West Nile and Usutu viruses: current spreading and future threats in a warming northern Europe
Laverdeur, J., Amory, H., Beckers, P., Desmecht, D. J.-M., Francis, F., Garigliany, M.-M., Hayette, M., Linden, A. S., & Darcis, G. (2025) · Frontiers in Virology · doi:10.3389/fviro.2025.1544884 · Cited by 10
West Nile Virus Infections in Germany: Update 2022–2024
Offergeld, R., Frank, C., Schmidt‐Chanasit, J., Ziegler, U., Preußel, K., & Lachmann, R. (2025) · Transfusion Medicine and Hemotherapy · doi:10.1159/000549166 · Cited by 10
Dagostin, F., Erazo, D., Marini, G., Re, D. D., Tagliapietra, V., Avdičová, M., Avšič‐Županc, T., Dub, T., Fiorito, N., Knap, N., et al. (2026) · One Health · doi:10.1016/j.onehlt.2026.101331 · Cited by 10
Self-citationGeraldes, M. A., Cunha, M. V., Godinho, C., de Lima, R. F., Giovanetti, M., & Lourenço, J. (2024) · The Science of The Total Environment · doi:10.1016/j.scitotenv.2024.173875 · Cited by 14
Vilibić‐Čavlek, T., Barbić, L., Klobučar, A., Vucelja, M., Bogdanić, M., Sabadi, D., Kutleša, M., Gjurašin, B., Stevanović, V., Posavec, M. C., et al. (2025) · Viruses · doi:10.3390/v17060846 · Cited by 9
TRIMming down Flavivirus Infections
Cannac, M., & Nisole, S. (2024) · Viruses · doi:10.3390/v16081262 · Cited by 9
Bouchez-Zacria, M., Calenge, C., Villers, A., Lecollinet, S., Gonzalez, G., Quintard, B., Leclerc, A., Baurier, F., Paty, M.-C., Faure, É., et al. (2025) · Peer Community Journal · doi:10.24072/pcjournal.513 · Cited by 7
New enemies: contribution of C ulex perexiguus in the transmission dynamic of West Nile virus
Fesce, E., & Ferraguti, M. (2025) · Pathogens and Global Health · doi:10.1080/20477724.2025.2538838 · Cited by 7
The potential impacts of human genetics on virus emergence
Langlois, R. A., & Casanova, J. (2025) · Proceedings of the National Academy of Sciences · doi:10.1073/pnas.2504318122 · Cited by 9
Zulli, A., Duong, D. H., Shelden, B., Bidwell, A., Wolfe, M. K., White, B. J., & Boehm, A. B. B. (2025) · PeerJ · doi:10.7717/peerj.19748 · Cited by 6
Zerbato, V., Rossi, B., Bella, S. D., Bartalucci, C., Cerchiaro, M., Re, D. D., Dentone, C., Sepulcri, C., Marini, G., Delfino, E., et al. (2026) · Annals of Medicine · doi:10.1080/07853890.2026.2615482 · Cited by 6
Self-citationGenomic Epidemiology of West Nile Virus in Paris
Klitting, R., Gondard, M., Pezzı, L., Migné, C. V., Bellone, R., L’ambert, G., Helle, T., Mignotte, A., Gutiérrez‐Climente, R., Lacour, G., et al. (2026) · JAMA Network Open · doi:10.1001/jamanetworkopen.2025.59588 · Cited by 6
Ecological risk factors for the establishment of West Nile virus in Britain
Kirby, G., Vaux, A. G. C., Ferguson, H. M., & Medlock, J. M. (2025) · Trends in Parasitology · doi:10.1016/j.pt.2024.12.003 · Cited by 6
Stiles, P., Balatsos, G., Liyanage, P., Baron, J. N., Sofianou, M. S., Bisia, M. G., Karras, V., Bärnighausen, T., Patsoula, E., Rocklöv, J., et al. (2025) · Communications Biology · doi:10.1038/s42003-025-08825-y · Cited by 5
The Re-Emergence of Neuroinvasive Flaviviruses in Croatia During the 2022 Transmission Season
Bogdanić, M., Savić, V., Klobučar, A., Barbić, L., Sabadi, D., Tomljenović, M., Madić, J., Hruškar, Ž., Posavec, M. C., Santini, M., et al. (2024) · Microorganisms · doi:10.3390/microorganisms12112210 · Cited by 5
Drivers and epidemiological patterns of West Nile virus in Serbia
Marini, G., Drakulović, M. B., Jovanović, V., Dagostin, F., Wint, W., Tagliapietra, V., Vasić, M., & Rizzoli, A. P. (2024) · Frontiers in Public Health · doi:10.3389/fpubh.2024.1429583 · Cited by 5
Self-citationWang, R., Li, Z., Yin, Q., Zhang, T., Zheng, Y., Nie, K., Li, F., Fu, S., Cui, Q., Xu, S., et al. (2024) · International Journal of Biological Macromolecules · doi:10.1016/j.ijbiomac.2024.139187 · Cited by 5
Auto-Abs against type I IFNs: Strong, common, and global determinants of severe arboviral diseases
Gervais, A., Borghesi, A., Casanova, J., & Zhang, S. (2025) · Journal of Human Immunity · doi:10.70962/jhi.20250090 · Cited by 4
Olowu, B. I., Zakariya, M. E., Azeez, A. O., Al-Awal, A. A., Adebayo, K. S., Idris, N. O., Muhammad, H. I., Ukauwa, C. B., & Olojede, A.-A. A. (2026) · Bacteria · doi:10.3390/bacteria5010002 · Cited by 4
Active West Nile virus transmission in Brazil: an epidemiological study
de Lima, S. T. S., Claro, I. M., Hua, X., de Jesus, R., Serres, K., Mello, L. M. S., Forato, J., Moreira, F. R. R., Kato, R. B., Guimarães, G. N., et al. (2025) · The Lancet Regional Health - Americas · doi:10.1016/j.lana.2025.101229 · Cited by 4
Self-citationTóth, G. E., Petersen, M., Chevenet, F., Sikora, M., Tomazatos, A., Bialonski, A., Baum, H., Horváth, B., Siriyasatien, P., Heitmann, A., et al. (2025) · Journal of Infection · doi:10.1016/j.jinf.2025.106647 · Cited by 4
Angelis, L. D., Ancona, A., Moirano, G., Oradini‐Alacreu, A., Bella, A., Fabiani, M., Petrone, D., Piervitali, E., Perconti, W., Fraschetti, P., et al. (2024) · Environmental Research · doi:10.1016/j.envres.2024.120320 · Cited by 4
FMO-based interaction analysis on DEET/icaridin—AgamOBP1 complex
Akisawa, K., Sakuma, Y., Tsukamoto, A., Doi, H., Okuwaki, K., Hirano, Y., Yamamoto, E., Yasuoka, K., & Mochizuki, Y. (2025) · Chemistry Letters · doi:10.1093/chemle/upaf030 · Cited by 4
Avian top‐down effects on insects and their host plants under human‐driven global change
Marquis, R. J., Whelan, C. J., & Garfinkel, M. B. (2025) · Ibis · doi:10.1111/ibi.13419 · Cited by 5
The impact of climate change on transmission season length: West Nile virus as a case studyPreprint
Fay, R. L., Glidden, C. K., Trok, J. T., Diffenbaugh, N. S., Ciota, A. T., & Mordecai, E. A. (2025) · bioRxiv (Cold Spring Harbor Laboratory) · doi:10.1101/2025.08.01.667982 · Cited by 4
Tropical diseases in the context of climate change and emerging European transmission
Grzybek, M. (2026) · PLoS neglected tropical diseases · doi:10.1371/journal.pntd.0014038 · Cited by 4
Meeting Report on an Integrated Research Agenda for Mosquito-Borne Arboviruses
Ulrich, A. K., Moua, N. M., Mack, A., Imai, N., Staples, J. E., Mehr, A. J., Ostrowsky, J., Leighton, T., Cehovin, A., Fay, P. C., et al. (2025) · Open Forum Infectious Diseases · doi:10.1093/ofid/ofaf395 · Cited by 3
Roy, K., Basu, R., & Basu, A. (2025) · mBio · doi:10.1128/mbio.00886-25 · Cited by 3
Summary of human West Nile virus vaccine meeting, 2024: Investigating barriers to development
Nett, R. J., Brault, A. C., Lambert, A. J., Agnihothram, S., Barrett, A. D. T., Barzon, L., Clements, D. E., Durbin, A. P., Kretschmer, M., Monath, T. P. C., et al. (2025) · Vaccine · doi:10.1016/j.vaccine.2025.127938 · Cited by 3
Florian, D. M., Camp, J. V., Jungbauer, C., Werber, D., Reich, A., Stiasny, K., Aberle, S. W., & Aberle, J. H. (2026) · Eurosurveillance · doi:10.2807/1560-7917.es.2026.31.1.2500260 · Cited by 3
Dong, J., & Zhao, L. (2026) · Applied Economics · doi:10.1080/00036846.2026.2619798 · Cited by 3
Malagò, S., Mori, A., Deiana, M., Mauro, M. V., Vangeli, V., Guadagnino, G., Accordini, S., Gianesini, N., Chesini, L. M., Cheri, S., et al. (2026) · International Journal of Molecular Sciences · doi:10.3390/ijms27041809 · Cited by 3
Bhowmick, S., Irwin, P., Lopez, K., Fritz, M. L., & Smith, R. L. (2025) · Ecological Informatics · doi:10.1016/j.ecoinf.2025.103163 · Cited by 3
Sattler, T., Benka, B., Zimpernik, I., Pürrer, S., Waldner, K., Duscher, G. G., Kuffer‐Rosewick, A., Fertey, J., Ulbert, S., & Schmoll, F. (2025) · Veterinary Medicine and Science · doi:10.1002/vms3.70485 · Cited by 3
Cellular Immune Response in Horses After West Nile Neuroinvasive Disease
Tolnai, C. H., O’Sullivan, C., Lőrincz, M., Karvouni, M., Miklós, T. E. N. K., Marosi, A., Forgách, P., Paszerbovics, B., Wágenhoffer, Z., & Kutasi, O. (2025) · Animals · doi:10.3390/ani15162352 · Cited by 3
Pilgrim, J., Seechurn, N., Cunningham-Oakes, E., Gillespie, L., Dobbs, P., Lopez, J., Kohl, A., Hughes, G. L., Blagrove, M. S. C., Baylis, M., et al. (2026) · Virology Journal · doi:10.1186/s12985-026-03305-z · Cited by 3
Baldon, L., de Mendonça, S., Santos, E. C. N., Marçal, B., de Freitas, A. C., Rezende, F. O., Moreira, R., Sousa, V., Comini, S., Lima, M., et al. (2024) · Tropical Medicine and Infectious Disease · doi:10.3390/tropicalmed9090201 · Cited by 3
Seroprevalence of West Nile Virus in Blood Donors in Mainland Portugal
Rocha, R., Kurum, E., Charrel, R. N., Ayhan, N., & Maia, C. (2025) · Tropical Medicine and Infectious Disease · doi:10.3390/tropicalmed10080229 · Cited by 2
West Nile virus unmasked: from gene variability to future challenges
Prieto-Vega, S., Berzal‐Herranz, A., Garrido, J. J., Arias, A., Grande-Pérez, A., Fernández‐Escamilla, A. M., & Montoya, M. (2025) · Frontiers in Cellular and Infection Microbiology · doi:10.3389/fcimb.2025.1690827 · Cited by 4
Geraldes, M. A., Giovanetti, M., Cunha, M. V., & Lourenço, J. (2026) · Communications Biology · doi:10.1038/s42003-025-09410-z · Cited by 2
Izquierdo‐Condoy, J. S., Gil, J. C., Saavedra-Torres, J. S., Nati-Castillo, H. A., Peñaranda, J. J. M., Narváez, C. V., López-Cortés, A., Arias-Intriago, M., & Ortiz‐Prado, E. (2026) · Viruses · doi:10.3390/v18030281 · Cited by 2
The impact of climate change on neuroinfectious diseases
Jacinto, S. (2025) · Current Opinion in Neurology · doi:10.1097/wco.0000000000001398 · Cited by 2
Climate change’s impact on recording of West Nile fever of animals in the Middle Volga region
Andreychev, A., Ивановна, Б. Е., & Nesterova, D. (2025) · BIO Web of Conferences · doi:10.1051/bioconf/202518102023 · Cited by 2
Kirby, G. W., Brown, R., Lee, M., Parvy, J.-P., Krabbendam, S., Pondeville, E., Johnston, C., Medlock, J. M., Vaux, A. G. C., Nelli, L., et al. (2026) · bioRxiv (Cold Spring Harbor Laboratory) · doi:10.64898/2026.01.20.700351 · Cited by 2
Infectious diseases in a warming world: A call for action
Moir, M., Baxter, C., Tegally, H., & de Oliveira, T. (2025) · South African Journal of Science · doi:10.17159/sajs.2025/20722 · Cited by 1
Epidemiological, Clinical and Phylogenetic Characteristics of West Nile Virus in Bulgaria, 2024
Ngoc, K., Stoikov, I., Trifonova, I. T., Panayotova, E., Trifonova, I., & Christova, I. (2025) · Microbiology Research · doi:10.3390/microbiolres16040082 · Cited by 1
Lakatos, I., Malik, P., Bodó, K., Szőke, Z., Sükösd, F., Lanszki, Z., Szemethy, L., Kurucz, K., Bànyai, K., Kemenesi, G., et al. (2025) · Animals · doi:10.3390/ani15131948 · Cited by 1
Patterns of emergence and circulation of West Nile Virus in Algeria
Hachid, A., Benbetka, C., Bouamra, A., Bouredjoul, N., Khardine, F. A., Ochida, N., Garni, R., Khaldi, A., Seghier, M., Charniga, K., et al. (2026) · Nature Communications · doi:10.1038/s41467-026-74856-6 · Cited by 1
A novel CRISPR-Cas12a-based diagnostic for rapid and highly sensitive detection of West Nile virus
Erol, A., Birand, E. D. Ç., Yilmaz, E., Polat, C., Kasap, Ö. E., Alten, B., & Duman, M. (2025) · Journal of Materials Chemistry B · doi:10.1039/d5tb01268f · Cited by 1
Luque-Ambrosiani, A. C., Lopera-Rodríguez, I., Panadero, A. F., Torralbo-Gómez, M. D. S., Salgado-Irazabal, M., Hernández-Chamorro, F. J., Ramos, F. J. H., Jiménez-Hernández, M. D., & García, A. P. (2025) · Revista de Neurología · doi:10.31083/rn36787 · Cited by 1
Szojka, Z. I., Florian, D. M., Rosel, A. C., Ruppitsch, W., Aberle, S. W., Otto, F., & Camp, J. V. (2025) · International Journal of Infectious Diseases · doi:10.1016/j.ijid.2025.108161 · Cited by 1
Ethnic and Epidemiological Peculiarities of Movement Disorders across the World
Moura, J., Balint, B., Cullinane, P. W., Alhashash, H., Magrinelli, F., Latorre, A., & Bhatia, K. P. (2025) · Movement Disorders Clinical Practice · doi:10.1002/mdc3.70475 · Cited by 1
Bastard, J., Métras, R., & Durand, B. (2026) · Epidemiology and Infection · doi:10.1017/s0950268826101034 · Cited by 1
Pilgrim, J., Widlake, E., Wilson, R., Vaux, A. G. C., Medlock, J. M., Darby, A. C., Baylis, M., & Blagrove, M. S. C. (2026) · Frontiers in Microbiology · doi:10.3389/fmicb.2026.1749228 · Cited by 1
Tetaj, N., Bocci, M. G., Capecchi, G., Lesci, A., Rubino, D., Sabatini, V., Taloni, G., Mattiucci, E., Bartoli, T. A., Maffongelli, G., et al. (2026) · Frontiers in Medicine · doi:10.3389/fmed.2026.1792053 · Cited by 1
Erazo, D., Pietroiusti, R., Ghisbain, G., Colón‐González, F. J., Pironon, S., Bortel, W. V., Mengel, M., Frieler, K., Thiery, W., & Dellicour, S. (2026) · Environmental Research Letters · doi:10.1088/1748-9326/ae51a7 · Cited by 3
Self-citationWest Nile Virus–Neutralizing Plasma for West Nile Virus Disease
Regev‐Yochay, G., Barda, N., Shusterman, Y., Magiel, E., Ganmore, I., Baharav, N., Belkin, A., Margalit, I., Indenbaum, V., Lustig, Y., et al. (2026) · NEJM Evidence · doi:10.1056/evidoa2500169 · Cited by 1
Marcolin, L., Tonelli, A., & Marco, M. D. (2026) · Journal of The Royal Society Interface · doi:10.1098/rsif.2026.0082 · Cited by 1
Nagy, A., Erdélyi, K., Molnár, Z., Lőrincz, R. B., Nagy, O., Koroknai, A., Csonka, N., Kerényi, K., Forgách, P., Horváth, E., et al. (2026) · Eurosurveillance · doi:10.2807/1560-7917.es.2026.31.16.2500785 · Cited by 1
Duve, P., Sauer, F. G., & Lühken, R. (2026) · Ecological Modelling · doi:10.1016/j.ecolmodel.2026.111605 · Cited by 1
Bridging the data gap: Integration of spatial modelling in wildlife disease surveillance
Wijburg, S. R., Sprong, H., Rijks, J. M., Gröne, A., Baños, J. V., Fischer, E. A. J., Smith, G. C., & Maas, M. (2026) · Ecological Modelling · doi:10.1016/j.ecolmodel.2026.111675 · Cited by 1
Fine-scale heterogeneity and local amplification of West Nile virus in urban environments in Berlin
Patzina-Mehling, C., Kopp, A., Lee, Y.-S., Birkl, M. X. L., Ebers, S., Voigt, K., Graff, S. L., Beisel, U., Landgraf, C., Ganz, F., et al. (2026) · Nature Communications · doi:10.1038/s41467-026-73251-5 · Cited by 1
Approaches, challenges and applications of climate change impact attribution
Undorf, S., Dimitrova, A., Harrington, L. J., Hegerl, G. C., Jézéquel, A., Kimutai, J., Lo, Y. T. E., Mengel, M., Perkins-Kirkpatrick, S. E., Pietroiusti, R., et al. (2026) · Nature Reviews Earth & Environment · doi:10.1038/s43017-026-00798-8 · Cited by 1
Self-citationGodarzi, B., Holicki, C. M., Chandler, F. D., Sikkema, R. S., Veldhuizen, E. J. A., van Amerongen, A., van den Berg, T. J., & Gröne, A. (2026) · Journal of Virological Methods · doi:10.1016/j.jviromet.2026.115435 · Cited by 1
Not all West Nile virus lineages behave alike: dose-response differences between lineages 1 and 2
Höller, P., Sauer, F. G., Lühken, R., Becker, N., Schmidt‐Chanasit, J., Jansen, S., & Heitmann, A. (2026) · Scientific Reports · doi:10.1038/s41598-026-64742-y · Cited by 1
Alatawna, H., Abu‐Shakra, M., Schlaeffer‐Yosef, T., & Sagy, I. (2025) · Internal and Emergency Medicine · doi:10.1007/s11739-025-03993-5 · Cited by 1
Mocq, J., Raymond, J., Bolloré, K., Fossot, A., Beaubaton, R., Lepeule, A., Gruet, C., Durandet, F., Hanin, J., Lacour, G., et al. (2026) · bioRxiv (Cold Spring Harbor Laboratory) · doi:10.64898/2026.02.01.703130 · Cited by 1
Höller, P., Sauer, F. G., Lühken, R., Becker, N., Schmidt‐Chanasit, J., Jansen, S., & Heitmann, A. (2026) · bioRxiv (Cold Spring Harbor Laboratory) · doi:10.64898/2026.02.03.700853 · Cited by 1
Meschi, S., Colavita, F., Matusali, G., Focosi, D., Maggi, F., & Franchini, M. (2024) · Transfusion · doi:10.1111/trf.17946
Bhowmick, S., Irwin, P., Lopez, K., Fritz, M. L., & Smith, R. L. (2024) · SSRN Electronic Journal · doi:10.2139/ssrn.5050395
Asymmetric Interactions Shape Survival During Population Range ExpansionsPreprint
Gray, J. M., Barker-Clarke, R. J., Scott, J. G., & Hinczewski, M. (2024) · bioRxiv (Cold Spring Harbor Laboratory) · doi:10.1101/2024.12.14.628506
XI International EMCA Conference: shaping the future of vector control in Europe
Barceló, C., Delacour‐Estrella, S., Arrondo, I. R., & Chueca, M. Á. M. (2024) · Journal of the European Mosquito Control Association · doi:10.52004/2054930x-2024x002
Genetic structure of the northern house mosquito (Diptera: Culicidae) in a WNV-susceptible area
Alvial, I., Rojas‐Hernández, N., Guerra, N., Véliz, D., González, C. R., Pérez, L. M., & Benítez, H. A. (2025) · Journal of Heredity · doi:10.1093/jhered/esaf005
Metadata
- Authors
- Erazo, D., Grant, L., Ghisbain, G., Marini, G., Colón-González, F. J., Wint, W., Rizzoli, A., Van Bortel, W., Vogels, C. B. F., Grubaugh, N. D., Mengel, M., Frieler, K., Thiery, W., & Dellicour, S.
- Affiliations
- Université Libre de Bruxelles (BE)
- Vrije Universiteit Brussel (BE)
- University of Mons (BE)
- Fondazione Edmund Mach (IT)
- Yale University (US)
- Potsdam Institute for Climate Impact Research (DE)
- Corresponding author
- Erazo, Diana
- Dellicour, Simon
- ORCID
- Venue
- Nature Communications
- Published
- 2024-02-08
- Volume
- 15
- Issue
- 1
- Pages
- 1196-1196
- ISSN
- 2041-1723 (ISSN-L)
- PMC
- PMC10853512
- OpenAlex
- W4391654441
- Cited by
- 151
- References
- 73
- Citations by year
- 2026: 67 · 2025: 62 · 2024: 22
- FWCI
- 62.55
- Type
- journal article
- Language
- en
- Open access
- gold
- doi.org
- Locations
- Nature Communications (publishedVersion, cc-by)
- PubMed Central (publishedVersion, cc-by)
- PubMed (publishedVersion)
- RePEc: Research Papers in Economics (submittedVersion)
- Dépôt institutionnel de l'Université libre de Bruxelles (Université Libre de Bruxelles) (submittedVersion, other-oa)
- DOAJ (DOAJ: Directory of Open Access Journals) (submittedVersion)
- Lirias (submittedVersion, cc-by)
- CINECA IRIS Institutional Research Information System (Fondazione Edmund Mach) (submittedVersion, cc-by)
- ORBi UMONS (submittedVersion, other-oa)
- Publication Database PIK (Potsdam Institute for Climate Impact Research (PIK)) (submittedVersion, cc-by)
- VUBIR (Vrije Universiteit Brussel) (submittedVersion)
- Funders
- Georgia Clinical and Translational Science Alliance (UL1TR001863)
- Vlaams Supercomputer Centrum
- European Commission (801505, HORIZON2020, 874850)
- European Centre for Disease Prevention and Control
- Fonds De La Recherche Scientifique - FNRS (4515.22, G098321N, F.4515.22)
- Fonds Wetenschappelijk Onderzoek (G098321N)
- Vlaamse regering
- National Institutes of Health (UL1TR001863)
- Departement Economie, Wetenschap en Innovatie
- National Center for Advancing Translational Sciences (TR001863)
- Topics
- Health Sciences › Medicine › Public Health, Environmental and Occupational Health › Mosquito-borne diseases and control
- Physical Sciences › Environmental Science › Health, Toxicology and Mutagenesis › Climate Change and Health Impacts
- Physical Sciences › Environmental Science › Ecological Modeling › Species Distribution and Climate Change
- Keywords
- West Nile virus, climate change, spatial expansion, mosquito-borne diseases, ecological niche modeling, human population density, land use change, emerging infectious diseases, Europe
- MeSH terms
- Animals, Europe, Humans, Culicidae, West Nile Fever, West Nile virus, Climate Change
About these checks
Registry, retraction, Cites and statistics results are computed, not judged, with one exception: a printed reference that no index lists is read once by a model before it counts as a citation error. Claims are extracted by a model and kept only when their quote appears verbatim in the text; each cited source is then checked, with a model’s help, for whether it says what the claim relies on. Those verdicts can be wrong — read the claim’s quote and the cited source before relying on one.
Statistics and arithmetic are recomputed, not judged.
Confidence bands are shown only for fields calibrated on our annotated test set. None is calibrated yet, so no band is shown.
What counts as a claim ›How we measure confidence ›How we check this ›
Are you an author, or do you see a problem with this page? Request a review
