

The DOI matches its Crossref record; 79 of the 79 references it cites were found in a registry or an index.
Design of target specific peptide inhibitors using generative deep learning and molecular dynamics simulations
Open accessPublished version of a preprint
Abstract
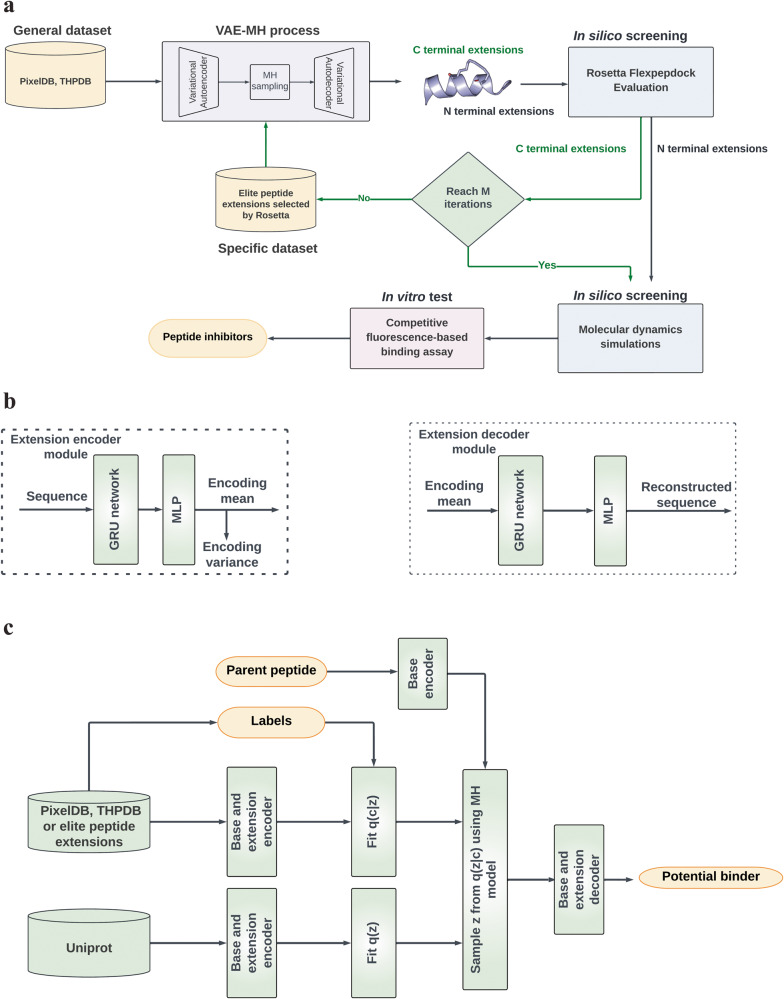
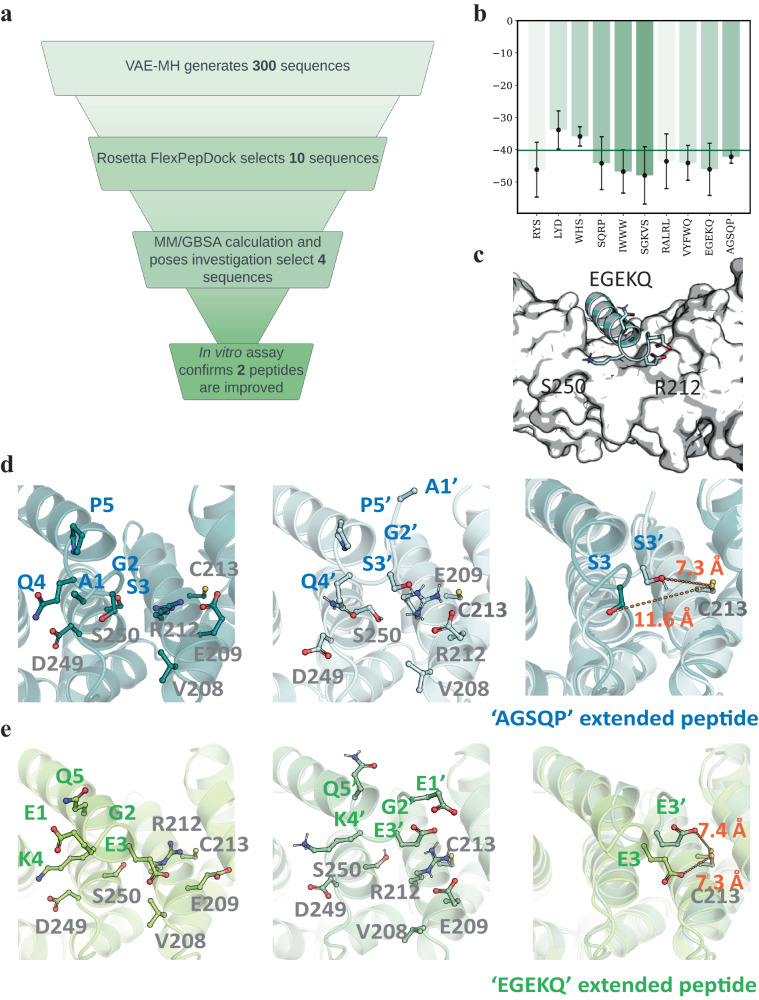
We introduce a computational approach for the design of target-specific peptides. Our method integrates a Gated Recurrent Unit-based Variational Autoencoder with Rosetta FlexPepDock for peptide sequence generation and binding affinity assessment. Subsequently, molecular dynamics simulations are employed to narrow down the selection of peptides for experimental assays. We apply this computational strategy to design peptide inhibitors that specifically target β -catenin and NF- κ B essential modulator. Among the twelve β -catenin inhibitors, six exhibit improved binding affinity compared to the parent peptide. Notably, the best C-terminal peptide binds β -catenin with an IC 50 of 0.010 ± 0.06 μM, which is 15-fold better than the parent peptide. For NF- κ B essential modulator, two of the four tested peptides display substantially enhanced binding compared to the parent peptide. Collectively, this study underscores the successful integration of deep learning and structure-based modeling and simulation for target specific peptide design.
Overview
The claims and statistics of this paper haven’t been checked yet.
Run the check — free, no account needed. It reads the open-access text and checks the sources it cites.
Integrity signals
Registry
Cites
Statistics
Figures
Verification
Claims the paper makes
The claims and statistics of this paper haven’t been checked yet.
Run the check — free, no account needed. It reads the open-access text and checks the sources it cites.
Self-check
Percentages, sums and reported differences re-computed from the paper’s own numbers.
The self-check needs the paper’s full text.
Citations
Cites
Vaswani, A., Shazeer, N., Parmar, N., Uszkoreit, J., Jones, L., Gomez, A. N., Kaiser, L., & Polosukhin, I. (2017) · arXiv · doi:10.48550/arxiv.1706.03762 · Cited by 120,404
Highly accurate protein structure prediction with AlphaFold
Jumper, J., Evans, R., Pritzel, A., Green, T., Figurnov, M., Ronneberger, O., Tunyasuvunakool, K., Bates, R., Žídek, A., Potapenko, A., et al. (2021) · Nature · doi:10.1038/s41586-021-03819-2 · Cited by 43,764
Abraham, M. J., Murtola, T., Schulz, R., Páll, S., Smith, J. C., Hess, B., & Lindahl, E. (2015) · SoftwareX · doi:10.1016/j.softx.2015.06.001 · Cited by 27,190
Efficient Estimation of Word Representations in Vector Space
Mikolov, T., Chen, K., Corrado, G., & Dean, J. (2013) · arXiv · doi:10.48550/arxiv.1301.3781 · Cited by 26,568
Polymorphic transitions in single crystals: A new molecular dynamics method
Parrinello, M., & Rahman, A. (1981) · Journal of Applied Physics · doi:10.1063/1.328693 · Cited by 19,915
LINCS: A linear constraint solver for molecular simulations
Hess, B., Bekker, H., Berendsen, H. J. C., & Fraaije, J. G. E. M. (1997) · Journal of Computational Chemistry · doi:10.1002/(sici)1096-987x(199709)18:12 · Cited by 18,182
UniProt: the Universal Protein knowledgebase
Apweiler, R. (2003) · Nucleic Acids Research · doi:10.1093/nar/gkh131 · Cited by 7,593
UniProt: the universal protein knowledgebase in 2021
The UniProt Consortium, Bateman, A., Martin, M.-J., Orchard, S., Magrane, M., Agivetova, R., Ahmad, S., Alpi, E., Bowler-Barnett, E. H., Britto, R., et al. (2021) · Nucleic Acids Research · doi:10.1093/nar/gkaa1100 · Cited by 6,372
Kollman, P. A., Massova, I., Reyes, C., Kuhn, B., Huo, S., Chong, L., Lee, M., Lee, T., Duan, Y., Wang, W., et al. (2000) · Accounts of Chemical Research · doi:10.1021/ar000033j · Cited by 4,978
Understanding the Metropolis-Hastings Algorithm
Chib, S., & Greenberg, E. (1995) · The American Statistician · doi:10.1080/00031305.1995.10476177 · Cited by 4,212
Research works printed but not linked: 7
- Sutskever, I., Vinyals, O. & Le, Q. V. Sequence to sequence learning with neural networks. In Proceedings of the 27th International Conference on Neural Information Processing Systems, 3104–3112 (Curran Associates, Inc., 2014).
- Radford, A., Narasimhan, K., Salimans, T. & Sutskever, I. Improving language understanding by generative pre-training. https://api.semanticscholar.org/CorpusID:49313245 (2018).
- London, N., Raveh, B., Cohen, E., Fathi, G. & Schueler-Furman, O. Rosetta flexpepdock web server—high resolution modeling of peptide–protein interactions. Nucleic Acids Res. 39, W249–W253 (2011). · DOI
- Doersch, C. Tutorial on variational autoencoders. Preprint at https://arxiv.org/abs/1606.05908 (2016). · arXiv
- Pascanu, R., Mikolov, T. & Bengio, Y. On the difficulty of training recurrent neural networks. In Proceedings of the 30th International Conference on Machine Learning (eds. Dasgupta, S., & McAllester D.) PMLR 28, 1310–1318 (JMLR.org, 2012).
- Chung, J., Gulcehre, C., Cho, K. & Bengio, Y. Empirical evaluation of gated recurrent neural networks on sequence modeling. Preprint at https://arxiv.org/abs/1412.3555 (2014). · arXiv
- Stranges, P. B. & Kuhlman, B. A comparison of successful and failed protein interface designs highlights the challenges of designing buried hydrogen bonds. Protein Sci. 22, 74–82 (2012). · DOI
Cited by
Sorted by citations
Items 201–300 of 324
Autophagy acts as a spatial organizer of cell-type-specific plant immunityPreprint
Zhu, S., González‐Fuente, M., Léger, O., Langin, G., Xu, K., Aydin, N. H., Schulz, N., Solanský, P., Denyer, T., Chiaro, A. D., et al. (2026) · bioRxiv (Cold Spring Harbor Laboratory) · doi:10.64898/2026.04.06.716646 · Cited by 1
Theune, M. L., Fritsche, R., Kueppers, N., Boehm, M., Kolkhof, P., Paul, F., Popa, O., Oldenburg, E., Wiegard, A., Axmann, I. M. I., et al. (2026) · bioRxiv (Cold Spring Harbor Laboratory) · doi:10.64898/2026.04.08.717167 · Cited by 3
Appel, L., Kumar, A., Tamborrini, D., Pascoa, T. C., Kayastha, K., Ermler, U., Kettler, T., Bohn, S., Reif-Trauttmansdorff, T., Engel, B. D., et al. (2026) · bioRxiv (Cold Spring Harbor Laboratory) · doi:10.64898/2026.04.10.717634 · Cited by 2
The leaf cell arrest front is established by spatio-temporal control of cell sizes at divisionPreprint
Kelly-Bellow, R., Prior, R., Trozzi, N., Majda, M., Carter, R., Hartley, M., Grieneisen, V. A., Marée, A. F. M., Smith, R. S., & Bevan, M. W. (2026) · bioRxiv (Cold Spring Harbor Laboratory) · doi:10.64898/2026.04.20.718680 · Cited by 1
McAndrew, E. M., Fierville, M., Gautier‐Isola, M., Pignol, M., Arguel, M., Cadis, H., Barrès, R., Mari, B. P., Barbry, P., & Lebrigand, K. (2026) · bioRxiv (Cold Spring Harbor Laboratory) · doi:10.64898/2026.09.22.753429 · Cited by 1
Sönmez, E., Yan, S., Lin, M.-S., & Baumgartner, M. (2024) · bioRxiv (Cold Spring Harbor Laboratory) · doi:10.1101/2024.03.20.585872
Meagher, E., Magel, T., Boulter, T., Muñoz, C., Prestley, N., Chan, W.-S., Bryden, C., & Nacul, L. (2024) · medRxiv · doi:10.1101/2024.05.25.24307912 · Cited by 1
Inferring metabolite states from spatial transcriptomes using multiple graph neural networkPreprint
Luo, J., Ai, D., & Sun, W. (2024) · bioRxiv (Cold Spring Harbor Laboratory) · doi:10.1101/2024.06.12.598759
Preventing escape and malfunction of recoded cells due to tRNA base changesPreprint
Chiappino-Pepe, A., Radford, F., Budnik, B., Taş, H., Augustin, T. L., Burgess, H. M., Moret, M., Dharani, A. M., Zheng, Q., Fan, W., et al. (2024) · bioRxiv (Cold Spring Harbor Laboratory) · doi:10.1101/2024.07.18.604179
The role of the synaptic vesicle protein SV2A in regulating mitochondrial morphology and autophagyPreprint
Jörg, M., Reichert, J., Pauly, K., Distler, U., Tenzer, S., Bartholomé, O., Rogister, B., Kern, A., Behl, C., Gellérie, M., et al. (2024) · bioRxiv (Cold Spring Harbor Laboratory) · doi:10.1101/2024.07.30.605753 · Cited by 1
Hunter, B. S., Cromwell, T., & Shim, H. (2024) · bioRxiv (Cold Spring Harbor Laboratory) · doi:10.1101/2024.08.04.606558
Hiki, K., & Jo, T. (2024) · bioRxiv (Cold Spring Harbor Laboratory) · doi:10.1101/2024.09.23.614187
Neuronal mechanisms of adaptive value coding in the amygdalaPreprint
Hinz, J., Mahn, M., Müller, S., Szőnyi, A., Eichlisberger, T., & Lüthi, A. (2024) · bioRxiv (Cold Spring Harbor Laboratory) · doi:10.1101/2024.10.13.618086
TamL is a key player of the outer membrane homeostasis in BacteroidetesPreprint
Giovannercole, F., de Smet, T., Vences‐Guzmán, M. Á., Lauber, F., Dugauquier, R., Dieu, M., Lizen, L., Dehairs, J., Lima‐Mendez, G., Guan, Z., et al. (2024) · bioRxiv (Cold Spring Harbor Laboratory) · doi:10.1101/2024.10.17.618404
Multi-color fluorescence live-cell imaging in Dictyostelium discoideumPreprint
Hashimura, H., Kuwana, S., Nakagwa, H., Abe, K., Adachi, T., Sugita, T., Fujishiro, S., Honda, G., & Sawai, S. (2024) · bioRxiv (Cold Spring Harbor Laboratory) · doi:10.1101/2024.10.22.619593
Hunt, H. L., Biggs, M. A., Goncavles, B. G., & Banerjee, I. A. (2024) · Soft Materials · doi:10.1080/1539445x.2024.2413063 · Cited by 1
Deep Learning Unravels Potential Antibiotic-Resistance Drugs against Klebsiella PneumoniaePreprint
Lin, P., Zhou, J., Meng, S., Lei, Z., Jin, L., Qiu, H., Xu, Y., Hsu, T., Bu, Y., Qin, G., et al. (2024) · bioRxiv (Cold Spring Harbor Laboratory) · doi:10.1101/2024.11.25.625191
Konishi, K., Neves, G., Russell, M. R. G., Mimura, M., Burrone, J., & Fleck, R. A. (2024) · bioRxiv (Cold Spring Harbor Laboratory) · doi:10.1101/2024.11.29.626074
Maździarz, M. A., Krawczyk, K., Lepiarczyk, E., Paukszto, Ł., Makowczenko, K. G., Moczulska, B., Iwanowicz, P., Kocbach, P., Sawicki, J., Gromadziński, L., et al. (2025) · bioRxiv (Cold Spring Harbor Laboratory) · doi:10.1101/2025.01.14.632961
Li, Y., Zeng, M., Zhu, J., Liu, L., Wang, F., Huang, L.-K., Yang, F., Li, M., & Yao, J. (2025) · bioRxiv (Cold Spring Harbor Laboratory) · doi:10.1101/2025.02.02.635055
Jonker, P. B., Sadullozoda, M., Cognet, G., Saab, J. J. A., Sokol, K. H., Wu, V., Kumari, D., Sheehan, C. S., Özgürses, M. E., Agovino, D., et al. (2026) · eLife · doi:10.7554/elife.106492.3
Zhu, Z., Liu, H., Guo, Y., Xu, M. H., Li, X., Zhou, H., & Wang, J. (2025) · bioRxiv (Cold Spring Harbor Laboratory) · doi:10.1101/2025.03.10.642308
Self-citationCytosine-to-uracil RNA editing is upregulated by pro-inflammatory stimulation of myeloid cellsPreprint
Seo, H., Cuddleston, W. H., Fu, T., Navarro, E., Parks, M., Allan, A., Efthymiou, A. G., Breen, M. S., Xiao, X. G., Raj, T., et al. (2025) · bioRxiv (Cold Spring Harbor Laboratory) · doi:10.1101/2025.03.14.643382
Hidalgo, A. E., Pearson, L., Oku, T., Kimoto, Y., Furuya, S., & Ruiz, M. H. (2025) · bioRxiv (Cold Spring Harbor Laboratory) · doi:10.1101/2025.03.31.646422
Learning the dynamic organization of a replicating bacterial chromosome from time-course Hi-C dataPreprint
Harju, J., Messelink, J. J. B., Tröger, L., Gradziuk, G., Rathnayaka, I., Billini, M., Thanbichler, M. R., van Teeseling, M. C. F., & Broedersz, C. P. (2025) · bioRxiv (Cold Spring Harbor Laboratory) · doi:10.1101/2025.04.03.647011 · Cited by 1
Deep Phenotyping Long-COVID Postural Tachycardia SyndromePreprint
Larsen, N. W., Taha, H. B., Seliger, J., Shaik, R., Machnik, J. V., Lansberg, M. G., Muppidi, S., Jaradeh, S. S., Gibbons, C. H., Utz, P. J., et al. (2025) · medRxiv · doi:10.1101/2025.04.28.25326587
De Novo Design of Highly Stable Binders Targeting Dihydrofolate Reductase in Klebsiella pneumoniae
Haq, I., Anwar, F., & Tong, Y. (2025) · Proteins Structure Function and Bioinformatics · doi:10.1002/prot.26835
Recognition and catalytic mechanism of tRNA m 3 C methyltransferase METTL6Preprint
Aupič, J., Hollmer, I., Tengo, L., Sehr, P. A., Kowalinski, E., & Magistrato, A. (2025) · bioRxiv (Cold Spring Harbor Laboratory) · doi:10.1101/2025.06.25.660299
Donada, A., Hermange, G., Tocci, T., Midoun, A., Prevedello, G., Abed, L. H., Dupré, D., Sun, W., Milo, I., Bento, S. T., et al. (2026) · Nature Communications · doi:10.1038/s41467-026-75250-y · Cited by 2
Lokubal, P., Part, C., Brimicombe, C., Kovats, S. R., Jackson, D. J., Blencowe, H. K., & Filippi, V. (2026) · BMJ Public Health · doi:10.1136/bmjph-2025-004085
Pinpointing protein structures over broad temperature range using hydrophobic protectionPreprint
Ribeiro, F. D. S., & Lima, L. M. T. R. (2025) · bioRxiv (Cold Spring Harbor Laboratory) · doi:10.1101/2025.07.08.662548
Morais‐Silva, G., Gasques, B. F., Lugli, I. L., & Nunes‐de‐Souza, R. L. (2026) · Progress in Neuro-Psychopharmacology and Biological Psychiatry · doi:10.1016/j.pnpbp.2026.111720
Pawlik, W., Woźna, M., Jazurek, M., Dulski, J., Sławek, J. W., Kościańska, E., Witkos, T. M., & Fiszer, A. (2025) · bioRxiv (Cold Spring Harbor Laboratory) · doi:10.1101/2025.08.13.669846
Autosomally-encoded segregation distortion of sex chromosomes
Greenberg, N. L., Patten, M. M., & Schenkel, M. A. (2025) · Proceedings of the Royal Society B Biological Sciences · doi:10.1098/rspb.2025.1085
Kronig, L., Weber, C. A., Gómez-García, P. A., Fischer, J. S., Dörig, C., Michel, A. H., Ronchi, P., Khawaja, S., Picotti, P., Kornmann, B., et al. (2025) · bioRxiv (Cold Spring Harbor Laboratory) · doi:10.1101/2025.09.30.679535
Barker, S. J., Patra, B., Sharma, M., Karsten, R. E. H., Verpoorte, E. M. J., & Utz, M. (2025) · bioRxiv (Cold Spring Harbor Laboratory) · doi:10.1101/2025.10.08.681085
Qin, D., Das, R., Schallenberg, S., Riecken, K., Tinhofer, I., & Coscia, F. (2026) · bioRxiv · doi:10.1101/2025.10.11.681009
Karam, L., Pacis, A., Dandage, R., Schwartz, M. K., Alzial, G., Gherghi, A., Djambazian, H. H. V., Zapata, G. A., Schapfl, M. A., Asadi, P., et al. (2025) · bioRxiv (Cold Spring Harbor Laboratory) · doi:10.1101/2025.10.15.682593
Brain-Wide Subnetworks within and between Naturally Socializing Typical and Autism Model MicePreprint
Marmor, O., Terner, R., Khuory, V., Ginzburg, S., Amal, H., & Gilad, A. (2025) · bioRxiv (Cold Spring Harbor Laboratory) · doi:10.1101/2025.10.16.682530
Complementary ecomorphological patterns in brain shape and size evolution across the avian radiationPreprint
Lowi‐Merri, T. M., & Watanabe, A. (2025) · bioRxiv (Cold Spring Harbor Laboratory) · doi:10.1101/2025.10.14.682392
Pipaliya, S. V., Kingdon, E. M., Wirdnam, C. D., Balmer, E. A., Kahn, R., Dacks, J. B., & Faso, C. (2025) · bioRxiv (Cold Spring Harbor Laboratory) · doi:10.1101/2025.10.20.683495
Peng, K.-L., Wu, Y.-H., Hsu, H.-C., & Cheng, J. (2025) · Antibiotics · doi:10.3390/antibiotics14111077
Silk fibroin as a modulator of the amyloidogenic α-synuclein aggregationPreprint
Miali, M. E., Barak, Y., Fridmann-Sirkis, Y., Rosenhek‐Goldian, I., Brookstein, O., Eliaz, D., & Shimanovich, U. (2025) · bioRxiv (Cold Spring Harbor Laboratory) · doi:10.1101/2025.10.25.684501
Zhou, R., Du, J., Faber, N. R., & Champer, J. (2025) · bioRxiv (Cold Spring Harbor Laboratory) · doi:10.1101/2025.11.04.686506
3D bone printing via primed differentiation of stem cells with ultrasound (3DBonUS)Preprint
Marcotulli, M., Patuto, C., Scognamiglio, C., Serpe, F., Iafrate, L., Şentürk, E., Keller, S. B., Grandi, D. D., Palmisano, B., Corsi, A., et al. (2025) · bioRxiv (Cold Spring Harbor Laboratory) · doi:10.1101/2025.11.04.686554
Patel, S. V., Geenen, C., & André, E. (2025) · Archives of Disease in Childhood · doi:10.1136/archdischild-2025-329171
Flexible foraging decisions by configuration of orthogonal integrator dynamicsPreprint
Kingsbury, L., Zhang, G., Sanguinetti-Scheck, J. I., & Uchida, N. (2025) · bioRxiv (Cold Spring Harbor Laboratory) · doi:10.1101/2025.11.14.688540 · Cited by 1
Hu, T., Yu, T., Na, K., Lin, Q., Chen, S., Zhang, L., Yu, C., Li, X., & Guo, X. (2025) · European Journal of Medicinal Chemistry · doi:10.1016/j.ejmech.2025.118365
Self-citationG-Quadruplex and i-Motif Structures in the SHMT1 5’UTR Modulate Gene ExpressionPreprint
Palumbo, R. M., Kasaju, M., Hershey, S. C., McCann, M. E., Woon, Z. H., Heisler, D. B., & Mihailescu, M. (2025) · bioRxiv (Cold Spring Harbor Laboratory) · doi:10.1101/2025.11.24.690261
Wanjiru, T., Langat, S. K., Koka, H., Yalwala, S., Kerich, G., Ambale, J., Johnson, J., Garges, E. C., Haynes, R. C., Kellar, G. G., et al. (2025) · bioRxiv (Cold Spring Harbor Laboratory) · doi:10.64898/2025.12.01.691525
Barrena, N., Rodriguez-Flores, C. J., Valcárcel, L. V., Olaverri-Mendizabal, D., Agirre, X., Prósper, F., & Planes, F. J. (2025) · Bioinformatics Advances · doi:10.1093/bioadv/vbaf319 · Cited by 1
Ten Years of Scientific Discovery with the UK Biobank CMR Imaging StudyPreprint
Raisi‐Estabragh, Z., Petersen, S. E., & Neubauer, S. (2025) · medRxiv · doi:10.64898/2025.12.20.25342751
Computational Design of Therapeutic Peptides
Choudhury, P. R., Yadav, S., Jaiswal, S., Khanna, T., & Mathur, P. (2025) · BENTHAM SCIENCE PUBLISHERS eBooks · doi:10.2174/9798898812164125080005
Artificial Intelligence in Peptide Drug Discovery
Fu, Y., & Bai, Q. (2026) · Springer eBooks · doi:10.1007/978-3-031-98022-0_7
Chromatin crosstalk between HDA19 and NuA4 sets thresholds for stress gene activation in ArabidopsisPreprint
Dzięgielewski, W., Bieluszewska, A., Bieluszewski, T., Krzysztoń, M., Pelé, A., Szymańska-Lejman, M., Wilhelm, A., Świeżewski, S., & Ziółkowski, P. A. (2026) · bioRxiv (Cold Spring Harbor Laboratory) · doi:10.64898/2026.01.12.699102
Osako, Y., Heller, G. R., Ährlund‐Richter, S., Buschman, T. J., & Sur, M. (2025) · bioRxiv (Cold Spring Harbor Laboratory) · doi:10.1101/2025.08.13.670128
Uniform design-embedded predictions of (tetra-)peptide physicochemical properties
Zhu, Z., Liu, H., Li, X., Zhou, H., & Wang, J. (2026) · Bioinformatics · doi:10.1093/bioinformatics/btag036
Self-citationPeptides and Peptidomimetics as Inhibitors of Protein–Protein Interactions
Shrestha, P., Shrestha, A., & Jois, S. D. S. (2026) · Challenges and advances in computational chemistry and physics · doi:10.1007/978-3-032-07880-3_7
Centanino, V., & Fortunato, G. (2025) · doi:10.17605/osf.io/2tequ
Dengue virus-specific memory B cell subsets differ as a function of infection historyPreprint
Singh, T., Balakhmet, A., Granera, J. M., Shinkre, R., Zambrana, J. V., Lee, N. E., Graber, A. L., Duarte, E. M., Bos, S., Narvaez, F., et al. (2026) · bioRxiv (Cold Spring Harbor Laboratory) · doi:10.64898/2026.01.30.702935
The genetic architecture of local adaptation is historically contingentPreprint
Duan, T., Whitlock, M. C., & Booker, T. R. (2026) · bioRxiv (Cold Spring Harbor Laboratory) · doi:10.64898/2026.02.01.703099
Effects of thymidylate synthase inhibitors differ in genomic uracilation and mutagenic potential
Holub, E., Papp, G., Pálinkás, H. L., Szajkó, M. B., Izrael, R., Róna, G., Vértessy, B. G., & Békési, A. (2026) · Life Science Alliance · doi:10.26508/lsa.202503352
González-Teshima, L. Y., Maihemuti, W., Murata, K., & Masumoto, H. (2026) · bioRxiv (Cold Spring Harbor Laboratory) · doi:10.64898/2026.02.03.703640
The regulatory landscape of optic fissure closure in the vertebrate eyePreprint
Chan, B. H. C., Moosajee, M., Hardy, H., Prendergast, J. G. D., & Rainger, J. (2026) · bioRxiv (Cold Spring Harbor Laboratory) · doi:10.64898/2026.02.11.705341
Singh, S. (2026) · bioRxiv (Cold Spring Harbor Laboratory) · doi:10.64898/2026.02.14.705892
Li, Z., Fu, C., Zhou, P., Logan, R. W., & Zhou, C. (2026) · medRxiv · doi:10.64898/2026.02.14.26346327
Effective connectivity of the insula as measured by cortico-cortical evoked potentialsPreprint
Pinheiro, C., Jedynak, M., Avalos-Alais, S., Boyer, A., Bastin, J., Kahane, P., & Olivier David, A. (2026) · medRxiv · doi:10.64898/2026.02.16.26344827
BOND-PEP: topology-conditioned bipartite alignment for evidence-grounded peptide binder generationPreprint
Ding, W. (2026) · bioRxiv (Cold Spring Harbor Laboratory) · doi:10.64898/2026.02.18.706554
Choi, Y., Jang, Y., Lee, H.-Y., & Choi, J. H. (2026) · International Journal of Peptide Research and Therapeutics · doi:10.1007/s10989-026-10818-2
Spatial organization of myofibroblastic and complement-secreting CAFs in neuroendocrine tumorsPreprint
Niedra, H., Spriņģe, M. L., Tiltina, K., Pečulis, R., Saksis, R., Nazarovs, J., Ozoliņš, A., Vilisova, S., Senterjakova, N., Geriņa-Bērziņa, A., et al. (2026) · bioRxiv (Cold Spring Harbor Laboratory) · doi:10.64898/2026.02.26.708188
Chand, A. (2026) · Journal of Chemical Sciences · doi:10.1007/s12039-026-02481-3
Coggan, D. D., & Tong, F. (2026) · bioRxiv (Cold Spring Harbor Laboratory) · doi:10.64898/2026.04.23.720370
Implementation of Generative AI in Biomedical Research and Healthcare
Nikolopoulos, A., & Karalis, V. D. (2026) · Applied Biosciences · doi:10.3390/applbiosci5020034
Microbe-dependent inter-organ communication regulates germline stem cell proliferation in DrosophilaPreprint
Suyama, R., Zhao, M., Mori, H., Akiyoshi, H., Kawaguchi, S., Fatimah, R. M., Suzuki, Y., Arakawa, K., Yew, J. Y., & Kai, T. (2026) · bioRxiv (Cold Spring Harbor Laboratory) · doi:10.64898/2026.04.27.717131
Rojas, A. C., Brassard, J., Billaud, M., Lemaire, F., Chen, R., Tian, J., Orimi, H. E., Paraskevas, S., & Hoesli, C. A. (2026) · Cytotherapy · doi:10.1016/j.jcyt.2026.102407
Design of affinity ligands for human serum albumin
Yang, H., & Zhang, L. (2026) · Microchemical Journal · doi:10.1016/j.microc.2026.118263
Glover‐Kapfer, P., Song, Q., & Erb, J. (2026) · bioRxiv (Cold Spring Harbor Laboratory) · doi:10.64898/2026.05.01.722308
CRTAC1-A reprograms extracellular matrix viscoelasticity to constrain glioma progressionPreprint
Singh, V., Swadia, D., Saha, P., Nath, D., Deokate, N., & Rakshit, S. (2026) · bioRxiv (Cold Spring Harbor Laboratory) · doi:10.64898/2026.05.06.723198
Geiser, P., Westman, J., Ceylan, M., Bosman, W., von Beek, C., Artursson, P., Kjellén, L., Pelaseyed, T., & Sellin, M. E. (2026) · bioRxiv (Cold Spring Harbor Laboratory) · doi:10.64898/2026.05.11.724231
Recent advances in the molecular interactions of anti-cancer peptides with cellular targets
Zaeifi, D. (2026) · Life Sciences · doi:10.1016/j.lfs.2026.124454
Adhikary, K., & Dey, A. (2026) · bioRxiv (Cold Spring Harbor Laboratory) · doi:10.64898/2026.05.13.724818
Learning from Drops: AI-Guided Integration of Liquid Biopsy Features in Cancer StudiesPreprint
Andueza, M., Villoslada-Blanco, P., Dreuille, B. D., Alonso, L., Sabroso‐Lasa, S., Pantel, K., Alix‐Panabières, C., de Maturana, E. L., & Malats, N. (2026) · bioRxiv (Cold Spring Harbor Laboratory) · doi:10.64898/2026.05.12.724535
A single-nucleotide change in the Kozak sequence enhances protein expressionPreprint
Knol, R. A., Fariaby, T., de Vlieger, E. A., Kros, A., & Slütter, B. (2026) · bioRxiv (Cold Spring Harbor Laboratory) · doi:10.64898/2026.05.20.726450
Hadlová, P., Svatoň, M., Kochmannová, K., Korzhenevich, J., Schmidt, F., Neys, S. F. H., Bott, M.-T., Vrabcová, P., Staniek, J., Bloomfield, M., et al. (2026) · bioRxiv (Cold Spring Harbor Laboratory) · doi:10.64898/2026.05.24.727113
Sex-related structural alterations across common epilepsies: a worldwide ENIGMA studyPreprint
Wen, H., Wan, B., Gholipour, T., Xie, K., Chen, J., Serio, B., Hettwer, M. D., Alvim, M. K. M., Arienzo, D., João, R. B., et al. (2026) · bioRxiv (Cold Spring Harbor Laboratory) · doi:10.64898/2026.06.06.730611
Aschmann, D., Knol, R. A., Verbeet, W., Wijngaarden, S., Escalona-Rayo, O., Freire, R. V. M., Bertram, K., Tekkali, I., Bunzel, G., Fontein, B., et al. (2026) · bioRxiv (Cold Spring Harbor Laboratory) · doi:10.64898/2026.06.05.730351
FEABAS: A Stitching and Alignment Tool for Serial EM DataPreprint
Wu, Y., & Lichtman, J. W. (2026) · bioRxiv (Cold Spring Harbor Laboratory) · doi:10.64898/2026.06.07.730510
Sun, Y., Wang, J., Chen, W. C. W., Jiang, X., Wang, S. H., Zhi, J., Li, F., Feng, M., Niu, X., Ju, B., et al. (2026) · Science Advances · doi:10.1126/sciadv.aeg0376
Self-citationArtificial intelligence reshaping the gout diagnosis and treatment paradigm
Zhang, Y., Niu, B., Xu, W., Hua, Y., & Xia, D. (2026) · Journal of Pharmaceutical Analysis · doi:10.1016/j.jpha.2026.101702
Targeting the Undruggable: Deep Learning-Driven Design of Peptide Therapeutics in Cancer
Nguyen, H. T. N., Le, B. H. N., Van, N. T. H., Tran, T. T. T., & Nguyen, T. M. (2026) · Pharmaceuticals · doi:10.3390/ph19070998
Lu, J., Dong, R., Yang, S., Yuan, X., Wang, G., & Wang, J. (2026) · Journal of Enzyme Inhibition and Medicinal Chemistry · doi:10.1080/14756366.2026.2698689
Zhao, Y., Wang, F., Dong, X., Jia, G., Yu, L., Sun, Y., & Shi, Q. (2026) · Journal of Chromatography A · doi:10.1016/j.chroma.2026.467271
Gut Metabolism Links Precision Nutrition, Exercise, and Healthspan in Drosophila melanogaster
Wei, F., Liu, S., Sun, Y., Huang, H., Liu, J., Wang, F., & Fan, B. (2026) · Aging Cell · doi:10.1111/acel.70628
Ding, C., Luo, Y., Yu, X., Lei, Y., Zhang, W., Wang, X., & Gan, J. (2026) · Frontiers in Bioengineering and Biotechnology · doi:10.3389/fbioe.2026.1884032
Self-citationConfinement considerations for CRISPR toxin-antidote gene drive systemsPreprint
Xu, Z., Cho, Y. I., Zhang, X., & Champer, J. (2026) · bioRxiv (Cold Spring Harbor Laboratory) · doi:10.64898/2026.08.03.742636
A transposon origin of large tandem repeats in the butterfly Papilio bianorPreprint
Xiong, T., & Barbash, D. A. (2026) · bioRxiv (Cold Spring Harbor Laboratory) · doi:10.64898/2026.07.30.741882
Farooq, T., Hussain, M. D., Naeem, M., Bashir, N. H., Liu, Z., Vivekanandhan, P., Krutmuang, P., Huang, Y., & Chen, H. (2026) · Frontiers in Ecology and Evolution · doi:10.3389/fevo.2026.1901750
Wang, Z., Sun, L., Li, Y., Yang, F., & Chang, Y. (2026) · Journal of Pharmaceutical Analysis · doi:10.1016/j.jpha.2026.101754 · Cited by 1
Zhou, Y., Jiang, X., Zhang, X., Yao, X., Gao, Z., Chen, X., Gong, L., Jie, J., Yang, Y., & Yang, P. (2026) · Bioactive Materials · doi:10.1016/j.bioactmat.2026.08.027
Metadata
- Authors
- Chen, S., Lin, T., Basu, R., Ritchey, J., Wang, S., Luo, Y., Li, X., Pei, D., Kara, L. B., & Cheng, X.
- Affiliations
- The Ohio State University (US)
- Carnegie Mellon University (US)
- Nantong University (CN)
- Corresponding author
- Pei, Dehua
- Kara, Levent Burak
- Cheng, Xiaolin
- Venue
- Nature Communications
- Published
- 2024-02-21
- Volume
- 15
- Issue
- 1
- Pages
- 1611-1611
- ISSN
- 2041-1723 (ISSN-L)
- PMC
- PMC10882002
- OpenAlex
- W4392091326
- Cited by
- 324
- References
- 78
- Citations by year
- 2026: 121 · 2025: 158 · 2024: 44
- FWCI
- 68.33
- Type
- journal article
- Language
- en
- Open access
- gold
- doi.org
- Locations
- Nature Communications (publishedVersion, cc-by)
- Research Square (acceptedVersion, cc-by)
- PubMed Central (publishedVersion, cc-by-nc)
- PubMed (publishedVersion)
- RePEc: Research Papers in Economics (submittedVersion)
- DOAJ (DOAJ: Directory of Open Access Journals) (submittedVersion)
- Funders
- Ohio State University (P30CA016058)
- National Institutes of Health (1s10rr025660-01a1)
- National Cancer Institute (CA234124, R01CA234124, P30CA016058)
- National Institute of General Medical Sciences (R35GM122459)
- National Center for Research Resources (S10 RR025660)
- Topics
- Life Sciences › Pharmacology, Toxicology and Pharmaceutics › Drug Discovery › Computational Drug Discovery Methods
- Physical Sciences › Chemistry › Organic Chemistry › Chemical Synthesis and Analysis
- Life Sciences › Biochemistry, Genetics and Molecular Biology › Molecular Biology › Protein Structure and Dynamics
- Keywords
- β-catenin, NF-κB essential modulator, peptide sequence generation, binding affinity prediction, molecular dynamics simulation, structure-based drug design
- MeSH terms
- Deep Learning, Peptides, Protein Binding, NF-kappa B, beta Catenin, Molecular Dynamics Simulation
About these checks
Registry, retraction, Cites and statistics results are computed, not judged, with one exception: a printed reference that no index lists is read once by a model before it counts as a citation error. Claims are extracted by a model and kept only when their quote appears verbatim in the text; each cited source is then checked, with a model’s help, for whether it says what the claim relies on. Those verdicts can be wrong — read the claim’s quote and the cited source before relying on one.
Statistics and arithmetic are recomputed, not judged.
Confidence bands are shown only for fields calibrated on our annotated test set. None is calibrated yet, so no band is shown.
What counts as a claim ›How we measure confidence ›How we check this ›
Are you an author, or do you see a problem with this page? Request a review
