

The DOI matches its Crossref record; 5 of the 5 references it cites were found in a registry or an index.
Nerve growth factor receptor limits inflammation to promote remodeling and repair of osteoarthritic joints
Open accessPublished version of a preprint
Abstract
Osteoarthritis (OA) is a painful, incurable disease affecting over 500 million people. Recent clinical trials of the nerve growth factor (NGF) inhibitors in OA patients have suggested adverse effects of NGF inhibition on joint structure. Here we report that nerve growth factor receptor (NGFR) is upregulated in skeletal cells during OA and plays an essential role in the remodeling and repair of osteoarthritic joints. Specifically, NGFR is expressed in osteochondral cells but not in skeletal progenitor cells and induced by TNFα to attenuate NF-κB activation, maintaining proper BMP-SMAD1 signaling and suppressing RANKL expression in mice. NGFR deficiency hyper-activates NF-κB in murine osteoarthritic joints, which impairs bone formation and enhances bone resorption as exemplified by a reduction in subchondral bone and osteophytes. In human OA cartilage, NGFR is also negatively associated with NF-κB activation. Together, this study suggests a role of NGFR in limiting inflammation for repair of diseased skeletal tissues.
Overview
The claims and statistics of this paper haven’t been checked yet.
Run the check — free, no account needed. It reads the open-access text and checks the sources it cites.
Integrity signals
Registry
Cites
Statistics
Figures
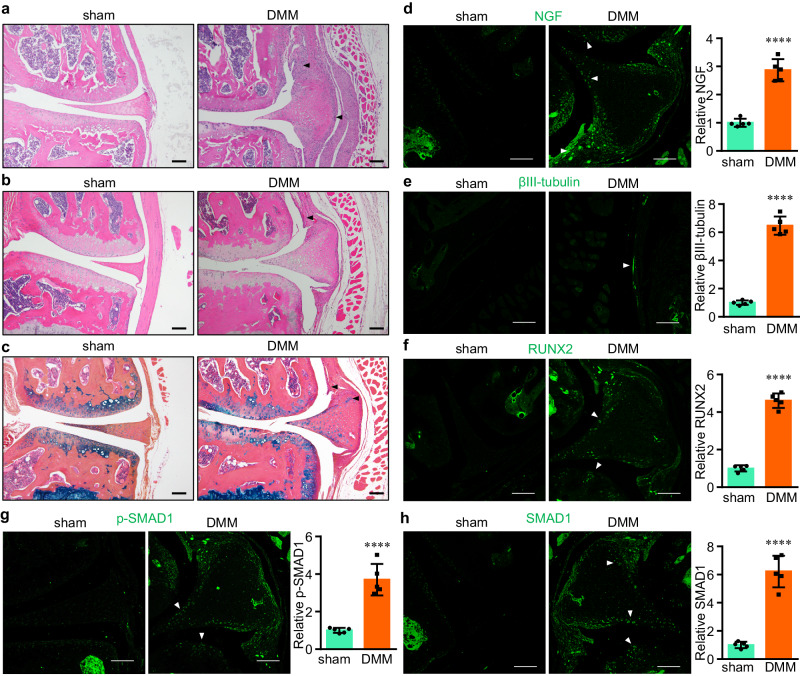
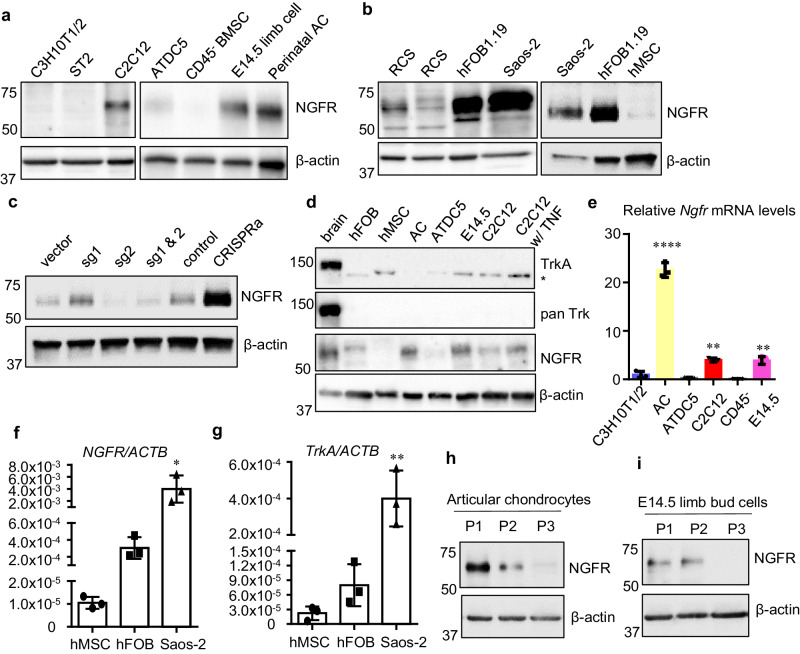
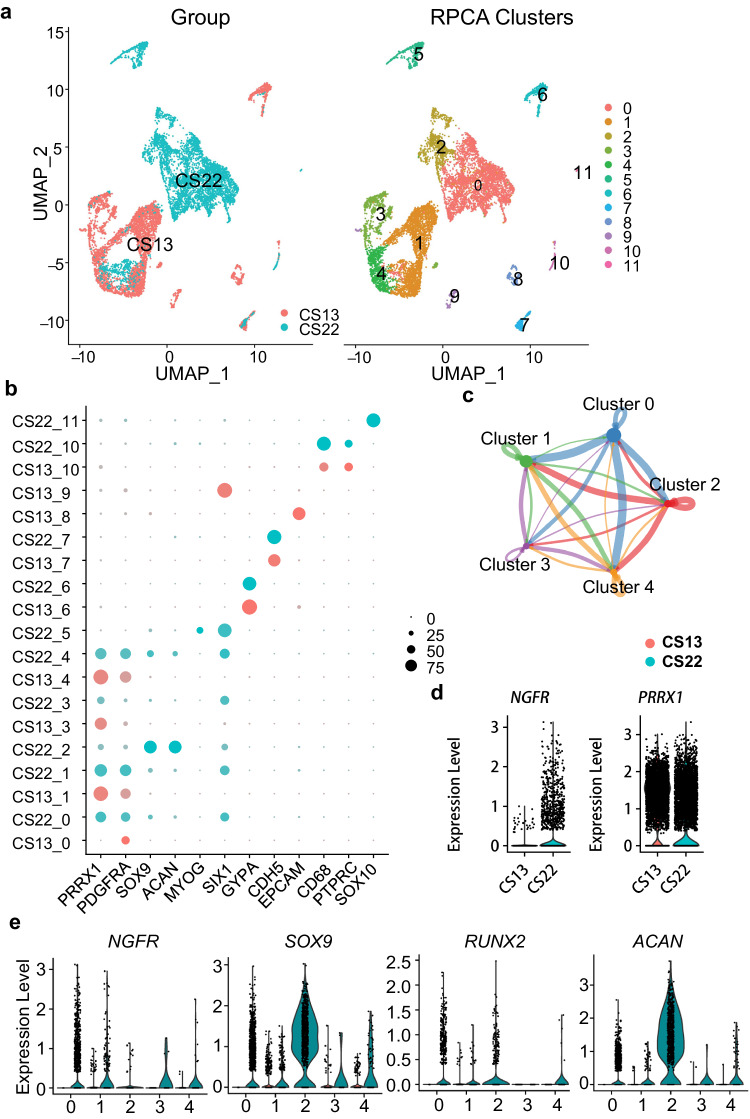
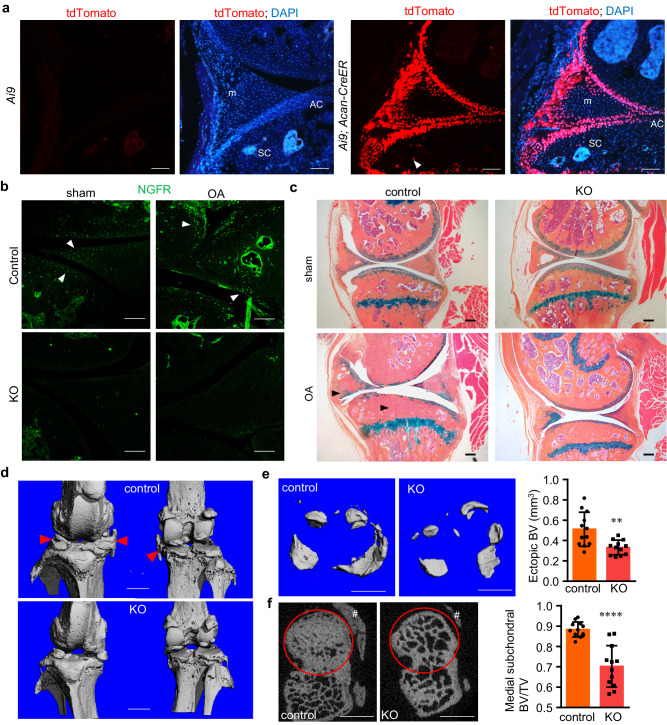
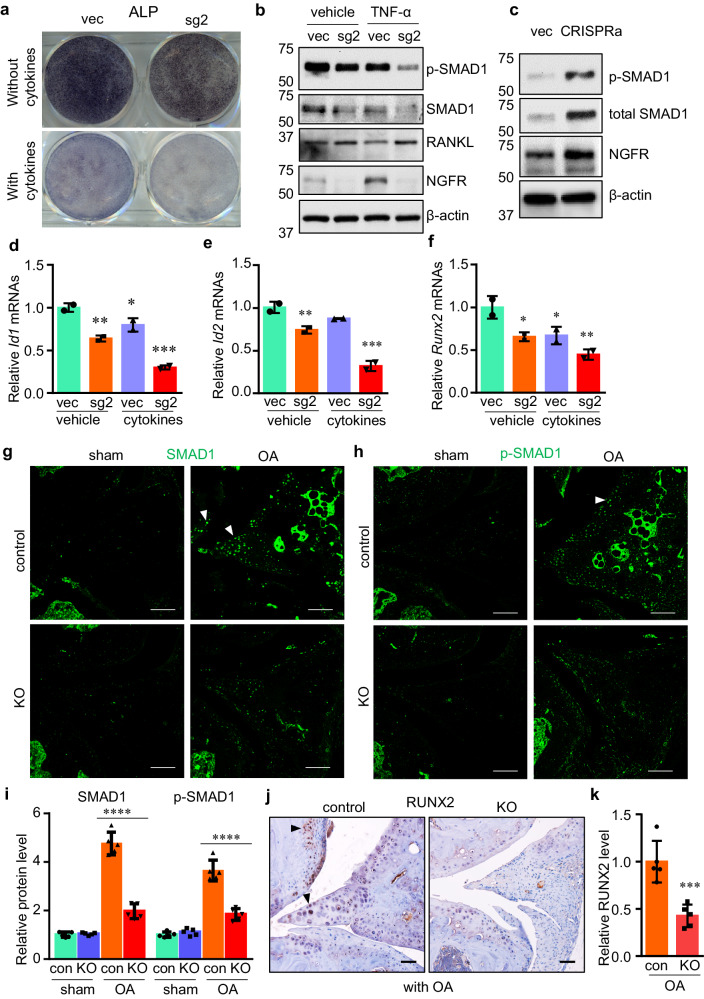
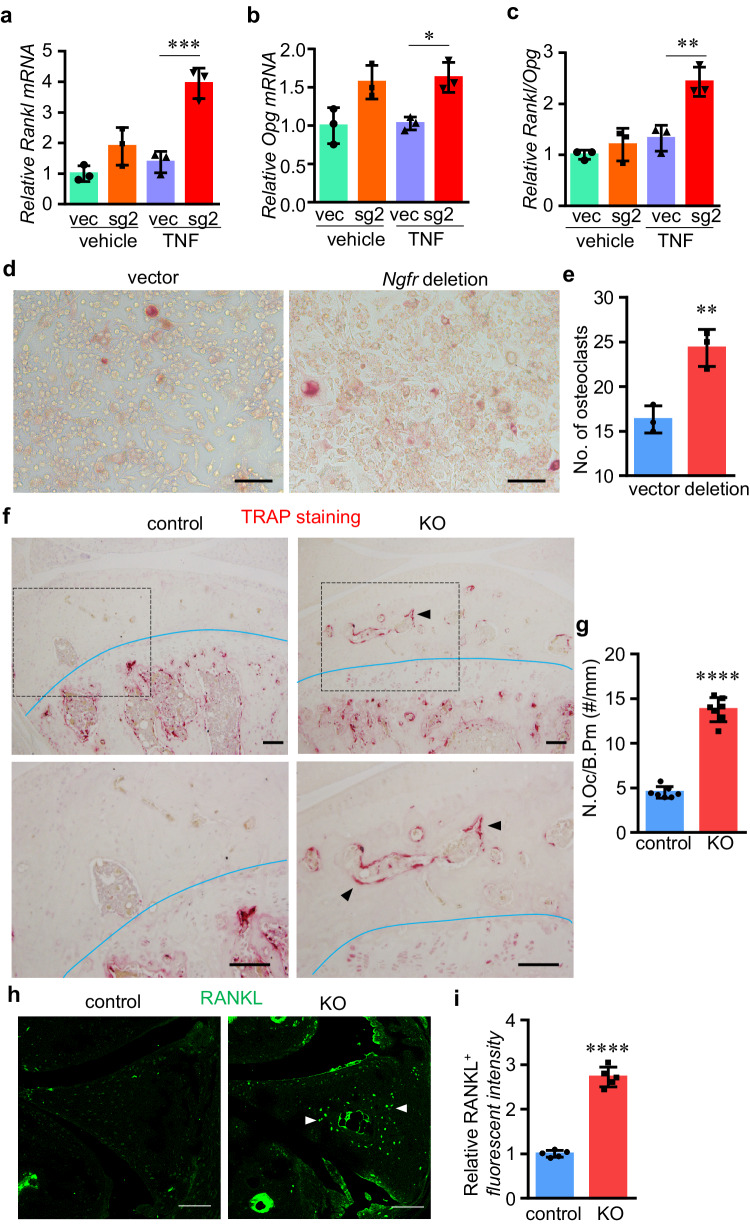
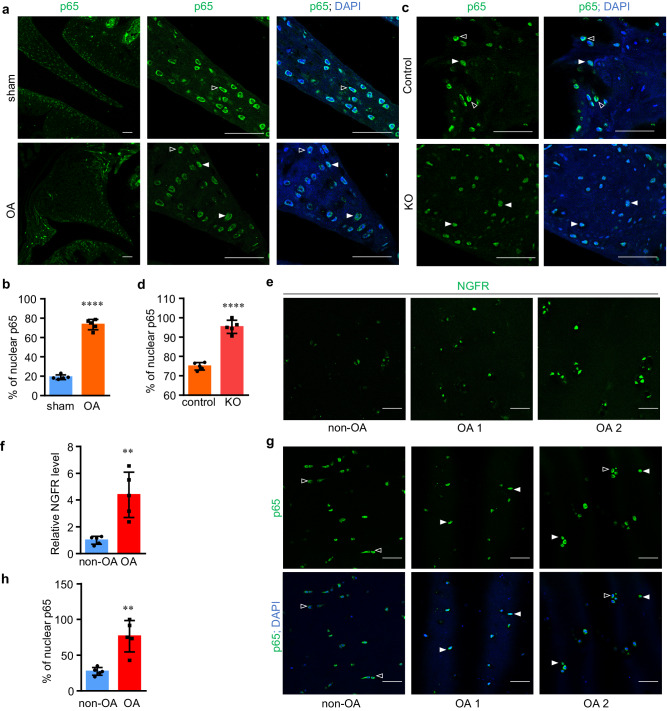
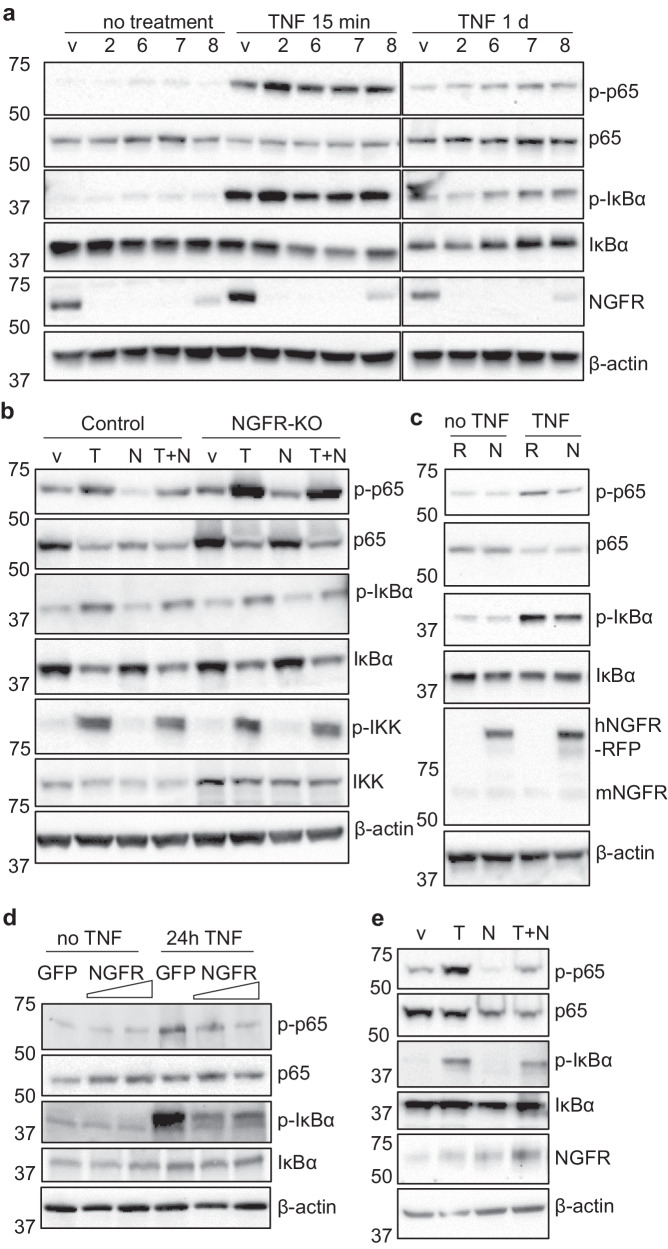
Verification
Claims the paper makes
The claims and statistics of this paper haven’t been checked yet.
Run the check — free, no account needed. It reads the open-access text and checks the sources it cites.
Claims other papers make about this one
Each is checked against this paper’s own text: does it say what the citing paper says it does?
The source backs part of the claim, not all of it — or backs it for a different population, condition or comparison.
In the citing paper
“Synovial macrophages and stromal cells, in turn, release cytokines and NGF that foster neurite sprouting and peripheral sensitization, establishing a self-reinforcing “pain–inflammation” feedback loop [66]”
From Interorgan Communications in Skeletal Pathophysiology: From Molecular Pathways to Multidisciplinary Therapies (2026) · cites this paper as [66]
Experimental — accuracy not yet measured
Self-check
Percentages, sums and reported differences re-computed from the paper’s own numbers.
The self-check needs the paper’s full text.
Citations
Cites
Genome-scale transcriptional activation by an engineered CRISPR-Cas9 complex
Konermann, S., Brigham, M. D., Trevino, A. E., Joung, J., Abudayyeh, O. O., Barcena, C., Hsu, P. D., Habib, N., Gootenberg, J. S., Nishimasu, H., et al. (2015) · Nature · doi:10.1038/nature14136 · Cited by 2,825 · cited 1×
“Although NGF is most commonly associated with pain, this relationship would have to be specifically investigated before this conclusion can be reached.”
The trk Proto-Oncogene Product: a Signal Transducing Receptor for Nerve Growth Factor
Kaplan, D. R., Hempstead, B. L., Martin-Zanca, D., Chao, M. V., & Parada, L. F. (1991) · Science · doi:10.1126/science.1850549 · Cited by 1,379
Goldring, S. R., & Goldring, M. B. (2016) · Nature Reviews Rheumatology · doi:10.1038/nrrheum.2016.148 · Cited by 896 · cited 8×
“The phenotype of conditional deletion mice is clearly demonstrated, and new information is gained from the study in addition to what is already known regarding NGF-TrkA signaling in OA.”
InfluentialTherapeutic options for targeting inflammatory osteoarthritis pain
Conaghan, P. G., Cook, A. D., Hamilton, J. A., & Tak, P. P. (2019) · Nature Reviews Rheumatology · doi:10.1038/s41584-019-0221-y · Cited by 405
CRISPR-mediated activation of a promoter or enhancer rescues obesity caused by haploinsufficiency
Matharu, N., Rattanasopha, S., Tamura, S., Maliskova, L., Wang, Y., Bernard, A., Hardin, A., Eckalbar, W. L., Vaisse, C., & Ahituv, N. (2019) · Science · doi:10.1126/science.aau0629 · Cited by 323
Research works printed but not linked: 64
- Hunter, D. J., March, L. & Chew, M. Osteoarthritis in 2020 and beyond: a Lancet Commission. Lancet 396, 1711–1712 (2020). · DOI
- Loeser, R. F., Goldring, S. R., Scanzello, C. R. & Goldring, M. B. Osteoarthritis: a disease of the joint as an organ. Arthritis Rheum. 64, 1697–1707 (2012). · DOI
- Pitsillides, A. A. & Beier, F. Cartilage biology in osteoarthritis-lessons from developmental biology. Nat. Rev. Rheumatol. 7, 654–663 (2011). · DOI
- Pap, T. & Korb-Pap, A. Cartilage damage in osteoarthritis and rheumatoid arthritis-two unequal siblings. Nat. Rev. Rheumatol. 11, 606–615 (2015). · DOI
- Berenbaum, F., Griffin, T. M. & Liu-Bryan, R. Review: metabolic regulation of inflammation in osteoarthritis. Arthritis Rheumatol 69, 9–21 (2017). · DOI
- Burr, D. B. & Gallant, M. A. Bone remodelling in osteoarthritis. Nat. Rev. Rheumatol. 8, 665–673 (2012). · DOI
- van der Kraan, P. M. & van den Berg, W. B. Osteophytes: relevance and biology. Osteoarthritis Cartilage 15, 237–244 (2007). · DOI
- Malfait, A. M. & Schnitzer, T. J. Towards a mechanism-based approach to pain management in osteoarthritis. Nat. Rev. Rheumatol. 9, 654–664 (2013). · DOI
- Aloe, L. Rita Levi-Montalcini: the discovery of nerve growth factor and modern neurobiology. Trends Cell Biol. 14, 395–399 (2004). · DOI
- Iannone, F. et al. Increased expression of nerve growth factor (NGF) and high affinity NGF receptor (p140 TrkA) in human osteoarthritic chondrocytes. Rheumatology (Oxford) 41, 1413–1418 (2002). · DOI
- Hochberg, M. C. et al. Long-term safety and efficacy of subcutaneous tanezumab versus nonsteroidal antiinflammatory drugs for hip or knee osteoarthritis: a randomized trial. Arthritis Rheumatol. 73, 1167–1177 (2021). · DOI · Paper page
- Wise, B. L., Seidel, M. F. & Lane, N. E. The evolution of nerve growth factor inhibition in clinical medicine. Nat. Rev. Rheumatol. 17, 34–46 (2021). · DOI
- Hochberg, M. C. et al. When is osteonecrosis not osteonecrosis?: adjudication of reported serious adverse joint events in the tanezumab clinical development program. Arthritis Rheumatol. 68, 382–391 (2016). · DOI
- Lievense, A. M., Bierma-Zeinstra, S. M., Verhagen, A. P., Verhaar, J. A. & Koes, B. W. Prognostic factors of progress of hip osteoarthritis: a systematic review. Arthritis Rheum. 47, 556–562 (2002). · DOI
- Shu, X. Q. & Mendell, L. M. Neurotrophins and hyperalgesia. Proc. Natl. Acad. Sci. USA 96, 7693–7696 (1999). · DOI · Paper page
- Verdi, J. M. et al. p75LNGFR regulates Trk signal transduction and NGF-induced neuronal differentiation in MAH cells. Neuron 12, 733–745 (1994). · DOI
- Huang, J., Zhao, L. & Chen, D. Growth factor signalling in osteoarthritis. Growth Factors 36, 187–195 (2018). · DOI
- Huang, J. et al. The microRNAs miR-204 and miR-211 maintain joint homeostasis and protect against osteoarthritis progression. Nat. Commun. 10, 2876 (2019). · DOI
- Liao, L. et al. Acute synovitis after trauma precedes and is associated with osteoarthritis onset and progression. Int. J. Biol. Sci. 16, 970–980 (2020). · DOI
- Denk, F., Bennett, D. L. & McMahon, S. B. Nerve growth factor and pain mechanisms. Annu. Rev. Neurosci. 40, 307–325 (2017). · DOI
- Quirici, N. et al. Isolation of bone marrow mesenchymal stem cells by anti-nerve growth factor receptor antibodies. Exp. Hematol. 30, 783–791 (2002). · DOI
- Tormin, A. et al. CD146 expression on primary nonhematopoietic bone marrow stem cells is correlated with in situ localization. Blood 117, 5067–5077 (2011). · DOI · Paper page
- Mabuchi, Y. et al. LNGFR(+)THY-1(+)VCAM-1(hi+) cells reveal functionally distinct subpopulations in mesenchymal stem cells. Stem Cell Rep. 1, 152–165 (2013). · DOI
- Severe, N. et al. Stress-induced changes in bone marrow stromal cell populations revealed through single-cell protein expression mapping. Cell Stem Cell 25, 570–583.e577 (2019). · DOI
- Lee, K. F. et al. Targeted mutation of the gene encoding the low affinity NGF receptor p75 leads to deficits in the peripheral sensory nervous system. Cell 69, 737–749 (1992). · DOI
- Bogenmann, E. et al. Generation of mice with a conditional allele for the p75(NTR) neurotrophin receptor gene. Genesis 49, 862–869 (2011). · DOI
- Glasson, S. S., Blanchet, T. J. & Morris, E. A. The surgical destabilization of the medial meniscus (DMM) model of osteoarthritis in the 129/SvEv mouse. Osteoarthritis Cartilage 15, 1061–1069 (2007). · DOI
- Sanchez-Lopez, E., Coras, R., Torres, A., Lane, N. E. & Guma, M. Synovial inflammation in osteoarthritis progression. Nat. Rev. Rheumatol. 18, 258–275 (2022). · DOI
- Zhao, L. et al. Exploration of CRISPR/Cas9-based gene editing as therapy for osteoarthritis. Ann. Rheum. Dis. 78, 676–682 (2019). · DOI
- Wu, M., Chen, G. & Li, Y. P. TGF-β and BMP signaling in osteoblast, skeletal development, and bone formation, homeostasis and disease. Bone Res. 4, 16009 (2016). · DOI · Paper page
- Reznikoff, C. A., Brankow, D. W. & Heidelberger, C. Establishment and characterization of a cloned line of C3H mouse embryo cells sensitive to postconfluence inhibition of division. Cancer Res. 33, 3231–3238 (1973).
- Ogawa, M. et al. B cell ontogeny in murine embryo studied by a culture system with the monolayer of a stromal cell clone, ST2: B cell progenitor develops first in the embryonal body rather than in the yolk sac. EMBO J. 7, 1337–1343 (1988). · DOI
- Atsumi, T., Miwa, Y., Kimata, K. & Ikawa, Y. A chondrogenic cell line derived from a differentiating culture of AT805 teratocarcinoma cells. Cell Differ. Dev. 30, 109–116 (1990). · DOI
- Gosset, M., Berenbaum, F., Thirion, S. & Jacques, C. Primary culture and phenotyping of murine chondrocytes. Nat. Protoc. 3, 1253–1260 (2008). · DOI
- He, J. et al. Dissecting human embryonic skeletal stem cell ontogeny by single-cell transcriptomic and functional analyses. Cell Res. 31, 742–757 (2021). · DOI
- Duchamp de Lageneste, O. et al. Periosteum contains skeletal stem cells with high bone regenerative potential controlled by Periostin. Nat. Commun. 9, 773 (2018). · DOI
- Zhou, X. et al. Chondrocytes transdifferentiate into osteoblasts in endochondral bone during development, postnatal growth and fracture healing in mice. PLoS Genet. 10, e1004820 (2014). · DOI
- Ono, N., Ono, W., Nagasawa, T. & Kronenberg, H. M. A subset of chondrogenic cells provides early mesenchymal progenitors in growing bones. Nat. Cell Biol. 16, 1157–1167 (2014). · DOI
- Scanzello, C. R. et al. Local cytokine profiles in knee osteoarthritis: elevated synovial fluid interleukin-15 differentiates early from end-stage disease. Osteoarthritis Cartilage 17, 1040–1048 (2009). · DOI
- Berenbaum, F. Osteoarthritis as an inflammatory disease (osteoarthritis is not osteoarthrosis!). Osteoarthritis Cartilage 21, 16–21 (2013). · DOI · Paper page
- Zhao, B. TNF and bone remodeling. Curr Osteoporos Rep 15, 126–134 (2017). · DOI
- Zhao, L. et al. Tumor necrosis factor inhibits mesenchymal stem cell differentiation into osteoblasts via the ubiquitin E3 ligase Wwp1. Stem Cells 29, 1601–1610 (2011). · DOI
- Zhang, Q., Lenardo, M. J. & Baltimore, D. 30 Years of NF-κB: a blossoming of relevance to human pathobiology. Cell 168, 37–57 (2017). · DOI
- Diarra, D. et al. Dickkopf-1 is a master regulator of joint remodeling. Nat. Med. 13, 156–163 (2007). · DOI
- Wei, J. L. et al. Role of ADAMTS-12 in protecting against inflammatory arthritis in mice by interacting with and inactivating proinflammatory connective tissue growth factor. Arthritis Rheumatol. 70, 1745–1756 (2018). · DOI
- Bouta, E. M. et al. Brief Report: treatment of tumor necrosis factor-transgenic mice with anti-tumor necrosis factor restores lymphatic contractions, repairs lymphatic vessels, and may increase monocyte/macrophage egress. Arthritis Rheumatol. 69, 1187–1193 (2017). · DOI
- Perry, M. J., Gujra, S., Whitworth, T. & Tobias, J. H. Tamoxifen stimulates cancellous bone formation in long bones of female mice. Endocrinology 146, 1060–1065 (2005). · DOI
- Zhang, Z. et al. Estrogen receptor alpha in the brain mediates tamoxifen-induced changes in physiology in mice. Elife 10, https://doi.org/10.7554/eLife.63333 (2021). · DOI
- Tomlinson, R. E. et al. NGF-TrkA signaling in sensory nerves is required for skeletal adaptation to mechanical loads in mice. Proc. Natl Acad. Sci. USA 114, E3632–e3641 (2017). · DOI
- Li, Z. et al. Fracture repair requires TrkA signaling by skeletal sensory nerves. J. Clin. Investig. 129, 5137–5150 (2019). · DOI
- Lee, S. et al. NGF-TrkA signaling dictates neural ingrowth and aberrant osteochondral differentiation after soft tissue trauma. Nat. Commun. 12, 4939 (2021). · DOI
- Xu, J. et al. NGF-p75 signaling coordinates skeletal cell migration during bone repair. Sci. Adv. 8, eabl5716 (2022). · DOI
- Henry, S. P. et al. Generation of aggrecan-CreERT2 knockin mice for inducible Cre activity in adult cartilage. Genesis 47, 805–814 (2009). · DOI
- Madisen, L. et al. A robust and high-throughput Cre reporting and characterization system for the whole mouse brain. Nat. Neurosci. 13, 133–140 (2010). · DOI · Paper page
- Zhao, L. et al. Smurf1 inhibits mesenchymal stem cell proliferation and differentiation into osteoblasts through JunB degradation. J. Bone Miner. Res. 25, 1246–1256 (2010). · DOI
- Cao, H. et al. Activating transcription factor 4 regulates osteoclast differentiation in mice. J. Clin. Investig. 120, 2755–2766 (2010). · DOI
- Sanjana, N. E., Shalem, O. & Zhang, F. Improved vectors and genome-wide libraries for CRISPR screening. Nat. Methods 11, 783–784 (2014). · DOI · Paper page
- Huang, J., Zhao, L., Xing, L. & Chen, D. MicroRNA-204 regulates Runx2 protein expression and mesenchymal progenitor cell differentiation. Stem Cells 28, 357–364 (2010). · DOI
- Huang, J., Lai, Y., Li, J. & Zhao, L. Loss of miR-204 and miR-211 shifts osteochondral balance and causes temporomandibular joint osteoarthritis. J. Cell. Physiol. https://doi.org/10.1002/jcp.31120 (2023). · DOI
- Fan, Y. et al. Serum miRNAs are potential biomarkers for the detection of disc degeneration, among which miR-26a-5p suppresses Smad1 to regulate disc homeostasis. J. Cell. Mol. Med. 23, 6679–6689 (2019). · DOI
- Fan, Y., Zhao, L., Lai, Y., Lu, K. & Huang, J. CRISPR-Cas9-mediated loss of function of β-catenin attenuates intervertebral disc degeneration. Mol. Ther. Nucleic Acids 28, 387–396 (2022). · DOI
- Krenn, V. et al. Synovitis score: discrimination between chronic low-grade and high-grade synovitis. Histopathology 49, 358–364 (2006). · DOI
- Hao, Y. et al. Dictionary learning for integrative, multimodal and scalable single-cell analysis. Nat. Biotechnol. https://doi.org/10.1038/s41587-023-01767-y (2023). · DOI · Paper page
- Jin, S. et al. Inference and analysis of cell-cell communication using CellChat. Nat. Commun. 12, 1088 (2021). · DOI · Paper page
Cited by
Sorted by citations
Positive Allosteric Modulators of Trk Receptors for the Treatment of Alzheimer’s Disease
Forsell, P., Parrado Fernández, C., Nilsson, B., Sandin, J., Nordvall, G., & Segerdahl, M. (2024) · Pharmaceuticals · doi:10.3390/ph17080997 · Cited by 14
Gan, D., Qin, L., & Xiao, G. (2026) · Research · doi:10.34133/research.1319 · Cited by 1
Metadata
- Authors
- Zhao, L., Lai, Y., Jiao, H., & Huang, J.
- Affiliations
- Rush University Medical Center (US)
- Corresponding author
- Huang, Jian
- Venue
- Nature Communications
- Published
- 2024-04-15
- Volume
- 15
- Issue
- 1
- Pages
- 3225-3225
- ISSN
- 2041-1723 (ISSN-L)
- PMC
- PMC11018862
- OpenAlex
- W4394818993
- Cited by
- 69
- References
- 5
- Citations by year
- 2026: 28 · 2025: 30 · 2024: 11
- FWCI
- 22.34
- Type
- journal article
- Language
- en
- Open access
- gold
- doi.org
- Locations
- Nature Communications (publishedVersion, cc-by)
- bioRxiv (Cold Spring Harbor Laboratory) (acceptedVersion, cc-by-nc-nd)
- PubMed Central (publishedVersion, cc-by)
- PubMed (publishedVersion)
- PubMed Central (submittedVersion, cc-by-nc-nd)
- RePEc: Research Papers in Economics (submittedVersion)
- DOAJ (DOAJ: Directory of Open Access Journals) (submittedVersion, cc-by-sa)
- Funders
- U.S. Department of Health & Human Services | NIH | National Institute of Arthritis and Musculoskeletal and Skin Diseases (R01AR070222, R01AR070222-04S1)
- Topics
- Health Sciences › Medicine › Rheumatology › Osteoarthritis Treatment and Mechanisms
- Life Sciences › Biochemistry, Genetics and Molecular Biology › Molecular Biology › Bone Metabolism and Diseases
- Life Sciences › Biochemistry, Genetics and Molecular Biology › Cell Biology › Proteoglycans and glycosaminoglycans research
- Keywords
- nerve growth factor receptor, osteoarthritis, joint remodeling, joint repair, NF-κB activation, TNF-α, RANKL, subchondral bone, osteophytes, bone formation, bone resorption, cartilage, inflammation, skeletal progenitor cells
About these checks
Registry, retraction, Cites and statistics results are computed, not judged, with one exception: a printed reference that no index lists is read once by a model before it counts as a citation error. Claims are extracted by a model and kept only when their quote appears verbatim in the text; each cited source is then checked, with a model’s help, for whether it says what the claim relies on. Those verdicts can be wrong — read the claim’s quote and the cited source before relying on one.
Statistics and arithmetic are recomputed, not judged.
Confidence bands are shown only for fields calibrated on our annotated test set. None is calibrated yet, so no band is shown.
What counts as a claim ›How we measure confidence ›How we check this ›
Are you an author, or do you see a problem with this page? Request a review
