

The DOI matches its Crossref record; 5 of the 5 references it cites were found in a registry or an index.
Structural basis for IL-33 recognition and its antagonism by the helminth effector protein HpARI2
Abstract
IL-33 plays a significant role in inflammation, allergy, and host defence against parasitic helminths. The model gastrointestinal nematode Heligmosomoides polygyrus bakeri secretes the Alarmin Release Inhibitor HpARI2, an effector protein that suppresses protective immune responses and asthma in its host by inhibiting IL-33 signalling. Here we reveal the structure of HpARI2 bound to mouse IL-33. HpARI2 contains three CCP-like domains, and we show that it contacts IL-33 primarily through the second and third of these. A large loop which emerges from CCP3 directly contacts IL-33 and structural comparison shows that this overlaps with the binding site on IL-33 for its receptor, ST2, preventing formation of a signalling complex. Truncations of HpARI2 which lack the large loop from CCP3 are not able to block IL-33-mediated signalling in a cell-based assay and in an in vivo female mouse model of asthma. This shows that direct competition between HpARI2 and ST2 is responsible for suppression of IL-33-dependent responses.
Overview
The claims and statistics of this paper haven’t been checked yet.
Run the check — free, no account needed. It reads the open-access text and checks the sources it cites.
Integrity signals
Registry
Cites
Statistics
Figures
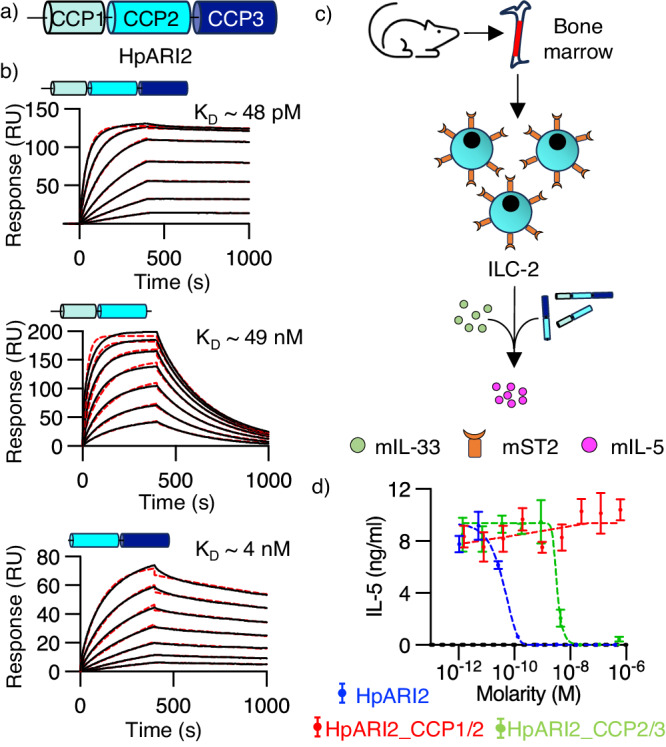
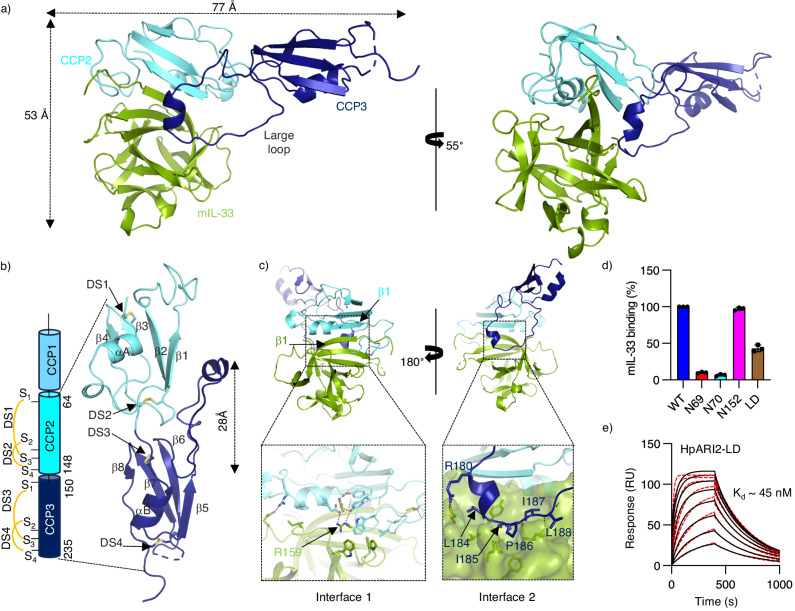
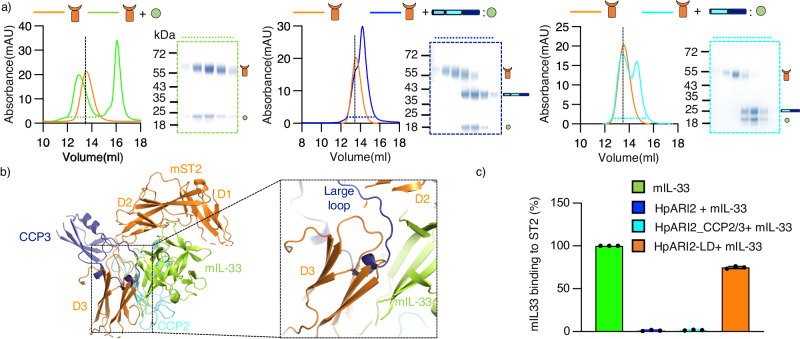
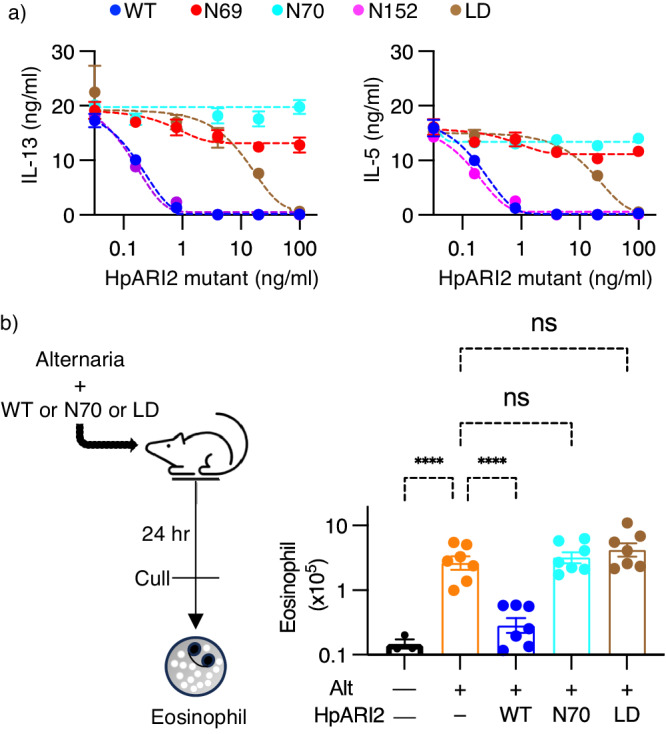
Verification
Claims the paper makes
The claims and statistics of this paper haven’t been checked yet.
Run the check — free, no account needed. It reads the open-access text and checks the sources it cites.
Claims other papers make about this one
Each is checked against this paper’s own text: does it say what the citing paper says it does?
In the citing paper
“and consequently prevents eosinophil activation in response to Alternaria allergens”
From Parasites and allergies: a complex bidirectional relationship from evolutionary origins to modern therapeutics (2026) · cites this paper as Jamwal et al. 2024
In the citing paper
“a key cytokine that initiates allergic responses”
From Parasites and allergies: a complex bidirectional relationship from evolutionary origins to modern therapeutics (2026) · cites this paper as Jamwal et al. 2024
In the citing paper
“One example is Hp-ARI (alarmin release inhibitor) isolated from the nematode H. polygyrus. This substance inhibits interleukin-33”
From Parasites and allergies: a complex bidirectional relationship from evolutionary origins to modern therapeutics (2026) · cites this paper as Jamwal et al. 2024
Self-check
Percentages, sums and reported differences re-computed from the paper’s own numbers.
The self-check needs the paper’s full text.
Citations
Cites
Highly accurate protein structure prediction with AlphaFold
Jumper, J., Evans, R., Pritzel, A., Green, T., Figurnov, M., Ronneberger, O., Tunyasuvunakool, K., Bates, R., Žídek, A., Potapenko, A., et al. (2021) · Nature · doi:10.1038/s41586-021-03819-2 · Cited by 43,764
Accurate assessment of mass, models and resolution by small-angle scattering
Rambo, R. P., & Tainer, J. A. (2013) · Nature · doi:10.1038/nature12070 · Cited by 750
HpARI protein secreted by a helminth parasite suppresses interleukin-33
Osbourn, M., Soares, D. C., Vacca, F., Cohen, E. S., Scott, I. C., Gregory, W. F., Smyth, D. J., Toivakka, M., Kemter, A. M., le Bihan, T., et al. (2017) · Immunity · doi:10.1016/j.immuni.2017.09.015 · Cited by 178
Self-citationMcSorley, H. J., Blair, N. F., Smith, K. A., McKenzie, A. N. J., & Maizels, R. M. (2014) · Mucosal Immunology · doi:10.1038/mi.2013.123 · Cited by 163
Self-citationHristova, M., Habibovic, A., Veith, C., Janssen-Heininger, Y. M. W., Dixon, A. E., Geiszt, M., & van der Vliet, A. (2016) · Journal of Allergy and Clinical Immunology · doi:10.1016/j.jaci.2015.10.003 · Cited by 141
Research works printed but not linked: 44
- McSorley, H. J. & Smyth, D. J. IL-33: A central cytokine in helminth infections. Semin Immunol. 53, 101532 (2021). · DOI
- Liew, F. Y., Girard, J. P. & Turnquist, H. R. Interleukin-33 in health and disease. Nat. Rev. Immunol. 16, 676–689 (2016). · DOI
- Roussel, L., Erard, M., Cayrol, C. & Girard, J. P. Molecular mimicry between IL-33 and KSHV for attachment to chromatin through the H2A-H2B acidic pocket. EMBO Rep. 9, 1006–1012 (2008). · DOI
- Cayrol, C. & Girard, J. P. Interleukin-33 (IL-33): a critical review of its biology and the mechanisms involved in its release as a potent extracellular cytokine. Cytokine 156, 155891 (2022). · DOI
- Chan, B. C. L., Lam, C. W. K., Tam, L. S. & Wong, C. K. IL33: Roles in allergic inflammation and therapeutic perspectives. Front. Immunol. 10, 364 (2019). · DOI
- Schmitz, J. et al. IL-33, an interleukin-1-like cytokine that signals via the IL-1 receptor-related protein ST2 and induces T helper type 2-associated cytokines. Immunity 23, 479–490 (2005). · DOI
- Lefrancais, E. et al. Central domain of IL-33 is cleaved by mast cell proteases for potent activation of group-2 innate lymphoid cells. Proc. Natl Acad. Sci. USA 111, 15502–15507 (2014). · DOI
- Gunther, S. et al. IL-1 family cytokines use distinct molecular mechanisms to signal through their shared co-receptor. Immunity 47, 510–523.e4 (2017). · DOI
- Cohen, E. S. et al. Oxidation of the alarmin IL-33 regulates ST2-dependent inflammation. Nat. Commun. 6, 8327 (2015). · DOI
- Maizels, R. M. & McSorley, H. J. Regulation of the host immune system by helminth parasites. J. Allergy Clin. Immunol. 138, 666–675 (2016). · DOI · Paper page
- Maizels, R. M. Regulation of immunity and allergy by helminth parasites. Allergy 75, 524–534 (2020). · DOI · Paper page
- Johnston, C. J. C. et al. A structurally distinct TGF-beta mimic from an intestinal helminth parasite potently induces regulatory T cells. Nat. Commun. 8, 1741 (2017). · DOI · Paper page
- Vacca, F. et al. A helminth-derived suppressor of ST2 blocks allergic responses. Elife 9, e54017 (2020). · DOI
- Colomb, F. et al. IL-33-binding HpARI family homologues with divergent effects in suppressing or enhancing type 2 immune responses. Infect. Immun. 92, e0039523 (2024). · DOI
- Chauche, C. et al. A truncated form of HpARI stabilizes IL-33, amplifying responses to the cytokine. Front Immunol. 11, 1363 (2020). · DOI
- Curren, B. et al. IL-33-induced neutrophilic inflammation and NETosis underlie rhinovirus-triggered exacerbations of asthma. Mucosal Immunol. 16, 671–684 (2023). · DOI
- Meiners, J. et al. IL-33 facilitates rapid expulsion of the parasitic nematode strongyloides ratti from the intestine via ILC2- and IL-9-driven mast cell activation. PLoS Pathog. 16, e1009121 (2020). · DOI
- Block, K. E. et al. Physiological microbial exposure transiently inhibits mouse lung ILC2 responses to allergens. Nat. Immunol. 23, 1703–1713 (2022). · DOI
- Chen, W. Y., Tsai, T. H., Yang, J. L. & Li, L. C. Therapeutic strategies for targeting IL-33/ST2 signalling for the treatment of Inflammatory Diseases. Cell Physiol. Biochem. 49, 349–358 (2018). · DOI
- Kelsen, S. G. et al. Astegolimab (anti-ST2) efficacy and safety in adults with severe asthma: a randomized clinical trial. J. Allergy Clin. Immunol. 148, 790–798 (2021). · DOI
- Wechsler, M. E. et al. Efficacy and safety of itepekimab in patients with moderate-to-severe asthma. N. Engl. J. Med. 385, 1656–1668 (2021). · DOI
- England, E. et al. Tozorakimab (MEDI3506): an anti-IL-33 antibody that inhibits IL-33 signalling via ST2 and RAGE/EGFR to reduce inflammation and epithelial dysfunction. Sci. Rep. 13, 9825 (2023). · DOI
- Okragly, A. J. et al. Generation and characterization of torudokimab (LY3375880): a monoclonal antibody that neutralizes interleukin-33. J. Inflamm. Res. 14, 3823–3835 (2021). · DOI
- Holm, L. Dali server: structural unification of protein families. Nucleic Acids Res. 50, W210–W215 (2022). · DOI
- Liu, X. et al. Structural insights into the interaction of IL-33 with its receptors. Proc. Natl Acad. Sci. USA 110, 14918–14923 (2013). · DOI
- Strickson, S. et al. Oxidised IL-33 drives COPD epithelial pathogenesis via ST2-independent RAGE/EGFR signalling complex. Eur. Respir. J. 62, 2202210 (2023). · DOI
- Drurey, C. et al. Intestinal epithelial tuft cell induction is negated by a murine helminth and its secreted products. J. Exp. Med. 219, e20211140 (2022). · DOI
- de Oliveira, M. F. A., Talvani, A. & Rocha-Vieira, E. IL-33 in obesity: where do we go from here? Inflamm. Res. 68, 185–194 (2019). · DOI
- Winter, G. et al. DIALS: implementation and evaluation of a new integration package. Acta Crystallogr. D. Struct. Biol. 74, 85–97 (2018). · DOI
- McCoy, A. J. et al. Phaser crystallographic software. J. Appl Crystallogr 40, 658–674 (2007). · DOI · Paper page
- Emsley, P., Lohkamp, B., Scott, W. G. & Cowtan, K. Features and development of Coot. Acta Crystallogr D. Biol. Crystallogr 66, 486–501 (2010). · DOI · Paper page
- Afonine, P. V. et al. Towards automated crystallographic structure refinement with phenix.refine. Acta Crystallogr D. Biol. Crystallogr 68, 352–367 (2012). · DOI · Paper page
- Bricogne G. et al BUSTER version 2.10.4. Cambridge, United Kingdom: Global Phasing Ltd. https://www.globalphasing.com/buster/wiki/index.cgi?BusterCite (2017).
- Adams, P. D. et al. PHENIX: a comprehensive python-based system for macromolecular structure solution. Acta Crystallogr D. Biol. Crystallogr. 66, 213–221 (2010). · DOI · Paper page
- Hopkins, J. B., Gillilan, R. E. & Skou, S. BioXTAS RAW: improvements to a free open-source program for small-angle X-ray scattering data reduction and analysis. J. Appl. Crystallogr. 50, 1545–1553 (2017). · DOI
- Panjkovich, A.S.D.I. CHROMIXS: automatic and interactive analysis of chromatography-coupled small angle X-ray scattering data. Bioinformatics 34, 1944–1946 (2017). · DOI
- Franke, D. et al. ATSAS 2.8: a comprehensive data analysis suite for small-angle scattering from macromolecular solutions. J. Appl. Crystallogr. 50, 1212–1225 (2017). · DOI
- Svergun, D. I. Determination of the regularization parameter in indirect-transform methods using perceptual criteria. J. Appl. Crystallogr. 25, 495–503 (1992). · DOI
- Franke, D. & Svergun, D. I. DAMMIF, a program for rapid ab-initio shape determination in small-angle scattering. J. Appl. Crystallogr. 42, 342–346 (2009). · DOI · Paper page
- Grawert, T. W. & Svergun, D. I. Structural modeling using solution small-angle x-ray scattering (SAXS). J. Mol. Biol. 432, 3078–3092 (2020). · DOI
- Svergun, D. I. Restoring low resolution structure of biological macromolecules from solution scattering using simulated annealing. Biophys. J. 76, 2879–2886 (1999). · DOI
- Wriggers, W. Conventions and workflows for using situs. Acta Crystallogr. D. Biol. Crystallogr 68, 344–351 (2012). · DOI
- Pettersen, E. F. et al. UCSF chimera-a visualization system for exploratory research and analysis. J. Comput. Chem. 25, 1605–1612 (2004). · DOI
- Putnam, D. K., Lowe, E. W. Jr. & Meiler, J. Reconstruction of SAXS profiles from protein structures. Comput Struct. Biotechnol. J. 8, e201308006 (2013). · DOI
Cited by
Sorted by citations
Packi, K., Świerczewski, D., Klimczak, S., Ochab, D., Gałęziewska, J., Gromek, P., Kruczkowska, W., Płuciennik, E., Kałuzińska-Kołat, Ż., & Kołat, D. (2026) · Antonie van Leeuwenhoek · doi:10.1007/s10482-026-02425-4
Metadata
- Authors
- Jamwal, A., Colomb, F., McSorley, H. J., & Higgins, M. K.
- Venue
- Nature Communications
- Published
- 2024-06-19
- Volume
- 15
- Issue
- 1
- ISSN
- 2041-1723
- PMC
- PMC11189471
- Cited by
- 15
- References
- 5
- Language
- en
- Funders
- Wellcome Trust (221914/Z/20/Z)
About these checks
Registry, retraction, Cites and statistics results are computed, not judged, with one exception: a printed reference that no index lists is read once by a model before it counts as a citation error. Claims are extracted by a model and kept only when their quote appears verbatim in the text; each cited source is then checked, with a model’s help, for whether it says what the claim relies on. Those verdicts can be wrong — read the claim’s quote and the cited source before relying on one.
Statistics and arithmetic are recomputed, not judged.
Confidence bands are shown only for fields calibrated on our annotated test set. None is calibrated yet, so no band is shown.
What counts as a claim ›How we measure confidence ›How we check this ›
Are you an author, or do you see a problem with this page? Request a review
