

Lineage-informative microhaplotypes for recurrence classification and spatio-temporal surveillance of Plasmodium vivax malaria parasites
Open accessThe DOI matches its Crossref record; 56 of the 56 references it cites were found in a registry or an index; none of the 54 sources its claims cite is checked for support yet.
Abstract
Challenges in classifying recurrent Plasmodium vivax infections constrain surveillance of antimalarial efficacy and transmission. Recurrent infections may arise from activation of dormant liver stages (relapse), blood-stage treatment failure (recrudescence) or reinfection. Molecular inference of familial relatedness (identity-by-descent or IBD) can help resolve the probable origin of recurrences. As whole genome sequencing of P. vivax remains challenging, targeted genotyping methods are needed for scalability. We describe a P. vivax marker discovery framework to identify and select panels of microhaplotypes (multi-allelic markers within small, amplifiable segments of the genome) that can accurately capture IBD. We evaluate panels of 50–250 microhaplotypes discovered in a global set of 615 P. vivax genomes. A candidate global 100-microhaplotype panel exhibits high marker diversity in the Asia-Pacific, Latin America and horn of Africa (median H E = 0.70–0.81) and identifies 89% of the polyclonal infections detected with genome-wide datasets. Data simulations reveal lower error in estimating pairwise IBD using microhaplotypes relative to traditional biallelic SNP barcodes. The candidate global panel also exhibits high accuracy in predicting geographic origin and captures local infection outbreak and bottlenecking events. Our framework is open-source enabling customised microhaplotype discovery and selection, with potential for porting to other species or data resources.
Overview
CoChat Summary
TL;DR
The paper describes an open-source framework to discover and select *Plasmodium vivax* microhaplotype panels that capture identity-by-descent (IBD) for classifying recurrent infections and for spatio-temporal surveillance. A candidate global 100-microhaplotype panel shows high diversity, better IBD estimation than traditional biallelic SNP barcodes, and utility for geographic origin prediction and outbreak detection.
Key findings
- A candidate global 100-microhaplotype panel exhibited high marker diversity in the Asia-Pacific, Latin America and horn of Africa (median HE = 0.70–0.81) and identified 89% of the polyclonal infections detected with genome-wide datasets.
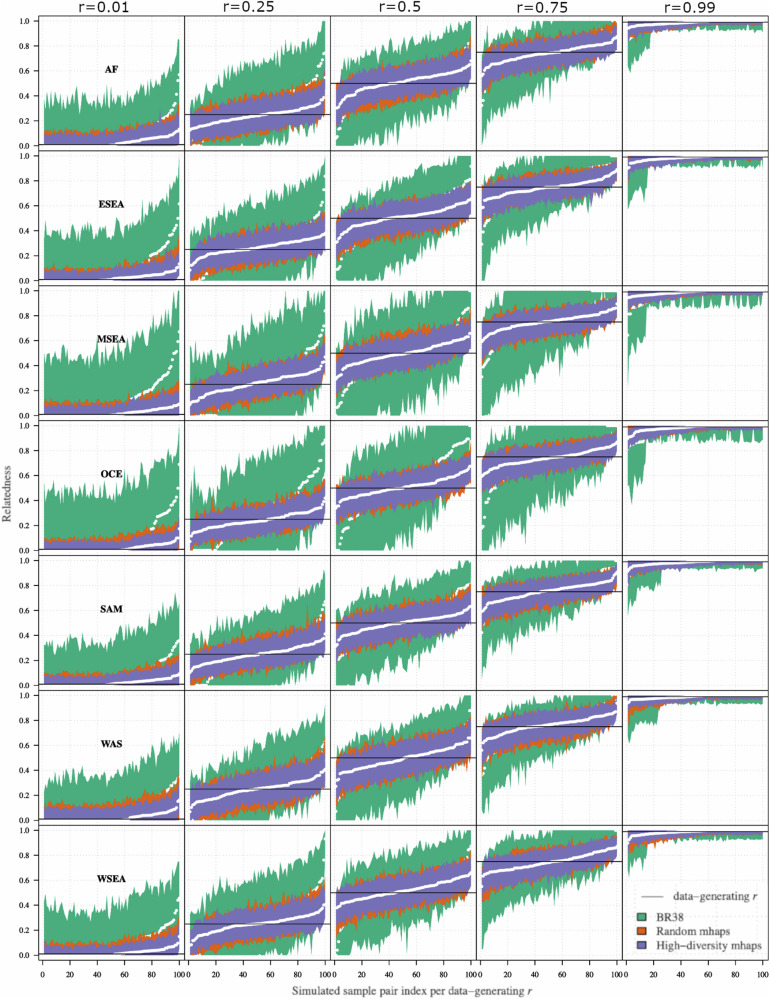
- In simulations, the high-diversity microhaplotype panel had lower error in pairwise IBD estimation than a random microhaplotype panel and the 38-SNP Broad barcode; it was the only panel consistently keeping RMSE below 0.1 in all subpopulations even when r = 0.5, and all (100%) estimates of r = 0.5 had 95% CIs between 0.1 and 0.8.
- Among 14 paired primary/recurrent infections, genome-wide IBD classified 11 as clones (IBD ≥ 0.95), 1 as a distant relative (0.05 ≤ IBD < 0.25), and 2 as strangers (IBD < 0.05); microhaplotype-based estimates correlated highly with genome-wide IBD (rho = 0.790), with 13/14 concordant recurrence classifications and one pair reclassified from stranger to distant relative.
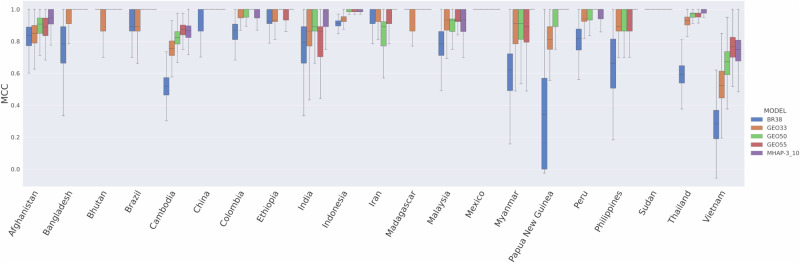
- The 494 microhaplotype SNPs had median MCC greater than or equal to the 38-SNP Broad barcode, GEO33 and GEO50 in 21/21 countries for country-of-origin prediction; GEO55 was higher in 3/21 countries but lower in 4/21, and median MCC exceeded 0.9 in 19/21 countries. Increasing panel size improved IBD accuracy greatly between 50 and 100 microhaplotypes, with diminishing returns above 100.
Methods
- Marker discovery used 615 high-quality, likely monoclonal *P. vivax* genomes from MalariaGEN Pv4 (filtered from 1,816 isolates across 17 countries), identifying 13,084 candidate biallelic SNPs and 3,830 microhaplotype candidate heterozygome windows; panels of 50–250 microhaplotypes were selected from 200 bp windows with 3–10 SNPs, even spacing, and high heterozygosity.
- Panels were evaluated with simulated data using paneljudge (data-generating r = 0, 0.25, 0.5, 0.75, 1.0; 100 haploid genotype pairs; 95% CIs and RMSE) and with real data using hmmIBD on genome-wide versus microhaplotype SNPs, including 14 recurrent infection pairs and an independent non-Pv4 dataset of 324 high-quality monoclonal samples (IBD analyses restricted to 289 samples from 4 regional groups).
- Additional analyses assessed population diversity, within-host complexity of infection with THE REAL McCOIL, spatial clustering by PCoA and IBD networks, and country-of-origin prediction with a Bi-Allele Likelihood classifier.
Limitations
- The paper states that simulated panel evaluation was highly idealised, with data simulated under the same model used for estimation; the impact of mis-specified allele frequencies, mis-classified multiclonal infections, and genotyping errors or failures was not evaluated.
- The paper states that available genomic data contained no infection pairs with IBD around 50% (siblings), the relationship simulations predicted to be hardest to determine accurately, and that the number of genomic pairs was limited by difficulty obtaining enough DNA and high-quality sequence from recurrent infections.
- The paper states that some global regions are not well represented in Pv4 (Africa, the Indian subcontinent/West Asia, Central and South America), making it unclear how well the microhaplotypes capture IBD there; the independent dataset also had higher missing calls at the 494 microhaplotype SNPs (median 17%, range 0–50%) than Pv4 (median 0%, mean 2.5%, range 0–34%), and some microhaplotypes may be subject to site-specific selective pressure.
Model-written summary. Check it against the paper before relying on it.
Integrity signals
Registry
Cites
Statistics
Figures




Verification
Claims the paper makes
0 Valid · 0 Not valid · 38 Not checked · 107 Own results and interpretations
A result the paper reports from its own data — it cites no other source for it, so there is none to check. The quote shows it is in the paper.
In the paper
“Whilst the Random-SNP microhaplotype panel followed similar trends to the high-diversity panel in each geographic region, the BR38 barcode displayed particularly large CI intervals relative to the microhaplotype panels in Maritime Southeast Asia and Oceania.”
§ Lineage-informative microhaplotypes for recurrence classification and spatio-temporal surveillance of Plasmodium vivax malaria parasites > Results > Evaluation of randomly selected versus high-diversity microhaplotype panels on IBD estimation using simulated data
plainstates an association- Asserted: passes — The authors put it forward as true.
- Checkable: passes — It can be checked against evidence.
- Load-bearing: unclear — It is unclear whether the paper’s conclusions depend on it.
- Based: passes — The paper gives a reason why it holds.
A result the paper reports from its own data — it cites no other source for it, so there is none to check. The quote shows it is in the paper.
In the paper
“In silico analyses confirm that P. vivax microhaplotypes can provide much higher resolution to estimate relatedness consistent with close relationships compared to biallelic SNP barcodes that are currently used.”
§ Lineage-informative microhaplotypes for recurrence classification and spatio-temporal surveillance of Plasmodium vivax malaria parasites > Introduction
plainstates a cause- Asserted: passes — The authors put it forward as true.
- Checkable: passes — It can be checked against evidence.
- Load-bearing: passes — The paper’s conclusions depend on it.
- Based: passes — The paper gives a reason why it holds.
A result the paper reports from its own data — it cites no other source for it, so there is none to check. The quote shows it is in the paper.
In the paper
“Importantly, the high-diversity panel was the only panel able to consistently keep RMSE values below 0.1 in all subpopulations (even when r = 0.5)”
§ Lineage-informative microhaplotypes for recurrence classification and spatio-temporal surveillance of Plasmodium vivax malaria parasites > Results > Evaluation of randomly selected versus high-diversity microhaplotype panels on IBD estimation using simulated data
plain- Asserted: passes — The authors put it forward as true.
- Checkable: passes — It can be checked against evidence.
- Load-bearing: passes — The paper’s conclusions depend on it.
- Based: passes — The paper gives a reason why it holds.
A result the paper reports from its own data — it cites no other source for it, so there is none to check. The quote shows it is in the paper.
In the paper
“The rationale for selecting 3–10 SNPs was based on diminishing returns observed above 10 SNPs (see exploratory analyses - notebook 2) and retaining a computationally manageable number of allele combinations (210 allele combinations possible = 1024).”
§ Lineage-informative microhaplotypes for recurrence classification and spatio-temporal surveillance of Plasmodium vivax malaria parasites > Results > Microhaplotype marker discovery framework and selection
plain- Asserted: passes — The authors put it forward as true.
- Checkable: passes — It can be checked against evidence.
- Load-bearing: passes — The paper’s conclusions depend on it.
- Based: passes — The paper gives a reason why it holds.
A result the paper reports from its own data — it cites no other source for it, so there is none to check. The quote shows it is in the paper.
In the paper
“which shows that selection with highest heterozygosity microhaplotypes outperformed the random microhaplotype panel in relatedness estimates.”
§ Lineage-informative microhaplotypes for recurrence classification and spatio-temporal surveillance of Plasmodium vivax malaria parasites > Results > Evaluation of randomly selected versus high-diversity microhaplotype panels on IBD estimation using simulated data
plainstates a cause- Asserted: passes — The authors put it forward as true.
- Checkable: passes — It can be checked against evidence.
- Load-bearing: passes — The paper’s conclusions depend on it.
- Based: passes — The paper gives a reason why it holds.
75 more claims
Create a free account to see all 145 claims and to verify the 53 references still open.
- Probably not a substantial claim. 36
- It may state two separate claims as one. 38
Claims other papers make about this one
Each is checked against this paper’s own text: does it say what the citing paper says it does?
In the citing paper
“This has led to them being increasingly adopted by research teams and national malaria control programmes (NMCPs) [13,14,17].”
From Plasmodium vivax relapse reservoirs in Ethiopia: microhaplotype sequencing informs recurrent infection origins (2026) · cites this paper as [14]
In the citing paper
“Amplicon-based sequencing of 93 microhaplotype markers, using highly parallel sequencing platforms, offers a cost effective and logistically efficient means to capture IBD accurately [13][14][15][16].”
From Plasmodium vivax relapse reservoirs in Ethiopia: microhaplotype sequencing informs recurrent infection origins (2026) · cites this paper as [14]
Self-check
Percentages, sums and reported differences re-computed from the paper’s own numbers.
Each contradiction between two passages listed here was confirmed by an independent check.
Rated minor: it would not touch a result — a value no result rests on, a p-value that stays on the same side of the significance level, or a conflict that is clerical, resolved elsewhere in the paper, or outside its own findings.
In the paper
§ Lineage-informative microhaplotypes for recurrence classification and spatio-temporal surveillance of Plasmodium vivax malaria parasites > Results > Evaluation of an exemplar high-diversity 100 microhaplotype panel on IBD estimation using real data
“| PY0109-CWx | PY0109-Cx | Clinical survey: CQ vs AM29 | Sabah, Malaysia | MSEA | 2013 | 29 | 1.000 (clone) | 0.937 (clone) |”
§ Lineage-informative microhaplotypes for recurrence classification and spatio-temporal surveillance of Plasmodium vivax malaria parasites > Results > Evaluation of an exemplar high-diversity 100 microhaplotype panel on IBD estimation using real data
“*Recurrence classification; clone (IBD ≥ 0.95), close relative (0.25 ≤ IBD < 0.95), distant relative (0.05 ≤ IBD < 0.25), stranger (IBD < 0.05).”
Rated minor: it would not touch a result — a value no result rests on, a p-value that stays on the same side of the significance level, or a conflict that is clerical, resolved elsewhere in the paper, or outside its own findings.
In the paper
§ Lineage-informative microhaplotypes for recurrence classification and spatio-temporal surveillance of Plasmodium vivax malaria parasites > Results > External validation of IBD accuracy using an exemplar high-diversity 100 microhaplotype panel with an independent dataset
“From an initial set of 836 non-Pv4 isolates, we identified 324 high quality, monoclonal samples32–35.”
§ Lineage-informative microhaplotypes for recurrence classification and spatio-temporal surveillance of Plasmodium vivax malaria parasites > Results > Microhaplotype marker discovery framework and selection
“| Total | 922 | 615 | 14 | 836 | 291 |”
Rated minor: it would not touch a result — a value no result rests on, a p-value that stays on the same side of the significance level, or a conflict that is clerical, resolved elsewhere in the paper, or outside its own findings.
In the paper
§ Lineage-informative microhaplotypes for recurrence classification and spatio-temporal surveillance of Plasmodium vivax malaria parasites > Results > Microhaplotype panels can effectively capture diversity and differentiation
“The lowest diversity was observed in the horn of Africa (median heterozygosity = 0.70) and the highest in Oceania (median heterozygosity = 0.81) (Table 3, Fig. 4a).”
§ Lineage-informative microhaplotypes for recurrence classification and spatio-temporal surveillance of Plasmodium vivax malaria parasites > Results > Microhaplotype panels can effectively capture diversity and differentiation
“| AF | 0.74 (0–0.95) | 3.88 (1–18.94) | | ESEA | 0.77 (0.55–0.95) | 4.41 (2.22–21.28) | | MSEA | 0.76 (0.39–0.96) | 4.16 (1.65–23.91) | | OCE | 0.81 (0.53–0.96) | 5.18 (2.12–26.05) | | SAM | 0.80 (0.55–0.96) | 5.07 (2.2–27.16) | | WAS | 0.70 (0.12–0.91) | 3.36 (1.13–11.72) |”
Rated minor: it would not touch a result — a value no result rests on, a p-value that stays on the same side of the significance level, or a conflict that is clerical, resolved elsewhere in the paper, or outside its own findings.
In the paper
§ Lineage-informative microhaplotypes for recurrence classification and spatio-temporal surveillance of Plasmodium vivax malaria parasites > Results > Evaluation of microhaplotype number on IBD estimation
“Trends in marker panel performance were observed using the root mean squared error (RMSE) of the estimates of r(r^) compared to the data-generating r (Supplementary Fig. 7), which shows that increasing panel size improves the accuracy of IBD estimation”
§ Lineage-informative microhaplotypes for recurrence classification and spatio-temporal surveillance of Plasmodium vivax malaria parasites > Methods > Evaluation of IBD estimation with using simulated data
“The five additional “greedy” algorithm panels consisting of 50, 100, 150, 200, and 250 markers were also analysed for RMSE comparisons against panel size using the same method (Supplementary Fig. 3).”
Citations
Cites
Analysis of Phylogenetics and Evolution with R
Paradis, E. (2012) · Springer eBooks · doi:10.1007/978-1-4614-1743-9 · Cited by 692
Determinants of relapse periodicity in Plasmodium vivax malaria
White, N. J. (2011) · Malaria Journal · doi:10.1186/1475-2875-10-297 · Cited by 679
Self-citationGenetic architecture of artemisinin-resistant Plasmodium falciparum
Miotto, O., Amato, R., Ashley, E. A., MacInnis, B., Almagro-Garcia, J., Amaratunga, C., Lim, P., Mead, D., Oyola, S. O., Dhorda, M., et al. (2015) · Nature Genetics · doi:10.1038/ng.3189 · Cited by 609
Self-citationBattle, K. E., Lucas, T. C. D., Nguyen, M., Howes, R. E., Nandi, A. K., Twohig, K. A., Pfeffer, D. A., Cameron, E., Rao, P. C., Casey, D., et al. (2019) · The Lancet · doi:10.1016/s0140-6736(19)31096-7 · Cited by 409
Self-citationGlobal extent of chloroquine-resistant Plasmodium vivax: a systematic review and meta-analysis
Price, R. N., von Seidlein, L., Valecha, N., Nosten, F., Baird, J. K., & White, N. J. (2014) · The Lancet Infectious Diseases · doi:10.1016/s1473-3099(14)70855-2 · Cited by 388
Self-citationRelapses of Plasmodium vivax Infection Usually Result from Activation of Heterologous Hypnozoites
Imwong, M., Snounou, G., Pukrittayakamee, S., Tanomsing, N., Kim, J. R., Nandy, A., Guthmann, J., Nosten, F., Carlton, J., Looareesuwan, S., et al. (2007) · The Journal of Infectious Diseases · doi:10.1086/512241 · Cited by 294
Self-citationSingle-Dose Tafenoquine to Prevent Relapse of Plasmodium vivax Malaria
Lacerda, M. V. G., Llanos-Cuentas, A., Krudsood, S., Lon, C., Saunders, D. L., Mohammed, R., Yilma, D., Batista Pereira, D., Espino, F. E. J., Mia, R. Z., et al. (2019) · New England Journal of Medicine · doi:10.1056/nejmoa1710775 · Cited by 260
Self-citationIndels, structural variation, and recombination drive genomic diversity in Plasmodium falciparum
Miles, A., Iqbal, Z., Vauterin, P., Pearson, R., Campino, S., Theron, M., Gould, K., Mead, D., Drury, E., O'Brien, J., et al. (2016) · Genome Research · doi:10.1101/gr.203711.115 · Cited by 233
Self-citationSnounou, G., & Beck, H.-P. (1998) · Parasitology Today · doi:10.1016/s0169-4758(98)01340-4 · Cited by 215
Hupalo, D. N., Luo, Z., Melnikov, A., Sutton, P. L., Rogov, P., Escalante, A., Vallejo, A. F., Herrera, S., Arévalo-Herrera, M., Fan, Q., et al. (2016) · Nature Genetics · doi:10.1038/ng.3588 · Cited by 209
Cited by
Sutanto, E., Pava, Z., Echeverry, D. F., Lopera-Mesa, T. M., Montenegro, L. M., Yasnot, M. F., Benavente, E. D., Pearson, R. D., Herrera, S., Arévalo‐Herrera, M., et al. (2023) · Scientific Reports · doi:10.1038/s41598-023-46076-1 · Cited by 11
Self-citationPopulation genomics of Plasmodium ovale species in sub-Saharan Africa
Carey-Ewend, K., Popkin-Hall, Z. R., Simkin, A., Muller, M., Hennelly, C. M., He, W., Moser, K. A., Gaither, C., Niaré, K., Aghakhanian, F. F., et al. (2024) · Nature Communications · doi:10.1038/s41467-024-54667-3 · Cited by 10
High-throughput genotyping of Plasmodium vivax in the Peruvian Amazon via molecular inversion probes
Popkin-Hall, Z. R., Niaré, K., Crudale, R., Simkin, A., Fola, A. A., Sanchez, J. F., Pannebaker, D. L., Giesbrecht, D. J., Kim, I. E., Aydemir, Ö., et al. (2024) · Nature Communications · doi:10.1038/s41467-024-54731-y · Cited by 11
Potential and pitfalls of using identity-by-descent for malaria genomic surveillance
Guo, B., Rowley, E., O’Connor, T. D., & Takala‐Harrison, S. (2025) · Trends in Parasitology · doi:10.1016/j.pt.2025.03.012 · Cited by 9
Rosado, J., Han, J., Obadia, T., Munro, J., Traore, Z., Schoffer, K., Brewster, J., Bourke, C., Vinetz, J. M., Taylor, A. R., et al. (2026) · iScience · doi:10.1016/j.isci.2026.115799 · Cited by 3
Self-citation
Metadata
- Authors
- Siegel, S. V., Trimarsanto, H., Amato, R., Murie, K., Taylor, A. R., Sutanto, E., Kleinecke, M., Whitton, G., Watson, J. A., Imwong, M., Assefa, A., Rahim, A. G., Nguyen, H. C., Tran, T. H., Green, J. A., Koh, G. C. K. W., White, N. J., Day, N., Kwiatkowski, D. P., Rayner, J. C., Price, R. N., & Auburn, S.
- Affiliations
- Wellcome Sanger Institute (GB)
- Eijkman Institute for Molecular Biology (ID)
- Institut Pasteur (FR)
- Charles Darwin University (AU)
- University of Oxford (GB)
- Mahidol University (TH)
- University of North Carolina at Chapel Hill (US)
- Oxford University Clinical Research Unit (VN)
- GlaxoSmithKline (United Kingdom) (GB)
- Northwick Park Hospital (GB)
- University of Cambridge (GB)
- Corresponding author
- Auburn, Sarah
- ORCID
- Siegel, Sasha V.
- Trimarsanto, Hidayat
- Amato, Roberto
- Murie, Kathryn
- Taylor, Aimee R.
- Sutanto, Edwin
- Kleinecke, Mariana
- Whitton, Georgia
- Watson, James A.
- Imwong, Mallika
- Assefa, Ashenafi
- Rahim, Awab Ghulam
- Green, Justin A.
- Koh, Gavin C. K. W.
- White, Nicholas J.
- Day, Nicholas
- Kwiatkowski, Dominic P.
- Rayner, Julian C.
- Price, Ric N.
- Auburn, Sarah
- Venue
- Nature Communications
- Published
- 2024-08-08
- Volume
- 15
- Issue
- 1
- Pages
- 6757-6757
- ISSN
- 2041-1723 (ISSN-L)
- PMC
- PMC11310204
- OpenAlex
- W4401422291
- Cited by
- 30
- References
- 56
- Citations by year
- 2026: 12 · 2025: 11 · 2024: 5
- FWCI
- 7.56
- Type
- journal article
- Language
- en
- Open access
- gold
- doi.org
- Licence
- cc-by
- creativecommons.org/licenses/by/4.0 (tdm)
- creativecommons.org/licenses/by/4.0 (vor)
- Locations
- Nature Communications (publishedVersion, cc-by)
- medRxiv (submittedVersion, cc-by)
- PubMed Central (publishedVersion, cc-by)
- Oxford University Research Archive (ORA) (University of Oxford) (publishedVersion, cc-by)
- PubMed (publishedVersion)
- PubMed Central (submittedVersion, cc-by)
- HAL (submittedVersion, cc-by)
- Apollo (University of Cambridge) (submittedVersion, cc-by)
- PubMed (submittedVersion)
- RePEc: Research Papers in Economics (submittedVersion)
- DOAJ (DOAJ: Directory of Open Access Journals) (submittedVersion, cc-by-sa)
- Funders
- Bill and Melinda Gates Foundation (INV-043618, OPP1054404)
- Department of Health | National Health and Medical Research Council (APP2001083)
- Wellcome Trust (206194, 204911, 206194/Z17/Z, ICRG GR071614MA)
- Medical Research Council and UK Department for International Development
- U.S. Department of Health & Human Services | National Institutes of Health (R01AI137154)
- Topics
- Health Sciences › Medicine › Public Health, Environmental and Occupational Health › Malaria Research and Control
- Life Sciences › Biochemistry, Genetics and Molecular Biology › Genetics › Genetic diversity and population structure
- Life Sciences › Biochemistry, Genetics and Molecular Biology › Genetics › Forensic and Genetic Research
- Keywords
- Plasmodium vivax, microhaplotypes, identity by descent, recurrent malaria, relapse, recrudescence, reinfection, molecular surveillance, marker discovery, polyclonal infection, antimalarial drug efficacy, targeted genotyping
- MeSH terms
- Genotype, Haplotypes, Humans, Plasmodium vivax, Recurrence, Malaria, Vivax, Genome, Protozoan, Polymorphism, Single Nucleotide
About these checks
Registry, retraction, Cites and statistics results are computed, not judged, with one exception: a printed reference that no index lists is read once by a model before it counts as a citation error. Claims are extracted by a model and kept only when their quote appears verbatim in the text; each cited source is then checked, with a model’s help, for whether it says what the claim relies on. Those verdicts can be wrong — read the claim’s quote and the cited source before relying on one.
A language model drew the claims from the paper on 2026-11-21, under version 3 of the claim definition (model deepseek-v4.1-flash, prompt extract-v3).
A second model labelled each claim on 2026-11-21 (model jev-1.13-20260917, definition revision gold-guideline-v0.2).
Statistics and arithmetic are recomputed, not judged.
Confidence bands are shown only for fields calibrated on our annotated test set. None is calibrated yet, so no band is shown.
What counts as a claim ›How we measure confidence ›How we check this ›
Are you an author, or do you see a problem with this page? Request a review
How to cite
Cite CoChat for the checks on this page, and the paper for its own findings.
- This page
- CoChat. (2026). Citation check: Lineage-informative microhaplotypes for recurrence classification and spatio-temporal surveillance of Plasmodium vivax malaria parasites. https://app.cochat.ai/papers/10.1038/s41467-024-51015-3
- The paper
- Siegel, S. V., Trimarsanto, H., Amato, R., Murie, K., Taylor, A. R., Sutanto, E., Kleinecke, M., Whitton, G., Watson, J. A., Imwong, M., Assefa, A., Rahim, A. G., Nguyen, H. C., Tran, T. H., Green, J. A., Koh, G. C. K. W., White, N. J., Day, N., Kwiatkowski, D. P., . . . Auburn, S. (2024). Lineage-informative microhaplotypes for recurrence classification and spatio-temporal surveillance of Plasmodium vivax malaria parasites. Nature Communications. https://doi.org/10.1038/s41467-024-51015-3
Data sources
Bibliographic data: Semantic Scholar, OpenAlex, Crossref.
Contains information from the Semantic Scholar Academic Graph Datasets, made available under the ODC Attribution License (ODC-BY 1.0).
Semantic Scholar’s data is described in: Kinney, R., et al. (2023). The Semantic Scholar Open Data Platform. arXiv:2301.10140.
