

The DOI matches its Crossref record; 152 of the 152 references it cites were found in a registry or an index.
Orientia tsutsugamushi Ank5 promotes NLRC5 cytoplasmic retention and degradation to inhibit MHC class I expression
Open accessPublished version of a preprint
Abstract
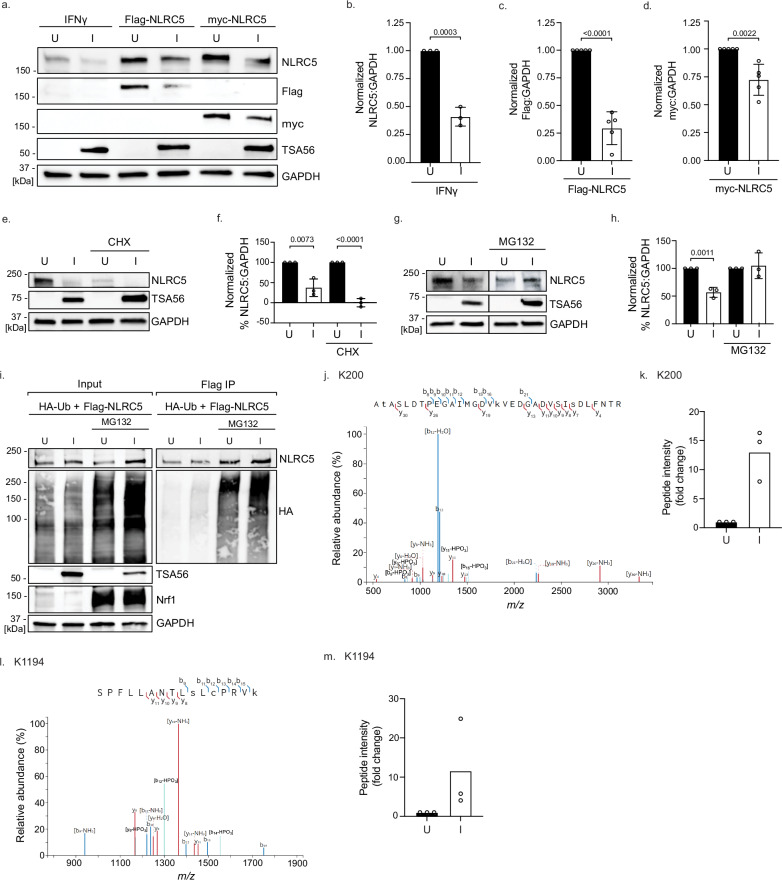
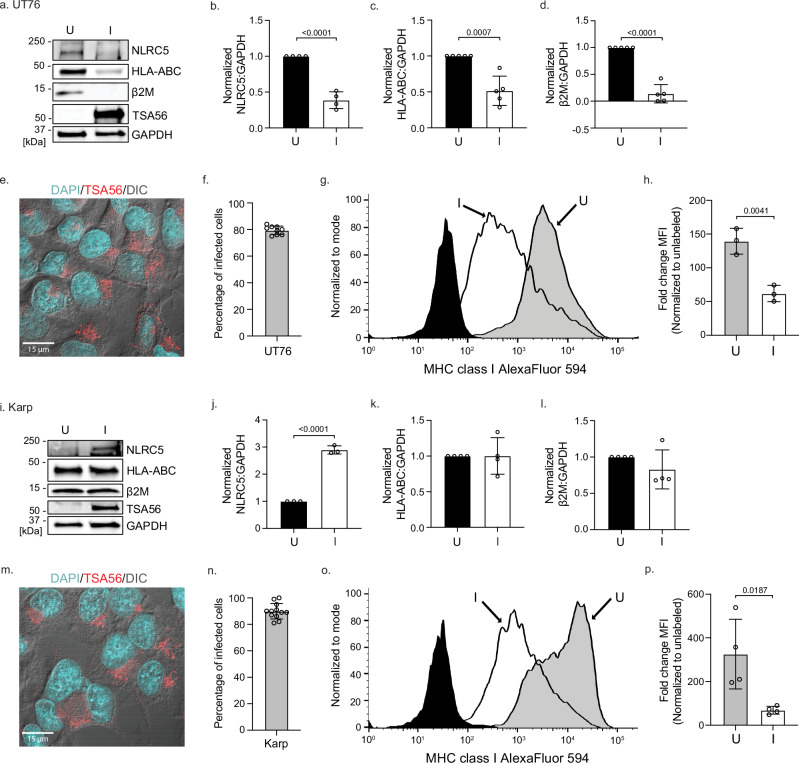
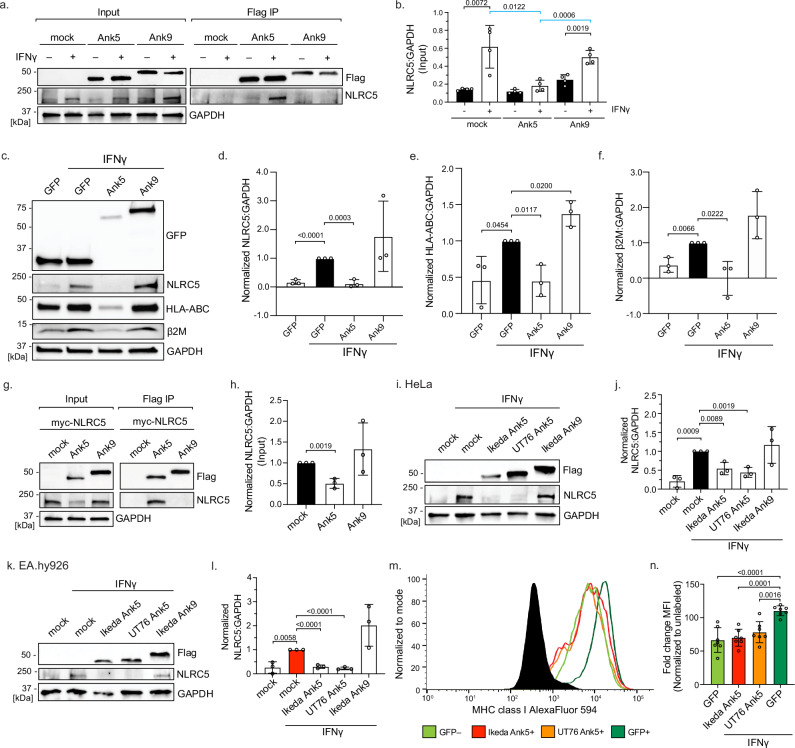
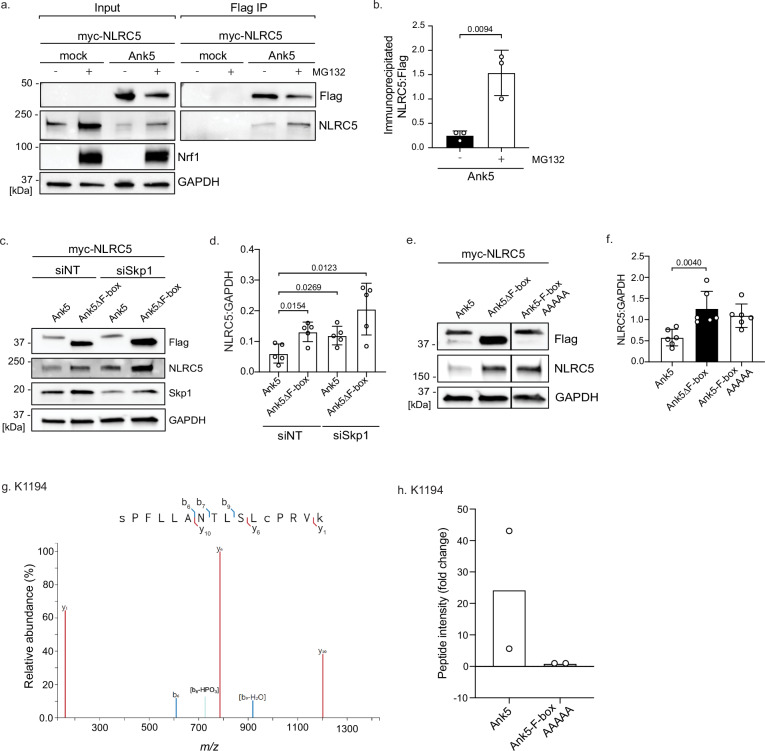
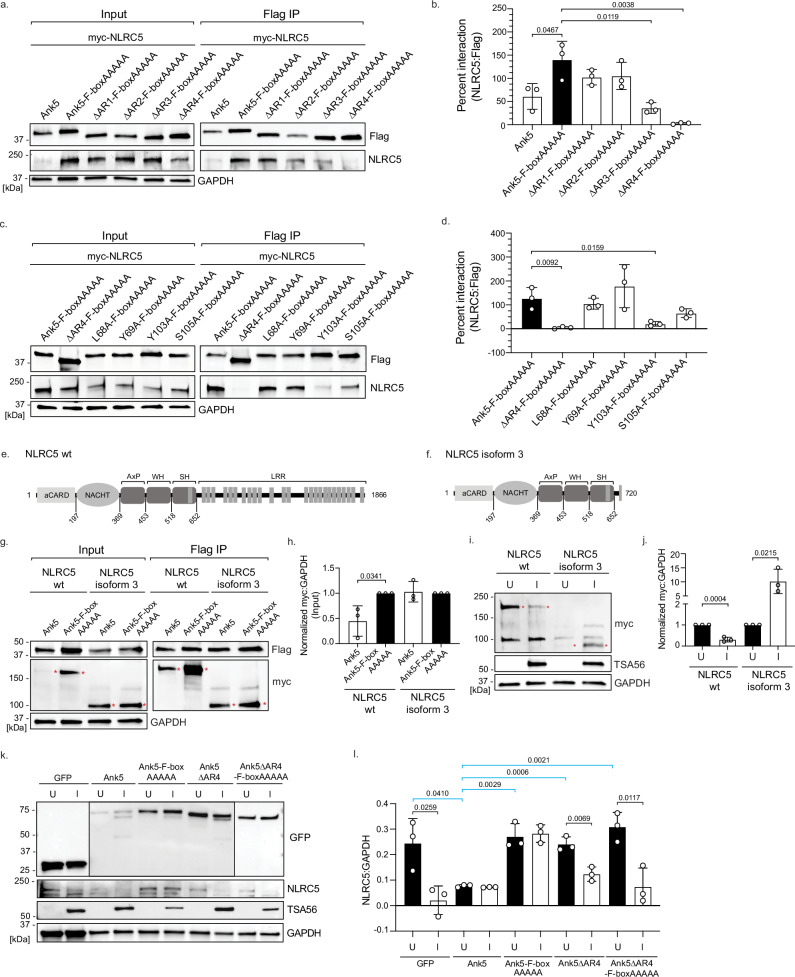
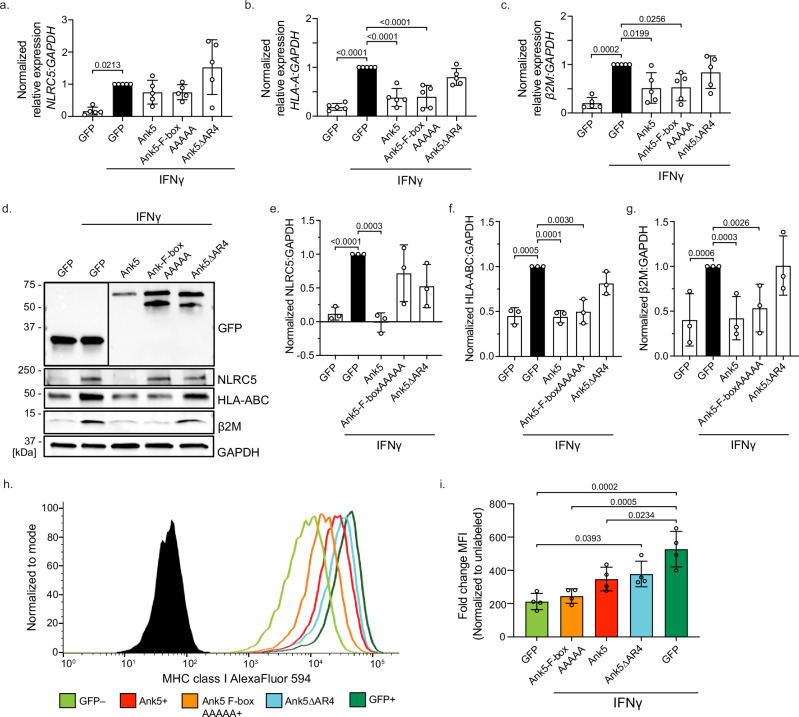
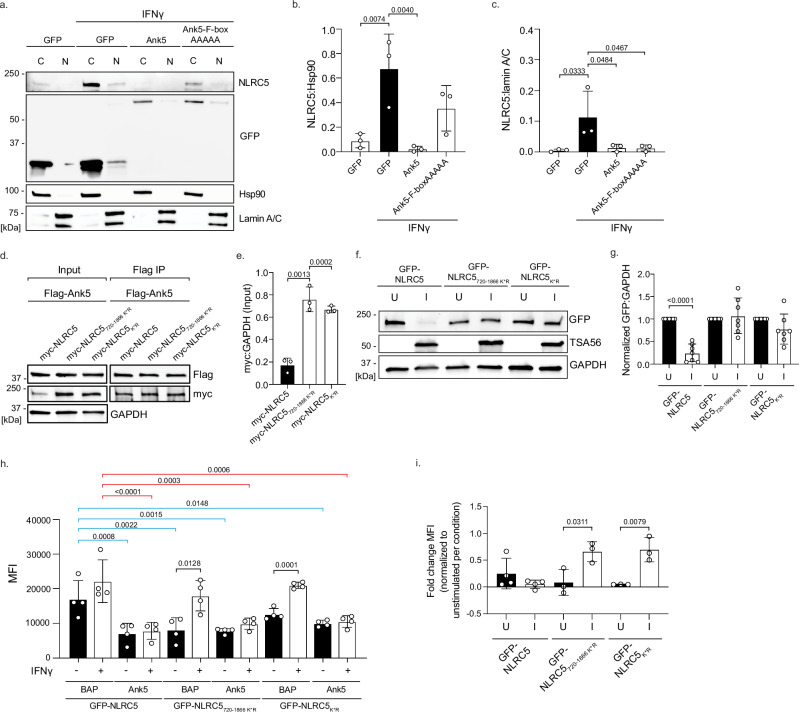
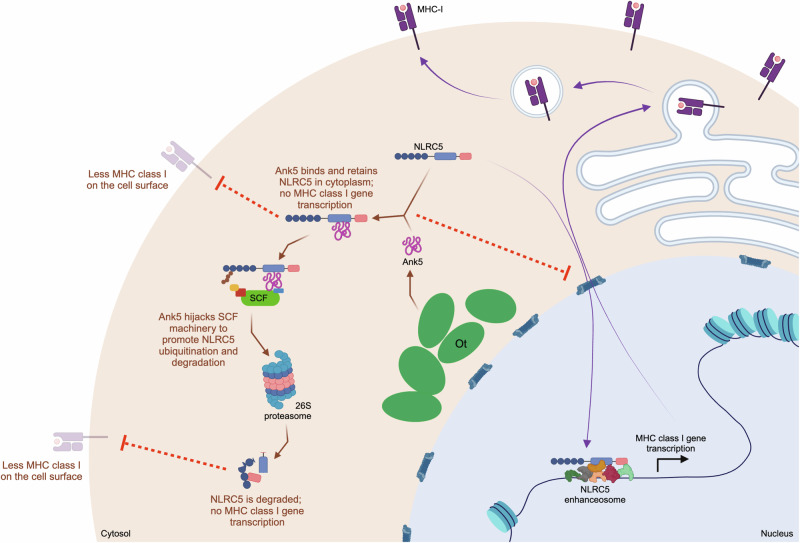
Abstract How intracellular bacteria subvert the major histocompatibility complex (MHC) class I pathway is poorly understood. Here, we show that the obligate intracellular bacterium Orientia tsutsugamushi uses its effector protein, Ank5, to orchestrate proteasomal degradation of the MHC class I gene transactivator, NLRC5. Ank5 uses a tyrosine in its fourth ankyrin repeat to bind the NLRC5 N-terminus while its F-box directs host SCF complex ubiquitination of K1194 in the leucine-rich repeat region that dictates NLRC5 susceptibility to Orientia- and Ank5-mediated degradation. The ability of O. tsutsugamushi strains to degrade NLRC5 correlates with ank5 genomic carriage. Ectopically expressed Ank5 that can bind but not degrade NLRC5 protects the transactivator during Orientia infection. Thus, Ank5 is an immunoevasin that uses its bipartite architecture to rid host cells of NLRC5 and MHC class I molecules. This study offers insight into how intracellular pathogens can impair MHC class I expression to benefit their survival.
Overview
The claims and statistics of this paper haven’t been checked yet.
Run the check — free, no account needed. It reads the open-access text and checks the sources it cites.
Integrity signals
Registry
Cites
Statistics
Figures
Verification
Claims the paper makes
The claims and statistics of this paper haven’t been checked yet.
Run the check — free, no account needed. It reads the open-access text and checks the sources it cites.
Self-check
Percentages, sums and reported differences re-computed from the paper’s own numbers.
The self-check needs the paper’s full text.
Citations
Cites
Analysis of Relative Gene Expression Data Using Real-Time Quantitative PCR and the 2−ΔΔCT Method
Livak, K. J., & Schmittgen, T. D. (2001) · Methods · doi:10.1006/meth.2001.1262 · Cited by 180,860
Highly accurate protein structure prediction with AlphaFold
Jumper, J., Evans, R., Pritzel, A., Green, T., Figurnov, M., Ronneberger, O., Tunyasuvunakool, K., Bates, R., Žídek, A., Potapenko, A., et al. (2021) · Nature · doi:10.1038/s41586-021-03819-2 · Cited by 43,764
Szklarczyk, D., Gable, A. L., Lyon, D., Junge, A., Wyder, S., Huerta-Cepas, J., Simonovic, M., Doncheva, N. T., Morris, J. H., Bork, P., et al. (2019) · Nucleic Acids Research · doi:10.1093/nar/gky1131 · Cited by 17,749
Varadi, M., Anyango, S., Deshpande, M., Nair, S., Natassia, C., Yordanova, G., Yuan, D., Stroe, O., Wood, G., Laydon, A., et al. (2022) · Nucleic Acids Research · doi:10.1093/nar/gkab1061 · Cited by 7,850
The I-TASSER Suite: protein structure and function prediction
Yang, J., Yan, R., Roy, A., Xu, D., Poisson, J., & Zhang, Y. (2015) · Nature Methods · doi:10.1038/nmeth.3213 · Cited by 5,596
Mutation of the mouse klotho gene leads to a syndrome resembling ageing
Kuro-o, M., Matsumura, Y., Aizawa, H., Kawaguchi, H., Suga, T., Utsugi, T., Ohyama, Y., Kurabayashi, M., Kaname, T., Kume, E., et al. (1997) · Nature · doi:10.1038/36285 · Cited by 3,837
I-TASSER server: new development for protein structure and function predictions
Yang, J., & Zhang, Y. (2015) · Nucleic Acids Research · doi:10.1093/nar/gkv342 · Cited by 2,552
The leucine-rich repeat as a protein recognition motif
Kobe, B. (2001) · Current Opinion in Structural Biology · doi:10.1016/s0959-440x(01)00266-4 · Cited by 1,720
Structure of the Cul1–Rbx1–Skp1–F boxSkp2 SCF ubiquitin ligase complex
Zheng, N., Schulman, B. A., Song, L., Miller, J. J., Jeffrey, P. D., Wang, P., Chu, C., Koepp, D. M., Elledge, S. J., Pagano, M., et al. (2002) · Nature · doi:10.1038/416703a · Cited by 1,507
The protein–protein interaction map of Helicobacter pylori
Rain, J.-C., Selig, L., De Reuse, H., Battaglia, V., Reverdy, C., Simon, S., Lenzen, G., Petel, F., Wojcik, J., Schächter, V., et al. (2001) · Nature · doi:10.1038/35051615 · Cited by 1,146
NODs: intracellular proteins involved in inflammation and apoptosis
Inohara, N., & Nuñez, G. (2003) · Nature Reviews Immunology · doi:10.1038/nri1086 · Cited by 1,064
Ubiquitin-dependent c-Jun degradation in vivo is mediated by the δ domain
Treier, M., Staszewski, L. M., & Bohmann, D. (1994) · Cell · doi:10.1016/s0092-8674(94)90502-9 · Cited by 920
The ankyrin repeat as molecular architecture for protein recognition
Mosavi, L. K., Cammett, T. J., Desrosiers, D. C., & Peng, Z. (2004) · Protein Science · doi:10.1110/ps.03554604 · Cited by 907
Functional and Evolutionary Insights from the Genomes of Three Parasitoid Nasonia Species
Werren, J. H., Richards, S., Desjardins, C. A., Niehuis, O., Gadau, J., Colbourne, J. K., The Nasonia Genome Working Group, Beukeboom, L. W., Desplan, C., Elsik, C. G., et al. (2010) · Science · doi:10.1126/science.1178028 · Cited by 866
The ankyrin repeat: a diversity of interactions on a common structural framework
Sedgwick, S. G., & Smerdon, S. J. (1999) · Trends in Biochemical Sciences · doi:10.1016/s0968-0004(99)01426-7 · Cited by 823
The HLA genomic loci map: expression, interaction, diversity and disease
Shiina, T., Hosomichi, K., Inoko, H., & Kulski, J. K. (2009) · Journal of Human Genetics · doi:10.1038/jhg.2008.5 · Cited by 782
Characterization of the expression of MHC proteins in human embryonic stem cells
Drukker, M., Katz, G., Urbach, A., Schuldiner, M., Markel, G., Itskovitz‐Eldor, J., Reubinoff, B. E., Mandelboim, O., & Benvenisty, N. (2002) · Proceedings of the National Academy of Sciences · doi:10.1073/pnas.142298299 · Cited by 671
Ankyrin Repeat: A Unique Motif Mediating Protein−Protein Interactions
Li, J., Mahajan, A., & Tsai, M. (2006) · Biochemistry · doi:10.1021/bi062188q · Cited by 667
Zheng, W. H., Zhang, C., Li, Y., Pearce, R., Bell, E. W., & Zhang, Y. (2021) · Cell Reports Methods · doi:10.1016/j.crmeth.2021.100014 · Cited by 594
A review of the global epidemiology of scrub typhus
Xu, G., Walker, D. H., Jupiter, D., Melby, P. C., & Arcari, C. M. (2017) · PLOS Neglected Tropical Diseases · doi:10.1371/journal.pntd.0006062 · Cited by 549
Radhakrishnan, S. K., Lee, C. S., Young, P., Beskow, A., Chan, J. Y., & Deshaies, R. J. (2010) · Molecular Cell · doi:10.1016/j.molcel.2010.02.029 · Cited by 526
Russo, A. A., Tong, L., Lee, J.-O., Jeffrey, P. D., & Pavletich, N. P. (1998) · Nature · doi:10.1038/26155 · Cited by 524
Cornel, A. M., Mimpen, I. L., & Nierkens, S. (2020) · Cancers · doi:10.3390/cancers12071760 · Cited by 503
NLR family member NLRC5 is a transcriptional regulator of MHC class I genes
Meissner, T. B., Li, A., Biswas, A., Lee, K.-H., Liu, Y.-J., Bayir, E., Iliopoulos, D., van den Elsen, P. J., & Kobayashi, K. S. (2010) · Proceedings of the National Academy of Sciences · doi:10.1073/pnas.1008684107 · Cited by 447
The HLA system: Genetics, immunology, clinical testing, and clinical implications
Choo, S. Y. (2007) · Yonsei Medical Journal · doi:10.3349/ymj.2007.48.1.11 · Cited by 446
NLRC5: a key regulator of MHC class I-dependent immune responses
Kobayashi, K. S., & van den Elsen, P. J. (2012) · Nature reviews. Immunology · doi:10.1038/nri3339 · Cited by 406
The Nod-Like Receptor (NLR) Family: A Tale of Similarities and Differences
Proell, M., Riedl, S. J., Fritz, J. H., Rojas, A. M., & Schwarzenbacher, R. (2008) · PLoS ONE · doi:10.1371/journal.pone.0002119 · Cited by 401
A Systematic Review of Mortality from Untreated Scrub Typhus (Orientia tsutsugamushi)
Taylor, A. J., Paris, D. H., & Newton, P. N. (2015) · PLoS neglected tropical diseases · doi:10.1371/journal.pntd.0003971 · Cited by 369
Unresolved Problems Related to Scrub Typhus: A Seriously Neglected Life-Threatening Disease
Paris, D. H., Shelite, T. R., Day, N., & Walker, D. H. (2013) · American Journal of Tropical Medicine and Hygiene · doi:10.4269/ajtmh.13-0064 · Cited by 355
Consensus-derived structural determinants of the ankyrin repeat motif
Mosavi, L. K., Minor, D. L., & Peng, Z.-Y. (2002) · Proceedings of the National Academy of Sciences · doi:10.1073/pnas.252537899 · Cited by 355
Isolation of a Novel Orientia Species ( O. chuto sp. nov.) from a Patient Infected in Dubai
Izzard, L., Fuller, A., Blacksell, S. D., Paris, D. H., Richards, A. L., Aukkanit, N., Nguyen, C., Jiang, J., Fenwick, S., Day, N., et al. (2010) · Journal of Clinical Microbiology · doi:10.1128/jcm.01526-10 · Cited by 295
NLRC5/MHC class I transactivator is a target for immune evasion in cancer
Yoshihama, S., Roszik, J., Downs, I., Meissner, T. B., Vijayan, S., Chapuy, B., Sidiq, T., Shipp, M. A., Lizee, G. A., & Kobayashi, K. S. (2016) · Proceedings of the National Academy of Sciences · doi:10.1073/pnas.1602069113 · Cited by 284
King, R. W., Glotzer, M., & Kirschner, M. W. (1996) · Molecular Biology of the Cell · doi:10.1091/mbc.7.9.1343 · Cited by 283
Endemic Scrub Typhus in South America
Weitzel, T., Dittrich, S., López, J., Phuklia, W., Martínez-Valdebenito, C., Velásquez, K., Blacksell, S. D., Paris, D. H., & Abarca, K., V (2016) · New England Journal of Medicine · doi:10.1056/nejmoa1603657 · Cited by 256
Review Article*: The Ecology of Chigger-Borne Rickettsiosis (Scrub Typhus)1, 2
Traub, R., & Wisseman, C. L. (1974) · Journal of Medical Entomology · doi:10.1093/jmedent/11.3.237 · Cited by 255
Cho, N., Kim, H., Lee, J., Kim, S.-Y., Kim, J., Cha, S., Kim, S.-Y., Darby, A. C., Fuxelius, H., Yin, J., et al. (2007) · Proceedings of the National Academy of Sciences · doi:10.1073/pnas.0611553104 · Cited by 237
NLRC5 Limits the Activation of Inflammatory Pathways
Benkő, S., Magalhaes, J. G., Philpott, D. J., & Girardin, S. E. (2010) · The Journal of Immunology · doi:10.4049/jimmunol.0903900 · Cited by 235
Functional diversity of ankyrin repeats in microbial proteins
Khodor, S. A., Price, C. T. D., Kalia, A., & Kwaik, Y. A. (2009) · Trends in Microbiology · doi:10.1016/j.tim.2009.11.004 · Cited by 227
Host Proteasomal Degradation Generates Amino Acids Essential for Intracellular Bacterial Growth
Price, C. T. D., Al‐Quadan, T., Šantić, M., Rosenshine, I., & Kwaik, Y. A. (2011) · Science · doi:10.1126/science.1212868 · Cited by 217
Zhu, X., Linhoff, M. W., Li, G., Chin, K.-C., Maity, S. N., & Ting, J. P.-Y. (2000) · Molecular and Cellular Biology · doi:10.1128/mcb.20.16.6051-6061.2000 · Cited by 201
Identification of the Target Cells of Orientia tsutsugamushi in Human Cases of Scrub Typhus
Morón, C., Popov, V. L., Feng, H.-M., Wear, D. J., & Walker, D. H. (2001) · Modern Pathology · doi:10.1038/modpathol.3880385 · Cited by 198
Künzel, S. R., Till, A., Winkler, M., Häsler, R., Lipinski, S., Jung, S., Grötzinger, J., Fickenscher, H., Schreiber, S., & Rosenstiel, P. C. (2010) · The Journal of Immunology · doi:10.4049/jimmunol.0900557 · Cited by 196
Nakayama, K., Yamashita, A., Kurokawa, K., Morimoto, T., Ogawa, M., Fukuhara, M., Urakami, H., Ohnishi, M., Uchiyama, I., Ogura, Y., et al. (2008) · DNA Research · doi:10.1093/dnares/dsn011 · Cited by 184
The regulatory network behind MHC class I expression
Jongsma, M. L. M., Guarda, G., & Spaapen, R. M. (2017) · Molecular Immunology · doi:10.1016/j.molimm.2017.12.005 · Cited by 173
Scrub Typhus: No Longer Restricted to the Tsutsugamushi Triangle
Jiang, J., & Richards, A. L. (2018) · Tropical Medicine and Infectious Disease · doi:10.3390/tropicalmed3010011 · Cited by 166
Nagarajan, U. M., Louis‐Plence, P., DeSandro, A. M., Nilsen, R., Long, A. B., & Boss, J. M. (1999) · Immunity · doi:10.1016/s1074-7613(00)80016-3 · Cited by 164
Neerincx, A., Lautz, K., Menning, M., Kremmer, E., Zigrino, P., Hösel, M., Büning, H., Schwarzenbacher, R., & Kufer, T. A. (2010) · Journal of Biological Chemistry · doi:10.1074/jbc.m110.109736 · Cited by 164
Byeon, I. L., Li, J., Ericson, K. L., Selby, T. L., Tevelev, A., Kim, H. J., O’Maille, P. E., & Tsai, M. (1998) · Molecular Cell · doi:10.1016/s1097-2765(00)80042-8 · Cited by 163
Engineering of obligate intracellular bacteria: progress, challenges and paradigms
McClure, E. E., Chávez, A. S. O., Shaw, D. K., Carlyon, J. A., Ganta, R. R., Noh, S. M., Wood, D. O., Bavoil, P. M., Brayton, K. A., Martinez, J. J., et al. (2017) · Nature Reviews Microbiology · doi:10.1038/nrmicro.2017.59 · Cited by 160
Self-citationNLRC5 Deficiency Selectively Impairs MHC Class I- Dependent Lymphocyte Killing by Cytotoxic T Cells
Staehli, F., Ludigs, K., Heinz, L. X., Seguín-Estévez, Q., Ferrero, I., Braun, M., Schroder, K., Rebsamen, M., Tardivel, A., Mattmann, C., et al. (2012) · The Journal of Immunology · doi:10.4049/jimmunol.1102671 · Cited by 158
Lomma, M., Ravault, D., Rolando, M., Nora, T., Newton, H. J., Sansom, F. M., Sahr, T., Gómez-Valero, L., Jules, M., Hartland, E. L., et al. (2010) · Cellular Microbiology · doi:10.1111/j.1462-5822.2010.01467.x · Cited by 151
Paris, D. H., Phetsouvanh, R., Tanganuchitcharnchai, A., Jones, M., Jenjaroen, K., Vongsouvath, M., Ferguson, D. J. P., Blacksell, S. D., Newton, P. N., Day, N., et al. (2012) · PLoS neglected tropical diseases · doi:10.1371/journal.pntd.0001466 · Cited by 148
NLRC5 regulates MHC class I antigen presentation in host defense against intracellular pathogens
Yao, Y., Wang, Y., Chen, F., Huang, Y., Zhu, S., Leng, Q., Wang, H., Shi, Y., & Qian, Y. (2012) · Cell Research · doi:10.1038/cr.2012.56 · Cited by 148
Clinical manifestations of scrub typhus
Rajapakse, S., Weeratunga, P. N., Sivayoganathan, S., & Fernando, S. D. (2017) · Transactions of the Royal Society of Tropical Medicine and Hygiene · doi:10.1093/trstmh/trx017 · Cited by 136
Diagnosis of scrub typhus: recent advancements and challenges
Kala, D., Gupta, S., Nagraik, R., Verma, V., Thakur, A., & Kaushal, A. (2020) · 3 Biotech · doi:10.1007/s13205-020-02389-w · Cited by 133
Sonthayanon, P., Chierakul, W., Wuthiekanun, V., Phimda, K., Pukrittayakamee, S., Day, N., & Peacock, S. J. (2008) · Journal of Clinical Microbiology · doi:10.1128/jcm.01927-08 · Cited by 131
Miranda, M., Dionne, K. R., Sorkina, T., & Sorkin, A. D. (2006) · Molecular Biology of the Cell · doi:10.1091/mbc.e06-08-0704 · Cited by 118
Gobin, S. J. P., Keijsers, V., van Zutphen, M., & van den Elsen, P. J. (1998) · The Journal of Immunology · doi:10.4049/jimmunol.161.5.2276 · Cited by 115
NLRC5 Controls Basal MHC Class I Gene Expression in an MHC Enhanceosome-Dependent Manner
Neerincx, A., Rodriguez, G. M., Steimle, V., & Kufer, T. A. (2012) · The Journal of Immunology · doi:10.4049/jimmunol.1103136 · Cited by 114
Varghese, G. M., Janardhanan, J., Mahajan, S. K., Tariang, D., Trowbridge, P., Prakash, J. A. J., David, T., Sathendra, S., & Abraham, O. C. (2014) · Emerging infectious diseases · doi:10.3201/eid2101.140580 · Cited by 111
Gobin, S. J. P., Keijsers, V., van Zutphen, M., & van den Elsen, P. J. (1998) · PubMed · Cited by 110
Approaches to vaccines against Orientia tsutsugamushi
Valbuena, G., & Walker, D. H. (2013) · Frontiers in Cellular and Infection Microbiology · doi:10.3389/fcimb.2012.00170 · Cited by 110
The Biology of F-box Proteins: The SCF Family of E3 Ubiquitin Ligases
Nguyen, K. M., & Busino, L. (2020) · Advances in experimental medicine and biology · doi:10.1007/978-981-15-1025-0_8 · Cited by 108
Cutting Edge: Impaired MHC Class I Expression in Mice Deficient for Nlrc5/Class I Transactivator
Biswas, A., Meissner, T. B., Kawai, T., & Kobayashi, K. S. (2012) · The Journal of Immunology · doi:10.4049/jimmunol.1200064 · Cited by 107
Rubio, D., Xu, R.-H., Remakus, S., Krouse, T. E., Truckenmiller, M. E., Thapa, R. J., Balachandran, S., Alcamı́, A., Norbury, C. C., & Sigal, L. J. (2013) · Cell Host & Microbe · doi:10.1016/j.chom.2013.04.015 · Cited by 94
Ankyrin domains across the Tree of Life
Jernigan, K. K., & Bordenstein, S. R. (2014) · PeerJ · doi:10.7717/peerj.264 · Cited by 93
Ohashi, N., Koyama, Y., Urakami, H., Fukuhara, M., Tamura, A., Kawamori, F., Yamamoto, S., Kasuya, S., & Yoshimura, K. (1996) · Microbiology and Immunology · doi:10.1111/j.1348-0421.1996.tb01120.x · Cited by 91
Liu, Z., Nailwal, H., Rector, J., Rahman, M. M., Sam, R., McFadden, G., & Chan, F. K.-M. (2021) · Immunity · doi:10.1016/j.immuni.2020.11.020 · Cited by 91
Tamura, A., Takahashi, K., Tsuruhara, T., Urakami, H., MIYAMURA, S., Sekikawa, H., Kenmotsu, M., Shibata, M., Abe, S., & Nezu, H. (1984) · Microbiology and Immunology · doi:10.1111/j.1348-0421.1984.tb00743.x · Cited by 90
Mice lacking the transcription factor CIITA--a second look.
Williams, G. S., Malin, M., Vremec, D., Chang, C., Boyd, R. L., Benoist, C. O., & Mathis, D. J. (1998) · International Immunology · doi:10.1093/intimm/10.12.1957 · Cited by 89
Scrub Typhus: Historic Perspective and Current Status of the Worldwide Presence of Orientia Species
Richards, A. L., & Jiang, J. (2020) · Tropical Medicine and Infectious Disease · doi:10.3390/tropicalmed5020049 · Cited by 88
Rodriguez, G. M., Bobbala, D., Serrano, D., Mayhue, M., Champagne, A., Saucier, C., Steimle, V., Kufer, T. A., Menéndez, A., Ramanathan, S., et al. (2016) · OncoImmunology · doi:10.1080/2162402x.2016.1151593 · Cited by 83
Scrub Typhus in Continental Chile, 2016–20181
Weitzel, T., Martínez-Valdebenito, C., Acosta‐Jamett, G., Jiang, J., Richards, A. L., & Abarca, K., V (2019) · Emerging infectious diseases · doi:10.3201/eid2506.181860 · Cited by 81
Zebertavage, L., Alice, A. F., Crittenden, M. R., & Gough, M. J. (2020) · Scientific Reports · doi:10.1038/s41598-020-64408-3 · Cited by 79
Blacksell, S. D., Luksameetanasan, R., Kalambaheti, T., et al. (2008) · FEMS Immunology & Medical Microbiology · doi:10.1111/j.1574-695x.2007.00375.x · Cited by 78
Recent advances in viral evasion of the MHC Class I processing pathway
Schuren, A. B. C., Costa, A. I., & Wiertz, E. J. H. J. (2016) · Current Opinion in Immunology · doi:10.1016/j.coi.2016.02.007 · Cited by 77
Regulation of NF-κB activity by competition between RelA acetylation and ubiquitination
Li, H., Wittwer, T., Weber, A., Schneider, H., Moreno, R., Maine, G. N., Kracht, M., Schmitz, M. L., & Burstein, E. (2011) · Oncogene · doi:10.1038/onc.2011.253 · Cited by 74
Herbert, M., Squire, C. J., & Mercer, A. A. (2015) · Viruses · doi:10.3390/v7020709 · Cited by 72
A minimum folding unit in the ankyrin repeat protein p16 INK4 1 1Edited by C. R. Matthews
Zhang, B., & Peng, Z. (2000) · Journal of Molecular Biology · doi:10.1006/jmbi.2000.3803 · Cited by 72
Batty, E. M., Chaemchuen, S., Blacksell, S. D., Richards, A. L., Paris, D. H., Bowden, R. J., Chan, C., Lachumanan, R., Day, N., Donnelly, P., et al. (2018) · PLoS neglected tropical diseases · doi:10.1371/journal.pntd.0006566 · Cited by 72
Evans, S. M., Rodino, K. G., Adcox, H. E., & Carlyon, J. A. (2018) · PLoS Pathogens · doi:10.1371/journal.ppat.1007023 · Cited by 68
Self-citationVieBrock, L., Evans, S. M., Beyer, A. R., Larson, C. L., Beare, P. A., Ge, H., Sıngh, S., Rodino, K. G., Heinzen, R. A., Richards, A. L., et al. (2015) · Frontiers in Cellular and Infection Microbiology · doi:10.3389/fcimb.2014.00186 · Cited by 67
Self-citationDifferences in Clinical Features According to Boryoung and Karp Genotypes of Orientia tsutsugamushi
Kim, D., Yun, N. R., Neupane, G. P., Shin, S. H., Ryu, S. Y., Yoon, H. J., Wie, S. H., Kim, W. J., Lee, C. Y., Choi, J. S., et al. (2011) · PLoS ONE · doi:10.1371/journal.pone.0022731 · Cited by 65
Soong, L., Wang, H., Shelite, T. R., Liang, Y., Mendell, N. L., Sun, J., Gong, B., Valbuena, G., Bouyer, D. H., & Walker, D. H. (2014) · PLoS neglected tropical diseases · doi:10.1371/journal.pntd.0003191 · Cited by 65
NLRC5 Functions beyond MHC I Regulation—What Do We Know So Far?
Benkő, S., Kovács, E. G., Hezel, F., & Kufer, T. A. (2017) · Frontiers in Immunology · doi:10.3389/fimmu.2017.00150 · Cited by 65
Mohamed, M. R., Rahman, M. M., Lanchbury, J. S. S., Shattuck, D., Neff, C. D., DUFFORD, M. T. W., van Buuren, N. J., Fagan-Garcia, K., Barry, M., Smith, S. K., et al. (2009) · Proceedings of the National Academy of Sciences · doi:10.1073/pnas.0900452106 · Cited by 63
A Case of Scrub Typhus Probably Acquired in Africa
Ghorbani, R. P., Ghorbani, A. J., Jain, M., & Walker, D. H. (1997) · Clinical Infectious Diseases · doi:10.1086/516990 · Cited by 61
MHC class I transactivator NLRC5 in host immunity, cancer and beyond
Cho, S., Vijayan, S., Yoo, J., Watanabe, T., Ouda, R., An, N., & Kobayashi, K. S. (2020) · Immunology · doi:10.1111/imm.13235 · Cited by 60
A Hematogenously Disseminated Orientia tsutsugamsushi-Infected Murine Model of Scrub Typhus
Shelite, T. R., Saito, T. B., Mendell, N. L., Gong, B., Xu, G., Soong, L., Valbuena, G., Bouyer, D. H., & Walker, D. H. (2014) · PLoS neglected tropical diseases · doi:10.1371/journal.pntd.0002966 · Cited by 59
Mika-Gospodorz, B., Giengkam, S., Westermann, A. J., Wongsantichon, J., Kion-Crosby, W., Chuenklin, S., Wang, L. C., Sunyakumthorn, P., Sobota, R. M., Subbian, S., et al. (2020) · Nature Communications · doi:10.1038/s41467-020-17094-8 · Cited by 58
Expression regulation and function of NLRC5
Yao, Y., & Qian, Y. (2013) · Protein & Cell · doi:10.1007/s13238-012-2109-3 · Cited by 57
An Autotransporter Protein fromOrientia tsutsugamushiMediates Adherence to Nonphagocytic Host Cells
Ha, N., Cho, N., Ys, K., Choi, M.-S., & Kim, I.-S. (2011) · Infection and Immunity · doi:10.1128/iai.01239-10 · Cited by 57
Serologic Evidence of Scrub Typhus in the Peruvian Amazon
Kocher, C., Jiang, J., Morrison, A. C., Oré, R. M. C., Leguía, M., Loyola, S., Ampuero, J. S., Céspedes, M. J., Halsey, E. S., Bausch, D. G., et al. (2017) · Emerging infectious diseases · doi:10.3201/eid2308.170050 · Cited by 57
Active Escape of Orientia tsutsugamushi from Cellular Autophagy
Ko, Y., Choi, J. H., Ha, N., Kim, I.-S., Cho, N., & Choi, M. (2012) · Infection and Immunity · doi:10.1128/iai.00861-12 · Cited by 56
New paradigm in ankyrin repeats: Beyond protein-protein interaction module
Islam, Z., Nagampalli, R. S. K., Fatima, M. T., & Ashraf, G. M. (2017) · International Journal of Biological Macromolecules · doi:10.1016/j.ijbiomac.2017.11.101 · Cited by 55
Beyer, A. R., Rodino, K. G., VieBrock, L., Green, R. S., Tegels, B. K., Oliver, L. D., Marconi, R. T., & Carlyon, J. A. (2017) · Cellular Microbiology · doi:10.1111/cmi.12727 · Cited by 52
Self-citationLiu, S., Luo, J., Zhen, X., Qiu, J., Ouyang, S., & Luo, Z. (2020) · eLife · doi:10.7554/elife.58114 · Cited by 51
Dysregulated Th1 Immune and Vascular Responses in Scrub Typhus Pathogenesis
Soong, L. (2018) · The Journal of Immunology · doi:10.4049/jimmunol.1701219 · Cited by 49
Shelite, T. R., Liang, Y., Wang, H., Mendell, N. L., Trent, B. J., Sun, J., Gong, B., Xu, G., Hu, H., Bouyer, D. H., et al. (2016) · PLoS neglected tropical diseases · doi:10.1371/journal.pntd.0004467 · Cited by 47
Nekrep, N., Geyer, M., Jabrane‐Ferrat, N., & Peterlin, B. M. (2001) · Molecular and Cellular Biology · doi:10.1128/mcb.21.16.5566-5576.2001 · Cited by 46
Soong, L., Mendell, N. L., Olano, J. P., Rockx-Brouwer, D., Xu, G., Góez, Y., Drom, C., Shelite, T. R., Valbuena, G., Walker, D. H., et al. (2016) · PLoS neglected tropical diseases · doi:10.1371/journal.pntd.0004884 · Cited by 46
Fung, T. K., Yam, C. H., & Poon, R. Y. C. (2005) · Cell Cycle · doi:10.4161/cc.4.10.2046 · Cited by 45
Walker, J. S., Chan, C. T., Manikumaran, C., & Elisberg, B. L. (1975) · Annals of the New York Academy of Sciences · doi:10.1111/j.1749-6632.1975.tb35090.x · Cited by 44
A case of tsutsugamushi disease probably contracted in Africa
Osuga, K., Kimura, M., Goto, H., Shimada, K., & Suto, T. (1991) · European Journal of Clinical Microbiology & Infectious Diseases · doi:10.1007/bf01964418 · Cited by 43
Phenotypic Characterization of Peripheral T Cells and Their Dynamics in Scrub Typhus Patients
Cho, B., Ko, Y., Ys, K., Kim, S., Choi, M., Kim, I.-S., Kim, H., & Cho, N. (2012) · PLoS neglected tropical diseases · doi:10.1371/journal.pntd.0001789 · Cited by 42
Mehraj, V., Textoris, J., Amara, A. B., Ghigo, É., Raoult, D., Capo, C., & Mège, J. (2013) · The Journal of Infectious Diseases · doi:10.1093/infdis/jit266 · Cited by 40
Protective and Pathogenic Roles of CD8+ T Lymphocytes in Murine Orientia tsutsugamushi Infection
Hauptmann, M., Kolbaum, J., Lilla, S., Wozniak, D. M., Gharaibeh, M. H., Fleischer, B., & Keller, C. A. (2016) · PLoS neglected tropical diseases · doi:10.1371/journal.pntd.0004991 · Cited by 40
Orientia tsutsugamushi: The dangerous yet neglected foe from the East
Banerjee, A., & Kulkarni, S. (2020) · International Journal of Medical Microbiology · doi:10.1016/j.ijmm.2020.151467 · Cited by 39
Hao, J., Li, J., Zhang, Z., Yang, Y., Zhou, Q. S., Wu, T., Chen, T., Wu, Z., Zhang, P., Cui, J., et al. (2022) · Autophagy · doi:10.1080/15548627.2022.2126614 · Cited by 38
Structural Mimicry by a Bacterial F Box Effector Hijacks the Host Ubiquitin-Proteasome System
Wong, K. T. K., Perpich, J. D., Kozlov, G., Cygler, M., Kwaik, Y. A., & Gehring, K. (2017) · Structure · doi:10.1016/j.str.2016.12.015 · Cited by 37
Orientia tsutsugamushi Modulates Endoplasmic Reticulum-Associated Degradation To Benefit Its Growth
Rodino, K. G., VieBrock, L., Evans, S. M., Ge, H., Richards, A. L., & Carlyon, J. A. (2017) · Infection and Immunity · doi:10.1128/iai.00596-17 · Cited by 37
Self-citationBeyer, A. R., VieBrock, L., Rodino, K. G., Miller, D. P., Tegels, B. K., Marconi, R. T., & Carlyon, J. A. (2015) · Journal of Bacteriology · doi:10.1128/jb.00276-15 · Cited by 36
Self-citationXu, G., Mendell, N. L., Liang, Y., Shelite, T. R., Góez, Y., Soong, L., Bouyer, D. H., & Walker, D. H. (2017) · PLoS neglected tropical diseases · doi:10.1371/journal.pntd.0005763 · Cited by 36
Ibana, J. A., Schust, D. J., Sugimoto, J., Nagamatsu, T., Greene, S. J., & Quayle, A. J. (2011) · Infectious Diseases in Obstetrics and Gynecology · doi:10.1155/2011/420905 · Cited by 34
Barbash, O., Egan, E., Pontano, L. L., Kosak, J., & Diehl, J. A. (2009) · Oncogene · doi:10.1038/onc.2009.287 · Cited by 34
Min, C.-K., Kwon, Y.-J., Ha, N., Cho, B., Kim, J.-M., Kwon, E.-K., Ys, K., Choi, M., Kim, I.-S., & Cho, N. (2014) · PLoS ONE · doi:10.1371/journal.pone.0105652 · Cited by 33
Uncovering residues that regulate cyclin D1 proteasomal degradation
Feng, Q., Sekula, D., Müller, R., Freemantle, S. J., & Dmitrovsky, E. (2007) · Oncogene · doi:10.1038/sj.onc.1210309 · Cited by 33
Mótyán, J. A., Bagossi, P., Benkő, S., & Tőzsér, J. (2013) · BMC Bioinformatics · doi:10.1186/1471-2105-14-275 · Cited by 32
Meng, L., Tong, J., Wang, H., Tao, C., Wang, Q., Niu, C., Zhang, X., & Gao, Q. (2017) · Frontiers in Cellular and Infection Microbiology · doi:10.3389/fcimb.2017.00068 · Cited by 32
Chen, K., Travanty, N. V., Garshong, R. A., Crossley, D., Wasserberg, G., Apperson, C. S., Roe, R. M., & Ponnusamy, L. (2023) · Emerging infectious diseases · doi:10.3201/eid2908.230528 · Cited by 31
Trent, B. J., Liang, Y., Xing, Y., Esqueda, M., Wei, Y., Cho, N., Kim, H.-I., Ys, K., Shelite, T. R., Cai, J., et al. (2020) · PLoS neglected tropical diseases · doi:10.1371/journal.pntd.0007675 · Cited by 30
Li, X., Guo, F., Liu, Y., Chen, H., Wen, F., ZOU, B., Li, D., Qin, Q., Liu, X., Shen, Y., et al. (2015) · Oncology Letters · doi:10.3892/ol.2015.3471 · Cited by 29
Lupfer, C. R., Stokes, K. L., Kuriakose, T., & Kanneganti, T. (2017) · Journal of Virology · doi:10.1128/jvi.00377-17 · Cited by 29
Balzo, D. D. D., Capmany, A., Cebrián, I., & Damiani, M. T. (2021) · Frontiers in Immunology · doi:10.3389/fimmu.2021.662096 · Cited by 28
Giengkam, S., Kullapanich, C., Wongsantichon, J., Adcox, H. E., Gillespie, J. J., & Salje, J. (2023) · mSphere · doi:10.1128/msphere.00268-23 · Cited by 28
Self-citationAdcox, H. E., Hatke, A. L., Andersen, S. E., Gupta, S., Otto, N. B., Weber, M. M., Marconi, R. T., & Carlyon, J. A. (2021) · mBio · doi:10.1128/mbio.01816-21 · Cited by 26
Self-citationInhibition of antigen presentation by Brucella: many more than many ways
Barrionuevo, P., & Giambartolomei, G. H. (2019) · Microbes and Infection · doi:10.1016/j.micinf.2018.12.004 · Cited by 25
Price, C. T. D., & Kwaik, Y. A. (2021) · Biomolecules · doi:10.3390/biom11010112 · Cited by 25
Rodino, K. G., Adcox, H. E., Martin, R., Patel, V., Conrad, D. H., & Carlyon, J. A. (2018) · Infection and Immunity · doi:10.1128/iai.00876-18 · Cited by 23
Self-citationMostovenko, E., Saunders, S., Muldoon, P. P., Bishop, L. M., Campen, M. J., Erdely, A., & Ottens, A. K. (2021) · Toxicological Sciences · doi:10.1093/toxsci/kfab042 · Cited by 23
Self-citationKrawczyk, M., Masternak, K., Zufferey, M., Barras, E., & Reith, W. (2005) · Molecular and Cellular Biology · doi:10.1128/mcb.25.19.8607-8618.2005 · Cited by 21
MCL1 binding to the reverse BH3 motif of P18INK4C couples cell survival to cell proliferation
Whitaker, R. H., & Placzek, W. J. (2020) · Cell Death and Disease · doi:10.1038/s41419-020-2351-1 · Cited by 21
Orientia tsutsugamushi modulates cellular levels of NF-κB inhibitor p105
Wangsanut, T., Brann, K. R., Adcox, H. E., & Carlyon, J. A. (2021) · PLoS neglected tropical diseases · doi:10.1371/journal.pntd.0009339 · Cited by 21
Self-citationInthawong, M., Sunyakumthorn, P., Wongwairot, S., Anantatat, T., Dunachie, S. J., Im‐Erbsin, R., Jones, J. W., Mason, C. J., Lugo‐Roman, L. A., Blacksell, S. D., et al. (2022) · PLoS neglected tropical diseases · doi:10.1371/journal.pntd.0010611 · Cited by 20
Torchala, M., Gerguri, T., Chaleil, R. A. G., Gordon, P., Russell, F., Keshani, M., & Bates, P. A. (2019) · Proteins Structure Function and Bioinformatics · doi:10.1002/prot.25851 · Cited by 19
Sun, T., Ferrero, R. L., Girardin, S. E., Gommerman, J. L., & Philpott, D. J. (2019) · Immunology and Cell Biology · doi:10.1111/imcb.12244 · Cited by 17
Barrera, S. P., Castrejón-Téllez, V., Trinidad, M., Robles‐Escajeda, E., Vargas‐Medrano, J., Varela-Ramı́rez, A., & Miranda, M. (2015) · PLoS ONE · doi:10.1371/journal.pone.0138897 · Cited by 16
Ko, Y., Cho, N., Cho, B., Kim, I.-S., & Choi, M.-S. (2011) · Microbial Pathogenesis · doi:10.1016/j.micpath.2011.02.007 · Cited by 15
Thiriot, J., Liang, Y., Fisher, J. R., Walker, D. H., & Soong, L. (2022) · PLoS neglected tropical diseases · doi:10.1371/journal.pntd.0010459 · Cited by 15
Adcox, H. E., Berk, J. M., Hochstrasser, M., & Carlyon, J. A. (2022) · Infection and Immunity · doi:10.1128/iai.00469-22 · Cited by 13
Self-citationRobinson, D. M., Gan, E., Chan, T. C., & Huxsoll, D. L. (1977) · The Journal of Infectious Diseases · doi:10.1093/infdis/135.4.664 · Cited by 12
Noroy, C., & Meyer, D. F. (2021) · PLoS Computational Biology · doi:10.1371/journal.pcbi.1008788 · Cited by 12
Luce-Fedrow, A., Chattopadhyay, S., Chan, T., Pearson, G., Patton, J. B., & Richards, A. L. (2021) · Tropical Medicine and Infectious Disease · doi:10.3390/tropicalmed6030121 · Cited by 11
Gupta, S., Hunt, J. R., Adcox, H. E., Andersen, S. E., Gumpf, J. J., Green, R. S., Beyer, A. R., Evans, S. M., VieBrock, L., Read, C. B., et al. (2022) · Infection and Immunity · doi:10.1128/iai.00628-21 · Cited by 10
Self-citationLu, Z., Tu, G.-J., Fu, S., Shang, K., Peng, S., Chen, L., & Gu, X. (2022) · The Kaohsiung Journal of Medical Sciences · doi:10.1002/kjm2.12602 · Cited by 9
Vachiéry, N., Trap, I., Totté, P., Martinez, D., & Bensaïd, A. (1998) · Veterinary Immunology and Immunopathology · doi:10.1016/s0165-2427(97)00129-3 · Cited by 8
Neumeister, B., Faigle, M., Spitznagel, D., Mainka, A., Ograbek, A., Wieland, H., Mannowetz, N., & Rammensee, H. (2005) · Cellular and Molecular Life Sciences · doi:10.1007/s00018-005-4518-4 · Cited by 7
Two C-terminal ankyrin repeats form the minimal stable unit of the ankyrin repeat protein p18INK4c
Sklenovský, P., Banáš, P., & Otyepka, M. (2008) · Journal of Molecular Modeling · doi:10.1007/s00894-008-0300-5 · Cited by 7
Park, H., Lim, Y., Kim, M. C., Kim, S. E., Jeong, I. S., Choi, Y. D., & Kim, D. (2021) · Frontiers in Cardiovascular Medicine · doi:10.3389/fcvm.2021.795249 · Cited by 7
Severe Scrub Typhus with Enterocolitis by the Ikeda Strain of Orientia tsutsugamushi
Kim, K. H., Jung, D. S., Kim, S. Y., Kim, B., Han, S.-H., Jung, E. H., Kim, D., & Lee, H. (2012) · Infection and Chemotherapy · doi:10.3947/ic.2012.44.6.469 · Cited by 6
Lu, M., Zhou, D., Xie, S., Wang, Y., Jiang, L., Wang, W., Jiang, W., Zhou, Q., Wang, C., Zheng, C., et al. (2023) · Microbes and Infection · doi:10.1016/j.micinf.2023.105098 · Cited by 6
Tick-Borne Rickettsiosis and Tsutsugamushi Disease Recorded in 313
Chung, M., Kang, J., & Lee, J. S. (2024) · Infection and Chemotherapy · doi:10.3947/ic.2023.0105 · Cited by 2
Metadata
- Authors
- Adcox, H. E., Hunt, J. R., Allen, P. E., Siff, T. E., Rodino, K. G., Ottens, A. K., & Carlyon, J. A.
- Affiliations
- Virginia Commonwealth University (US)
- Corresponding author
- Carlyon, Jason A.
- Venue
- Nature Communications
- Published
- 2024-09-14
- Volume
- 15
- Issue
- 1
- Pages
- 8069-8069
- ISSN
- 2041-1723 (ISSN-L)
- PMC
- PMC11401901
- OpenAlex
- W4402534723
- Cited by
- 13
- References
- 152
- Citations by year
- 2026: 6 · 2025: 7
- FWCI
- 4.99
- Type
- journal article
- Language
- en
- Open access
- gold
- doi.org
- Licence
- cc-by-nc-nd
- creativecommons.org/licenses/by-nc-nd/4.0 (tdm)
- creativecommons.org/licenses/by-nc-nd/4.0 (vor)
- Locations
- Nature Communications (publishedVersion, cc-by-nc-nd)
- Research Square (acceptedVersion, cc-by)
- PubMed Central (publishedVersion, cc-by-nc-nd)
- PubMed (publishedVersion)
- RePEc: Research Papers in Economics (submittedVersion)
- DOAJ (DOAJ: Directory of Open Access Journals) (submittedVersion)
- Funders
- U.S. Department of Health & Human Services | NIH | National Institute of Allergy and Infectious Diseases (1R01 AI123346, 2R56 AI123346, 1F32 AI174656A1)
- Division of Intramural Research, National Institute of Allergy and Infectious Diseases (1R01 AI167857)
- American Heart Association (20PRE35210610)
- Topics
- Life Sciences › Immunology and Microbiology › Parasitology › Vector-borne infectious diseases
- Life Sciences › Immunology and Microbiology › Immunology › Immune Response and Inflammation
- Life Sciences › Biochemistry, Genetics and Molecular Biology › Molecular Biology › vaccines and immunoinformatics approaches
- Keywords
- Orientia tsutsugamushi, NLRC5, MHC class I expression, immune evasion, intracellular bacteria, ankyrin repeats, F-box, SCF ubiquitin ligase, proteasomal degradation, nuclear translocation, leucine-rich repeats, host-pathogen interaction
- MeSH terms
- Animals, Bacterial Proteins, Cytoplasm, Humans, Orientia tsutsugamushi, Scrub Typhus, Histocompatibility Antigens Class I, Intracellular Signaling Peptides and Proteins, Mice, Ubiquitination, Host-Pathogen Interactions, HEK293 Cells, Proteolysis
About these checks
Registry, retraction, Cites and statistics results are computed, not judged, with one exception: a printed reference that no index lists is read once by a model before it counts as a citation error. Claims are extracted by a model and kept only when their quote appears verbatim in the text; each cited source is then checked, with a model’s help, for whether it says what the claim relies on. Those verdicts can be wrong — read the claim’s quote and the cited source before relying on one.
Statistics and arithmetic are recomputed, not judged.
Confidence bands are shown only for fields calibrated on our annotated test set. None is calibrated yet, so no band is shown.
What counts as a claim ›How we measure confidence ›How we check this ›
Are you an author, or do you see a problem with this page? Request a review
Data sources
Bibliographic data: Semantic Scholar, OpenAlex, Crossref.
Contains information from the Semantic Scholar Academic Graph Datasets, made available under the ODC Attribution License (ODC-BY 1.0).
Semantic Scholar’s data is described in: Kinney, R., et al. (2023). The Semantic Scholar Open Data Platform. arXiv:2301.10140.
