Student or educator? Sign up with your school email and get 6 months of Pro free.
Cited by 18Biotin and Related StudiesPolysaccharides and Plant Cell WallsPlant Molecular Biology Research

The DOI matches its Crossref record; 55 of the 55 references it cites were found in a registry or an index.

Pupylation-based proximity labeling reveals regulatory factors in cellulose biosynthesis in Arabidopsis

Open access
Zheng, Shuai, Noack, Lise C., Khammy, Ouda, De Meyer, Andreas, Khan, Ghazanfar Abbas, De Winne, Nancy, Eeckhout, Dominique, Van Damme, Daniël, Persson, Staffan·2025·Nature Communications

Published version of a preprint

Abstract

Knowledge about how and where proteins interact provides a pillar for cell biology. Protein proximity-labeling has emerged as an important tool to detect protein interactions. Biotin-related proximity labeling approaches are by far the most commonly used but may have labeling-related drawbacks. Here, we use pupylation-based proximity labeling (PUP-IT) as a tool for protein interaction detection in plants. We show that PUP-IT readily confirmed protein interactions for several known protein complexes across different types of plant hosts and that the approach increased detection of specific interactions as compared to biotin-based proximity labeling systems. To further demonstrate the power of PUP-IT, we used the system to identify protein interactions of the protein complex that underpin cellulose synthesis in plants. Apart from known complex components, we identified the ARF-GEF BEN1 (BFA-VISUALIZED ENDOCYTIC TRAFFICKING DEFECTIVE1). We show that BEN1 contributes to cellulose synthesis by regulating both clathrin-dependent and -independent endocytosis of the cellulose synthesis protein complex from the plasma membrane. Our results highlight PUP-IT as a powerful proximity labeling system to identify protein interactions in plant cells.

Overview

The claims and statistics of this paper haven’t been checked yet.

Run the check — free, no account needed. It reads the open-access text and checks the sources it cites.

A few free checks a day · papers already verified open instantly · results are public

Integrity signals

Registry

Crossref · 10.1038/s41467-025-56192-3

Cites

55 of 55 references verified0 citation errors · 0 not checkable

Statistics

Figures

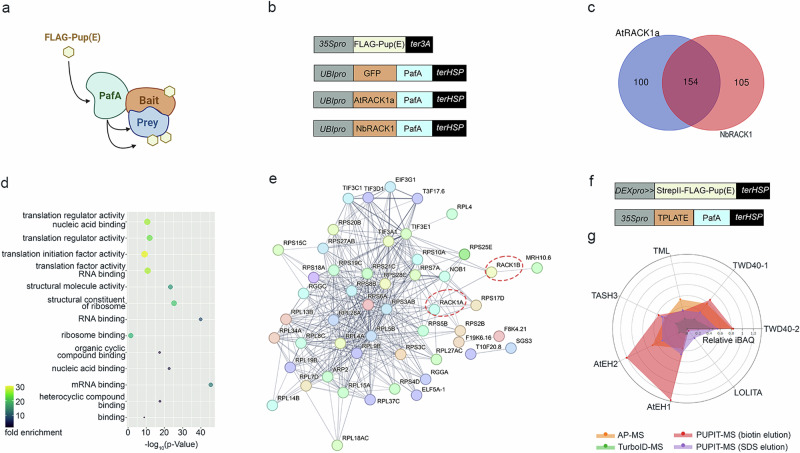
Fig. 1 PUP-IT identifies protein interactors of RACK1 and TPLATE in plant cells. a Schematic of the PUP-IT proximity labeling approach [Created in BioRender. Persson, S. (2025) https://BioRender.com/z33f531]. FLAG-Pup(E) is attached to Prey protein mediated by PafA fused to a bait protein. b Vectors designed to express the FLAG-Pup(E) and PafA fused to GFP/AtRACK1a/NbRACK1, with cassettes for PafA and Pup(E) expressions present in one binary vector. c Venn diagram generated from enriched proteins of transiently expressed AtRACK1a and NbRACK1 as PafA-baits in N. benthamiana compared to PafA-GFP, respectively. d Molecular function enrichment of proteins in the overlap of (c). e A PPI network of putative RACK1 interactors that is also supported by interactions from the String database (https://string-db.org/). Nodes indicate proteins and edges indicate interactions, with line thickness indicating the strength of data support. f Vectors designed to express STREPII-FLAG-Pup(E) under a Dexamethasone (DEX)-inducible promoter, combined with constitutive expression of PafA fused to TPLATE. g iBAQ, a measure for the abundance of TPLATE subunits. iBAQ of TPLATE subunits were normalized to the bait, TPLATE, for the different experiments (as indicated below).
Fig. 1 PUP-IT identifies protein interactors of RACK1 and TPLATE in plant cells. a Schematic of the PUP-IT proximity labeling approach [Created in BioRender. Persson, S. (2025) https://BioRender.com/z33f531]. FLAG-Pup(E) is attached to Prey protein mediated by PafA fused to a bait protein. b Vectors designed to express the FLAG-Pup(E) and PafA fused to GFP/AtRACK1a/NbRACK1, with cassettes for PafA and Pup(E) expressions present in one binary vector. c Venn diagram generated from enriched proteins of transiently expressed AtRACK1a and NbRACK1 as PafA-baits in N. benthamiana compared to PafA-GFP, respectively. d Molecular function enrichment of proteins in the overlap of (c). e A PPI network of putative RACK1 interactors that is also supported by interactions from the String database (https://string-db.org/). Nodes indicate proteins and edges indicate interactions, with line thickness indicating the strength of data support. f Vectors designed to express STREPII-FLAG-Pup(E) under a Dexamethasone (DEX)-inducible promoter, combined with constitutive expression of PafA fused to TPLATE. g iBAQ, a measure for the abundance of TPLATE subunits. iBAQ of TPLATE subunits were normalized to the bait, TPLATE, for the different experiments (as indicated below).CC BY-NC-ND · PubMed Central
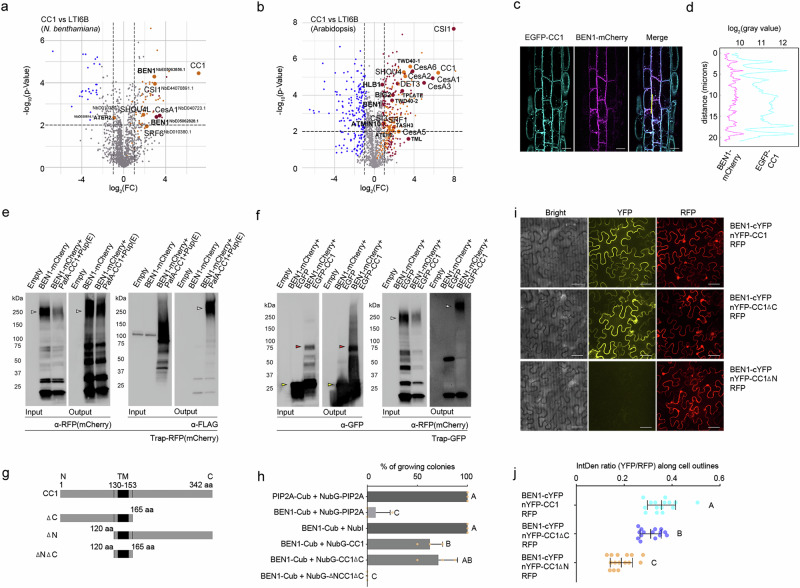
Fig. 2 Employing PUP-IT to identify proteins in cellulose synthesis. a, b Volcano plots show differently enriched proteins in the PafA-CC1 and PafA-LTI6B groups from experiments in N. benthamiana (a) and Arabidopsis seedlings (b), based on a two-sided t-test with permutation-based FDR (FDR = 0.05, S0 = 1). Orange dots represent proteins unique to the PafA-CC1 group, maroon dots represent high-abundance proteins, gray dots represent proteins with no significant differences, and blue dots represent proteins more abundant in the control. CSC and BEN1-related proteins are marked with larger dots. c Co-localization of BEN1-mCherry and EGFP-CC1 in stable transgenic Arabidopsis. Scale bar = 10 µm. d Fluorescence intensity along the transect in (c). Images were taken from cells in the root tip area of 5-day-old seedlings. e BEN1-mCherry was labeled with FLAG when co-expressed with FLAG-Pup(E) and PafA-CC1 in N. benthamiana. RFP trap was used for immunoprecipitation, and α-RFP (mCherry) or α-FLAG antibodies for western blot. p19-only samples served as control. f BEN1-mCherry was co-immunoprecipitated with EGFP-CC1 in N. benthamiana. GFP trap was used for immunoprecipitation, and α-RFP (mCherry) or α-GFP antibodies for western blot. EGFP samples served as the negative control, and p19-only samples as the empty control. Arrowheads point to proteins of interest: BEN1-mCherry (white), EGFP (yellow) and EGFP-CC1 (red). g CC1 is a transmembrane protein with its N terminal facing the cytosol and C terminal in the apoplast, C terminal truncation (∆C), N terminal truncation (∆N). h Membrane split-ubiquitin Y2H was used to detect interactions between BEN1 and CC1, with CC1 constructs designed as shown in (g). Colony growth percentages on selection media from three replicates. Values are mean + SD. Significance was determined by one-way ANOVA followed by a Tukey’s test (p < 0.05). i BiFC assay assessed the interaction between BEN1 and CC1, with CC1 constructs designed as shown in (g). Scale bar = 50 µm. j Relative YFP to RFP ratio was measured along the cell outlines in BiFC images. Values are mean ± SD. Significance was determined by one-way ANOVA followed by a Tukey’s test (p < 0.05, n = 15).
Fig. 2 Employing PUP-IT to identify proteins in cellulose synthesis. a, b Volcano plots show differently enriched proteins in the PafA-CC1 and PafA-LTI6B groups from experiments in N. benthamiana (a) and Arabidopsis seedlings (b), based on a two-sided t-test with permutation-based FDR (FDR = 0.05, S0 = 1). Orange dots represent proteins unique to the PafA-CC1 group, maroon dots represent high-abundance proteins, gray dots represent proteins with no significant differences, and blue dots represent proteins more abundant in the control. CSC and BEN1-related proteins are marked with larger dots. c Co-localization of BEN1-mCherry and EGFP-CC1 in stable transgenic Arabidopsis. Scale bar = 10 µm. d Fluorescence intensity along the transect in (c). Images were taken from cells in the root tip area of 5-day-old seedlings. e BEN1-mCherry was labeled with FLAG when co-expressed with FLAG-Pup(E) and PafA-CC1 in N. benthamiana. RFP trap was used for immunoprecipitation, and α-RFP (mCherry) or α-FLAG antibodies for western blot. p19-only samples served as control. f BEN1-mCherry was co-immunoprecipitated with EGFP-CC1 in N. benthamiana. GFP trap was used for immunoprecipitation, and α-RFP (mCherry) or α-GFP antibodies for western blot. EGFP samples served as the negative control, and p19-only samples as the empty control. Arrowheads point to proteins of interest: BEN1-mCherry (white), EGFP (yellow) and EGFP-CC1 (red). g CC1 is a transmembrane protein with its N terminal facing the cytosol and C terminal in the apoplast, C terminal truncation (∆C), N terminal truncation (∆N). h Membrane split-ubiquitin Y2H was used to detect interactions between BEN1 and CC1, with CC1 constructs designed as shown in (g). Colony growth percentages on selection media from three replicates. Values are mean + SD. Significance was determined by one-way ANOVA followed by a Tukey’s test (p < 0.05). i BiFC assay assessed the interaction between BEN1 and CC1, with CC1 constructs designed as shown in (g). Scale bar = 50 µm. j Relative YFP to RFP ratio was measured along the cell outlines in BiFC images. Values are mean ± SD. Significance was determined by one-way ANOVA followed by a Tukey’s test (p < 0.05, n = 15).CC BY-NC-ND · PubMed Central
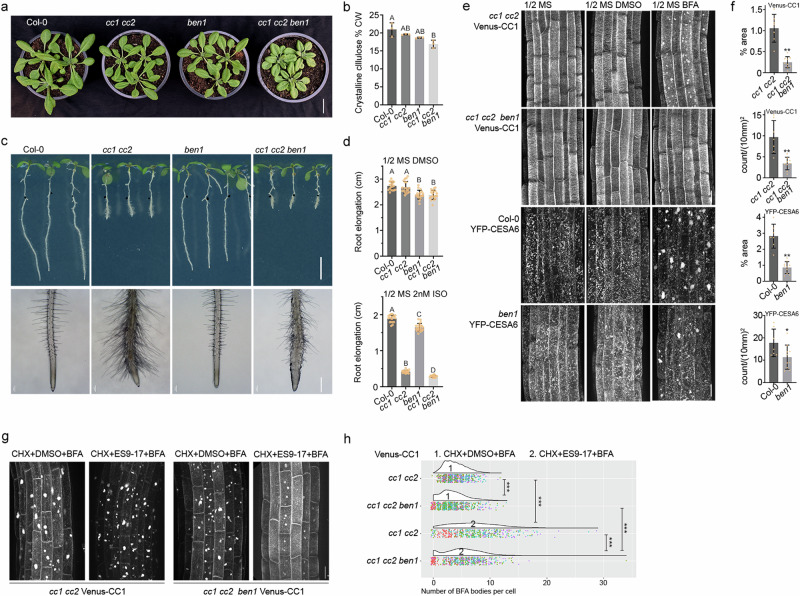
Fig. 3 BEN1 impacts cellulose synthesis. a Five-day-old seedlings grown on 1/2 MS media were transferred to soil and grown for 18 days in the greenhouse. Scale bar = 2 cm. b Rosette leaves were harvested from plants as those in (a) and cellulose levels were measured. Values are mean ± SD. Significance was determined by one-way ANOVA followed by a Tukey’s test (p < 0.05, n = 3). c Three-day-old seedlings grown on 1/2 MS media were transferred to media with 2 nM isoxaben for an additional 4 days. Scale bar = 0.5 cm (root elongation), scale bar = 0.5 mm (root tip area). d Root elongation after transfer to plates as indicated. Values are mean +/− SD. Significance was determined by one-way ANOVA followed by a Tukey’s test (p < 0.05, n ≥ 15). e Venus-CC1 and YFP-CESA6 in ben1 or wild-type were imaged following BFA (50 μM for 30 min) or DMSO (control) treatments. Scale bar = 20 µm. f BFA body distribution across cells in the root area, percentage area (% area; upper panel) and count per mm2 (lower panel) were used for statistical analyses. Values are mean±SD. Significance was determined by a two-sided t-test (* p < 0.05, ** p < 0.01, images from independent seedlings n > 5). g Venus-CC1 in ben1 or wild-type backgrounds were imaged following CHX + ES9-17/DMSO + BFA treatment (CHX 50 µM for 60 min, followed by ES9-17 30 µM /DMSO for 30 min, then BFA 50 µM for 30 min.). Scale bar = 20 µm. h BFA body distribution was reflected by the number of BFA bodies per cell; ≥100 cells were counted from images of independent seedlings n > 5 for each experiment repeated four times. Data from each replicate is shown in a different color. Significance was determined by the Kruskal-Wallis test, followed by pairwise comparison using Wilcoxon test, *** p < 0.001.
Fig. 3 BEN1 impacts cellulose synthesis. a Five-day-old seedlings grown on 1/2 MS media were transferred to soil and grown for 18 days in the greenhouse. Scale bar = 2 cm. b Rosette leaves were harvested from plants as those in (a) and cellulose levels were measured. Values are mean ± SD. Significance was determined by one-way ANOVA followed by a Tukey’s test (p < 0.05, n = 3). c Three-day-old seedlings grown on 1/2 MS media were transferred to media with 2 nM isoxaben for an additional 4 days. Scale bar = 0.5 cm (root elongation), scale bar = 0.5 mm (root tip area). d Root elongation after transfer to plates as indicated. Values are mean +/− SD. Significance was determined by one-way ANOVA followed by a Tukey’s test (p < 0.05, n ≥ 15). e Venus-CC1 and YFP-CESA6 in ben1 or wild-type were imaged following BFA (50 μM for 30 min) or DMSO (control) treatments. Scale bar = 20 µm. f BFA body distribution across cells in the root area, percentage area (% area; upper panel) and count per mm2 (lower panel) were used for statistical analyses. Values are mean±SD. Significance was determined by a two-sided t-test (* p < 0.05, ** p < 0.01, images from independent seedlings n > 5). g Venus-CC1 in ben1 or wild-type backgrounds were imaged following CHX + ES9-17/DMSO + BFA treatment (CHX 50 µM for 60 min, followed by ES9-17 30 µM /DMSO for 30 min, then BFA 50 µM for 30 min.). Scale bar = 20 µm. h BFA body distribution was reflected by the number of BFA bodies per cell; ≥100 cells were counted from images of independent seedlings n > 5 for each experiment repeated four times. Data from each replicate is shown in a different color. Significance was determined by the Kruskal-Wallis test, followed by pairwise comparison using Wilcoxon test, *** p < 0.001.CC BY-NC-ND · PubMed Central

Verification

Claims the paper makes

The claims and statistics of this paper haven’t been checked yet.

Run the check — free, no account needed. It reads the open-access text and checks the sources it cites.

A few free checks a day · papers already verified open instantly · results are public

Self-check

Percentages, sums and reported differences re-computed from the paper’s own numbers.

The self-check needs the paper’s full text.

Citations

Cites

Show all 55 references

Metadata

Authors
Zheng, S., Noack, L. C., Khammy, O., De Meyer, A., Khan, G. A., De Winne, N., Eeckhout, D., Van Damme, D., & Persson, S.
Affiliations
  • University of Copenhagen (DK)
  • Deakin University (AU)
  • Ghent University (BE)
Corresponding author
Persson, Staffan
Venue
Nature Communications
Published
2025-01-20
Volume
16
Issue
1
Pages
872-872
ISSN
2041-1723 (ISSN-L)
OpenAlex
W4406609724
Cited by
18
References
55
Citations by year
2026: 12 · 2025: 6
FWCI
8.99
Type
journal article
Language
en
Open access
Licence
Locations
  • Nature Communications (publishedVersion, cc-by-nc-nd)
  • Research Square (acceptedVersion, cc-by)
  • PubMed Central (publishedVersion, cc-by-nc-nd)
  • PubMed (publishedVersion)
  • Research at the University of Copenhagen (University of Copenhagen) (publishedVersion, cc-by-nc-nd)
  • Ghent University Academic Bibliography (Ghent University) (submittedVersion, cc-by-nc-nd)
  • RePEc: Research Papers in Economics (submittedVersion)
  • DOAJ (DOAJ: Directory of Open Access Journals) (submittedVersion, cc-by-sa)
  • Figshare (submittedVersion, cc-by-nc-nd)
Funders
  • Novo Nordisk Fonden (19OC0056076, 20OC0060564, 23OC0086341)
  • Villum Fonden (25915)
Topics
  • Life Sciences › Biochemistry, Genetics and Molecular Biology › Cell Biology › Biotin and Related Studies
  • Life Sciences › Agricultural and Biological Sciences › Plant Science › Polysaccharides and Plant Cell Walls
  • Life Sciences › Agricultural and Biological Sciences › Plant Science › Plant Molecular Biology Research
Keywords
protein-protein interaction, cellulose biosynthesis, Arabidopsis thaliana, ARF-GEF, clathrin-mediated endocytosis, clathrin-independent endocytosis, plasma membrane, plant cell wall, protein complexes
MeSH terms
Biotin, Cell Membrane, Cellulose, Clathrin, Endocytosis, Glucosyltransferases, Staining and Labeling, Arabidopsis, Protein Interaction Mapping, Arabidopsis Proteins

About these checks

Registry, retraction, Cites and statistics results are computed, not judged, with one exception: a printed reference that no index lists is read once by a model before it counts as a citation error. Claims are extracted by a model and kept only when their quote appears verbatim in the text; each cited source is then checked, with a model’s help, for whether it says what the claim relies on. Those verdicts can be wrong — read the claim’s quote and the cited source before relying on one.

Statistics and arithmetic are recomputed, not judged.

Confidence bands are shown only for fields calibrated on our annotated test set. None is calibrated yet, so no band is shown.

What counts as a claim ›How we measure confidence ›How we check this ›

Are you an author, or do you see a problem with this page? Request a review

How to cite

Cite CoChat for the checks on this page, and the paper for its own findings.

This page
CoChat. (2026). Citation check: Pupylation-based proximity labeling reveals regulatory factors in cellulose biosynthesis in Arabidopsis. https://app.cochat.ai/papers/10.1038/s41467-025-56192-3
The paper
Zheng, S., Noack, L. C., Khammy, O., De Meyer, A., Khan, G. A., De Winne, N., Eeckhout, D., Van Damme, D., & Persson, S. (2025). Pupylation-based proximity labeling reveals regulatory factors in cellulose biosynthesis in Arabidopsis. Nature Communications. https://doi.org/10.1038/s41467-025-56192-3

Data sources

Bibliographic data: Semantic Scholar, OpenAlex, Crossref.

Contains information from the Semantic Scholar Academic Graph Datasets, made available under the ODC Attribution License (ODC-BY 1.0).

Semantic Scholar’s data is described in: Kinney, R., et al. (2023). The Semantic Scholar Open Data Platform. arXiv:2301.10140.