

The DOI matches its Crossref record; 72 of the 72 references it cites were found in a registry or an index; 22 of the 60 sources its claims cite were checked for support.
Self-supervised learning reveals clinically relevant histomorphological patterns for therapeutic strategies in colon cancer
Open accessPublished version of a preprint
Abstract
Unsupervised extraction of 47 histomorphological phenotype clusters (HPCs) from H&E reveals tumor stroma and immune landscape features that predict survival and treatment response in colon cancer.
Overview
CoChat Summary
TL;DR
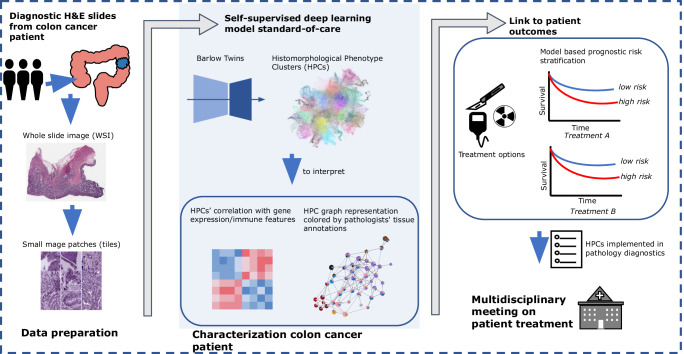
The paper uses self-supervised learning on colon cancer H&E whole-slide images to derive 47 histomorphological phenotype clusters (HPCs) and shows they are reproducible across TCGA and the AVANT clinical trial. These HPCs were associated with overall survival, outperformed a clinical baseline model, and were linked to stromal, immune, and oncogenic features that may help explain treatment response.
Key findings
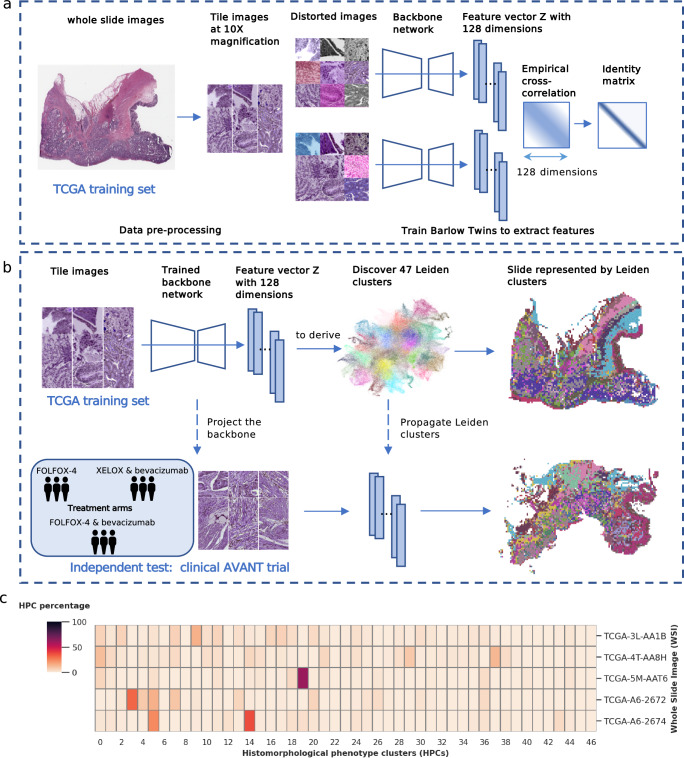
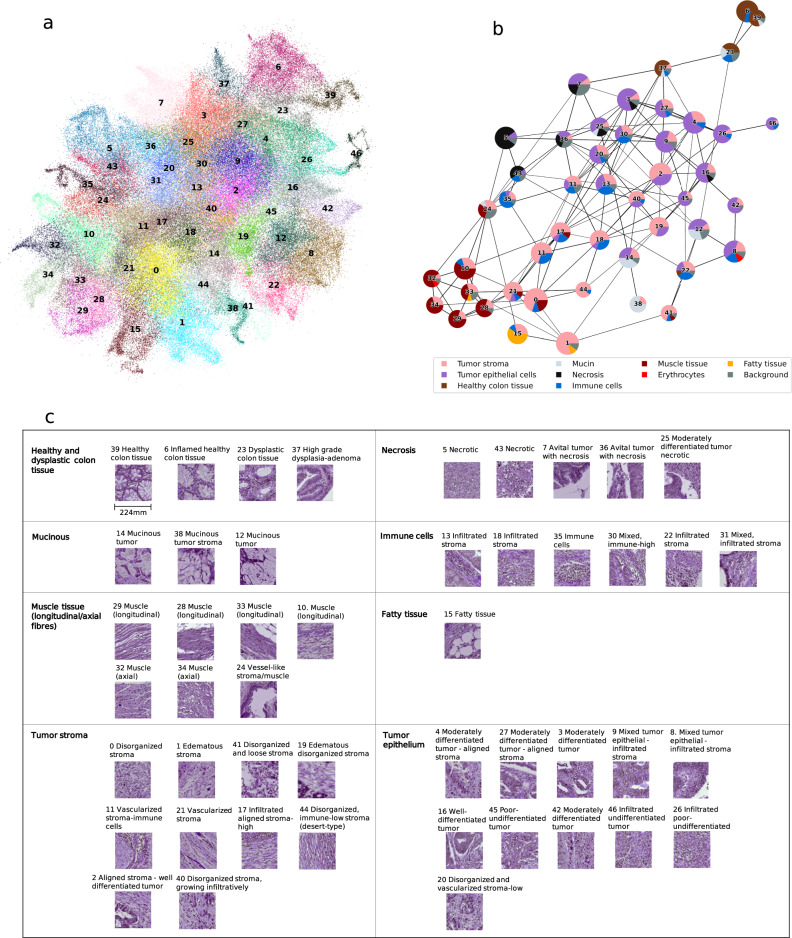
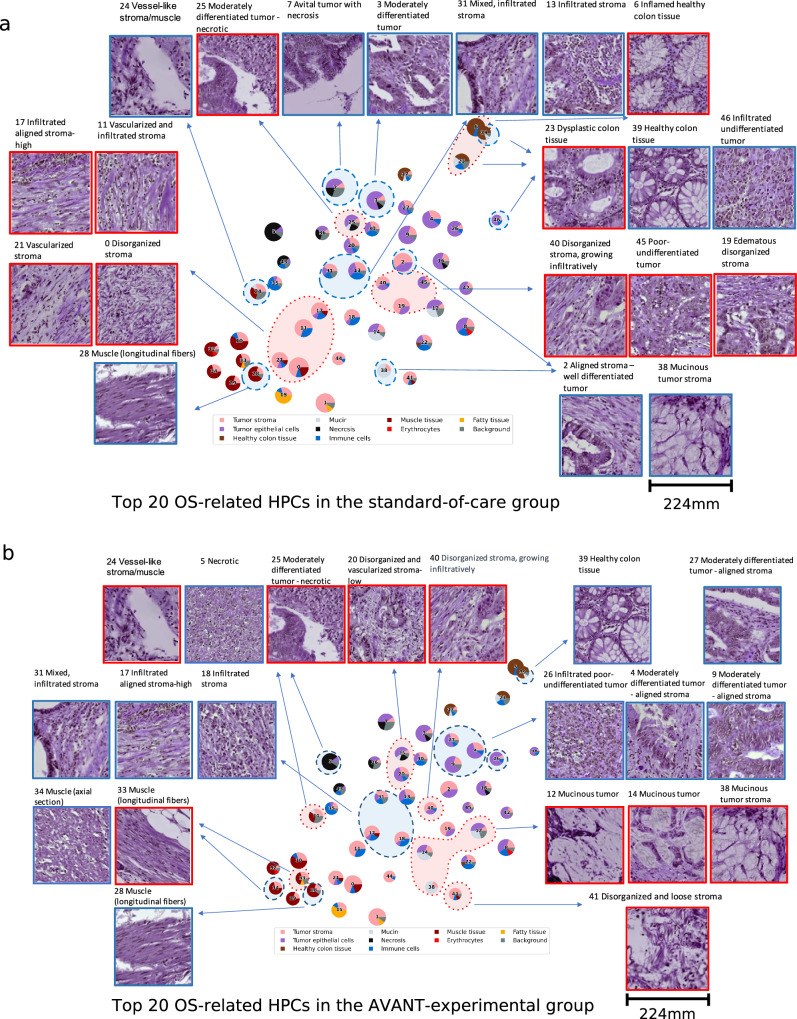
- Trained on 435 TCGA-COAD WSIs from 428 patients, the Barlow Twins encoder produced 128-dimensional tile features, and Leiden clustering identified 47 HPCs.
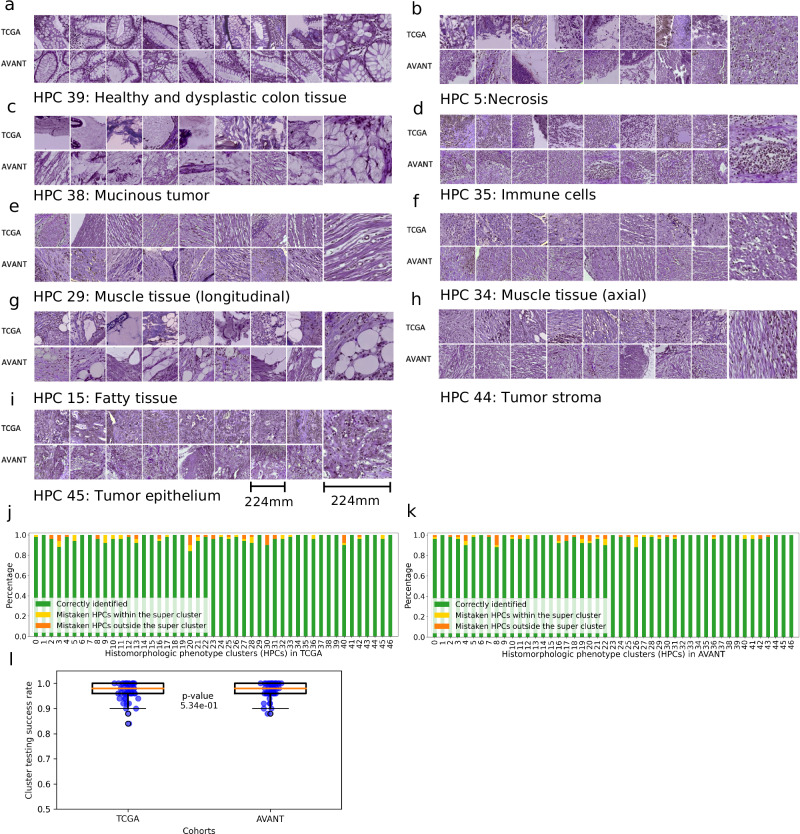
- In the external AVANT cohort (1,213 WSIs), HPCs transferred well: 17/47 HPCs had 100% identification in TCGA and 17/47 in AVANT; the remaining HPCs were identified at 84%–98% in TCGA and 88%–98% in AVANT.
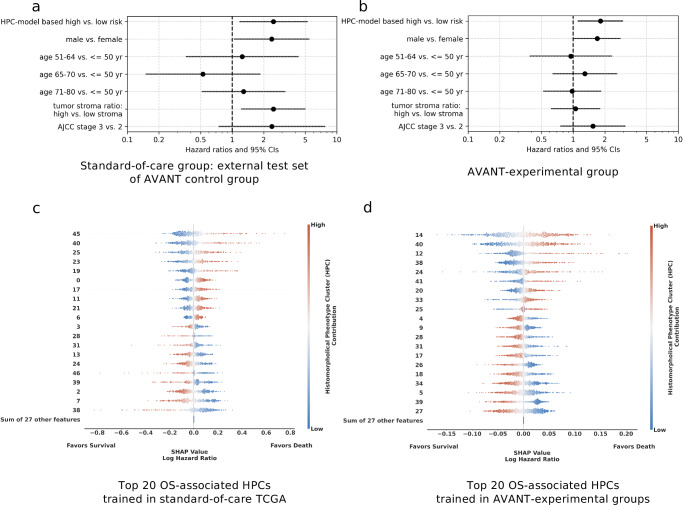
- An HPC-based OS model trained in TCGA achieved a test-set c-index of 0.65 (95% CI 0.55–0.74) in the AVANT control group, outperforming a clinical baseline model (c-index 0.58, 95% CI 0.49–0.67).
- The HPC-based risk classifier remained independently prognostic in AVANT after adjustment: HR = 2.50 (95% CI 1.18–5.31) in the standard-care group and HR = 1.82 (95% CI 1.11–2.99) in the bevacizumab-treated experimental group.
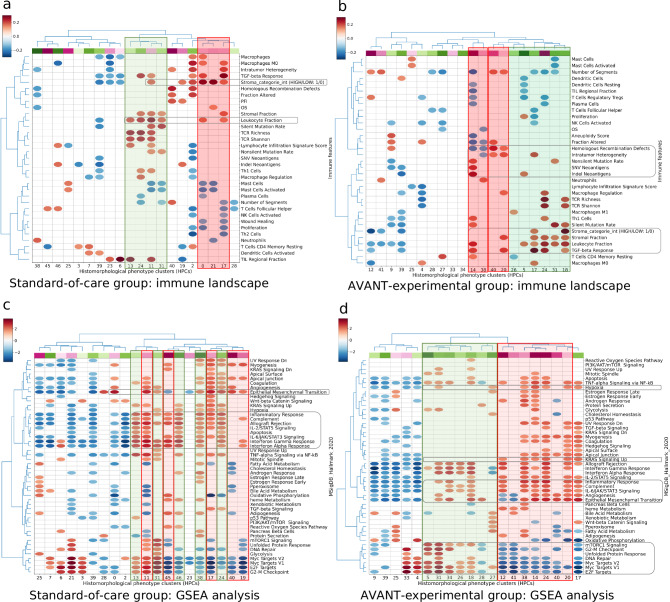
- Histology associated with better survival included healthy colon tissue and immune-cell-rich / aligned-stroma HPCs, while mucinous, poor-to-undifferentiated, and disorganized stroma-high patterns were associated with worse survival; the paper also reports links to immune fractions and oncogenic pathways such as VEGFa, hypoxia, angiogenesis, KRAS signaling, and cell-cycle/DNA-repair pathways.
Methods
- Design: Retrospective multi-cohort analysis using SSL feature extraction plus unsupervised clustering, followed by survival modeling and biological annotation.
- Data/sample: Training on TCGA-COAD H&E WSIs (final set 435 WSIs / 428 patients); external validation on AVANT colon cancer WSIs (1,213 WSIs, one per patient), with separate analyses for standard-care and bevacizumab-treated groups.
- Main analysis: Barlow Twins SSL extracted tile embeddings from 224×224 tiles at 10x magnification; Leiden community detection formed HPCs; 5-fold CV L2-regularized Cox regression predicted OS; SHAP, Spearman correlations, and GSEA were used to interpret prognostic HPCs.
Limitations
- The paper states that HPCs were derived from small image tiles, so larger contextual information is likely lost; this can make some tissue distinctions difficult.
- The paper states that using TCGA as the training set may introduce bias and variability in data quality across participating institutions.
- The paper states that it could predict overall survival rather than DFS because of data availability.
- The paper states that, because of the AVANT regimen design, a separate analysis of bevacizumab vs oxaliplatin-based chemotherapy was not attainable.
Model-written summary. Check it against the paper before relying on it.
Integrity signals
Registry
Cites
Statistics
Figures
Verification
Claims the paper makes
16 Valid · 1 Not valid · 10 Not checked · 122 Own results and interpretations
The cited sources support only part of this claim — read each source’s verdict below.
In the paper
“Moreover, carriers of MNAT1 gene, which is one of the leading genes in the G2/M checkpoint pathway58, were linked to better treatment outcome of FOLFOX54.”
§ Self-supervised learning reveals clinically relevant histomorphological patterns for therapeutic strategies in colon cancer > Discussion
What the sources say
- Partly supportedcites [54] Kap, E. J. et al. Genetic variants in dna repair genes as potential predictive markers for oxaliplatin chemotherapy in colorectal cancer. pharmacogenomics J. 15, 505–512 (2015). sourceExperimental — accuracy not yet measured
The Results report that carriers of specific MNAT1 variant alleles had better overall survival after oxaliplatin treatment. The study assessed oxaliplatin-treated colorectal cancer patients, not a FOLFOX-only group, and the association concerns MNAT1 variants rather than simply carrying the gene. (LLM, conf=0.84)
- Could not verifycites [58] Liberzon, A. et al. The molecular signatures database hallmark gene set collection. Cell Syst. 1, 417–425 (2015). sourceExperimental — accuracy not yet measured
The Results section on matching hallmark enrichment scores to protein phenotypes examines cancer cell lines and protein profiles, not FOLFOX treatment outcomes. Searches for MNAT1 and FOLFOX found no passage in our copy linking MNAT1 carriers to better treatment outcomes. The indexed passages provide no page numbers. (LLM, conf=0.76)
plainstates an association- Asserted: passes — The authors put it forward as true.
- Checkable: passes — It can be checked against evidence.
- Load-bearing: unclear — It is unclear whether the paper’s conclusions depend on it.
- Based: passes — The paper gives a reason why it holds.
- Partly supported
The cited sources support only part of this claim — read each source’s verdict below.
In the paper
“Interestingly, patients with altered DNA repair capacity showed greater benefits from treatment with oxaliplatin54,57.”
§ Self-supervised learning reveals clinically relevant histomorphological patterns for therapeutic strategies in colon cancer > Discussion
What the sources say
- Partly supportedcites [54] Kap, E. J. et al. Genetic variants in dna repair genes as potential predictive markers for oxaliplatin chemotherapy in colorectal cancer. pharmacogenomics J. 15, 505–512 (2015). sourceExperimental — accuracy not yet measured
The Discussion (page unavailable) reports improved overall survival after oxaliplatin treatment among colorectal cancer patients carrying particular MNAT1 or XPC variants and says this suggests greater benefit in patients with altered DNA repair capacity. The citing sentence presents that inference as an established finding, although the paper treats the variants as potential predictive markers and does not report a direct measure of repair capacity. (LLM, conf=0.86)
- Not checked — no full text of the sourcecites [57] Vodicka, P., Vodenkova, S., Buchler, T. & Vodickova, L. Dna repair capacity and response to treatment of colon cancer. Pharmacogenomics 20, 1225–1233 (2019). source
plainstates an association- Asserted: passes — The authors put it forward as true.
- Checkable: passes — It can be checked against evidence.
- Load-bearing: unclear — It is unclear whether the paper’s conclusions depend on it.
- Based: passes — The paper gives a reason why it holds.
- Partly supported
Every source the paper cites for this claim was checked and supports it.
In the paper
“Such a histopathological pattern is frequently observed in MSI tumors50.”
§ Self-supervised learning reveals clinically relevant histomorphological patterns for therapeutic strategies in colon cancer > Discussion
What the sources say
- Supportedcites [50] Shia J., et al. Morphological characterization of colorectal cancers in the cancer genome atlas reveals distinct morphology–molecular associations: clinical and biological implications. Mod. Pathol, 30, 599–609 (2017). source
In “The Spectrum of Tumor Morphological Patterns,” the paper describes characteristic MSI-H histology and reports higher frequencies of medullary or medullary-like morphology, mucinous features, and increased tumor-infiltrating lymphocytes in MSI-H tumors than in non-MSI-H tumors. The citing sentence does not specify which pattern “such a pattern” refers to, but the paper supports the general association. (LLM, conf=0.86)
plainstates an association- Asserted: passes — The authors put it forward as true.
- Checkable: passes — It can be checked against evidence.
- Load-bearing: unclear — It is unclear whether the paper’s conclusions depend on it.
- Based: passes — The paper gives a reason why it holds.
- Supported
Every source the paper cites for this claim was checked and supports it.
In the paper
“and the KRAS G12D mutation was predictive of an inferior response to FOLFOX55.”
§ Self-supervised learning reveals clinically relevant histomorphological patterns for therapeutic strategies in colon cancer > Discussion
What the sources say
- Supportedcites [55] Zhu, G., Pei, L., Xia, H., Tang, Q. & Bi, F. Role of oncogenic kras in the prognosis, diagnosis and treatment of colorectal cancer. Mol. cancer 20, 1–17 (2021). source
In “Prognostic and predictive value of KRAS mutations,” the paper identifies FOLFOX as the chemotherapy under discussion and immediately states that KRAS mutations, especially G12D, predict an inferior response to chemotherapy. This supports the paraphrase in the cited context. (LLM, conf=0.91)
plainstates an association- Asserted: passes — The authors put it forward as true.
- Checkable: passes — It can be checked against evidence.
- Load-bearing: unclear — It is unclear whether the paper’s conclusions depend on it.
- Based: passes — The paper gives a reason why it holds.
- Supported
A result the paper reports from its own data — it cites no other source for it, so there is none to check. The quote shows it is in the paper.
In the paper
“An HPC-based classifier trained using TCGA data for OS, demonstrates prognostic significance in the external validation of the AVANT study, even when considering key clinical and demographic factors typically employed in clinical settings.”
§ Self-supervised learning reveals clinically relevant histomorphological patterns for therapeutic strategies in colon cancer > Introduction
boostedstates an association- Asserted: passes — The authors put it forward as true.
- Checkable: passes — It can be checked against evidence.
- Load-bearing: passes — The paper’s conclusions depend on it.
- Based: passes — The paper gives a reason why it holds.
85 more claims
Create a free account to see all 149 claims and to verify the 12 references still open.
- It may state two separate claims as one. 36
- Probably not a substantial claim. 33
- The quote only partly states this claim. 1
Citations
Cites
Subramanian, A., Tamayo, P., Mootha, V. K., Mukherjee, S., Ebert, B. L., Gillette, M. A., Paulovich, A., Pomeroy, S. L., Golub, T. R., Lander, E. S., et al. (2005) · Proceedings of the National Academy of Sciences · doi:10.1073/pnas.0506580102 · Cited by 53,625
A Unified Approach to Interpreting Model Predictions
Lundberg, S., & Lee, S.-I. (2017) · arXiv · doi:10.48550/arxiv.1705.07874 · Cited by 23,707
The Molecular Signatures Database Hallmark Gene Set Collection
Liberzon, A., Birger, C., Thorvaldsdóttir, H., Ghandi, M., Mesirov, J. P., & Tamayo, P. (2015) · Cell Systems · doi:10.1016/j.cels.2015.12.004 · Cited by 13,807
Bevacizumab plus Irinotecan, Fluorouracil, and Leucovorin for Metastatic Colorectal Cancer
Hurwitz, H., Fehrenbacher, L., Novotny, W., Cartwright, T., Hainsworth, J., Heim, W., Berlin, J., Baron, A., Griffing, S., Holmgren, E., et al. (2004) · New England Journal of Medicine · doi:10.1056/nejmoa032691 · Cited by 10,968 · cited 13×
“Subsequently, as several phase III trials had demonstrated that FOLFOX and XELOX are comparable in the context of metastatic colorectal cancer 33 – 35 , we thuscombinedthebevacizumab+FOLFOX-4andbevacizumab+XELOX groups into a uni fi ed “ AVANT-experimental group ” and conducted a separate analysis…”
InfluentialUMAP: Uniform Manifold Approximation and Projection
McInnes, L., Healy, J., Saul, N., & Großberger, L. (2018) · Journal of Open Source Software · doi:10.21105/joss.00861 · Cited by 9,826
The Immune Landscape of Cancer
Thorsson, V., Gibbs, D. L., Brown, S. D., Wolf, D., Bortone, D. S., Ou Yang, T.-H., Porta-Pardo, E., Gao, G. F., Plaisier, C. L., Eddy, J. A., et al. (2018) · Immunity · doi:10.1016/j.immuni.2018.03.023 · Cited by 5,870
From Louvain to Leiden: guaranteeing well-connected communities
Traag, V. A., Waltman, L., & van Eck, N. J. (2019) · Scientific Reports · doi:10.1038/s41598-019-41695-z · Cited by 5,635 · cited 2×
“1), insuch way to maximize the difference between the actual number of edges and the expected number of edges in a community 66 .”
Liu, J., Lichtenberg, T., Hoadley, K. A., Poisson, L. M., Lazar, A. J., Cherniack, A. D., Kovatich, A. J., Benz, C. C., Levine, D. A., Lee, A. V., et al. (2018) · Cell · doi:10.1016/j.cell.2018.02.052 · Cited by 3,725
Performance of neural network basecalling tools for Oxford Nanopore sequencing
Wick, R. R., Judd, L. M., & Holt, K. E. (2019) · Genome Biology · doi:10.1186/s13059-019-1727-y · Cited by 3,221
Saltz, L. B., Clarke, S., Díaz-Rubio, E., Scheithauer, W., Figer, A., Wong, R., Koski, S., Lichinitser, M., Yang, T.-S., Rivera, F., et al. (2008) · Journal of Clinical Oncology · doi:10.1200/jco.2007.14.9930 · Cited by 2,955
Research works printed but not linked: 3
- Chen, R. J. & Krishnan, R. G. Self-supervised vision transformers learn visual concepts in histopathology. Learning Meaningful Representations of Life, NeurIPS (2021).
- Gueréndel C., Arnold P., & Torben-Nielsen B. Creating small but meaningful representations of digital pathology images. In Atzori M., et al., editors, Proceedings of the MICCAI Workshop on Computational Pathology, volume 156 of Proceedings of Machine Learning Research, pages 206–215. (PMLR, 27, 2021).
- Nagtegaal I. D., Arends M., & Odze R. Tumours of the colon and rectum: Who classification of tumours of the colon and rectum, tnm staging of carcinomas of the colon and rectum and the introduction. In World Health Organization Classification of Tumours of the Digestive System, pages 157–162. (IARC Press, 2019_.
Cited by
Polack, M., Smit, M. A., van Pelt, G. W., Roodvoets, A. G. H., Meershoek-Klein Kranenbarg, E., Putter, H., Gelderblom, H., Crobach, A. S. L. P., Terpstra, V., Petrushevska, G., et al. (2024) · ESMO Open · doi:10.1016/j.esmoop.2024.102988 · Cited by 30
Self-citationTakamatsu, M. (2025) · British Journal of Cancer · doi:10.1038/s41416-025-03206-y · Cited by 18
Zhou, X., Dai, J., Lu, Y., Zhao, Q., Liu, Y., Wang, C., Zhao, Z., Wang, C., Gao, Z., Yu, Y., et al. (2024) · BMC Cancer · doi:10.1186/s12885-024-13292-5 · Cited by 9
Liu, L., Zhang, Y., Zhao, X., Zhu, M., Liang, J.-W., Jiang, Z., Zhang, J.-Q., Ma, J., Wang, Z., Gan, M., et al. (2025) · Computer Methods and Programs in Biomedicine · doi:10.1016/j.cmpb.2025.108895 · Cited by 8
Zhu, H., Huang, Y., Wang, X., Xiang, W., & Xie, Y. (2025) · Frontiers in Immunology · doi:10.3389/fimmu.2025.1604216 · Cited by 7
“Additionally, Liu et al. (88) developed a self-supervised learning (SSL) framework based on the Barlow Twins method to analyze over 1,600 H&E-stained colon cancer slides from TCGA-COAD and AVANT cohorts.”
Metadata
- Authors
- Liu, B., Polack, M., Coudray, N., Claudio Quiros, A., Sakellaropoulos, T., Le, H., Karimkhan, A., Crobach, A. S. L. P., van Krieken, J. H. J. M., Yuan, K., Tollenaar, R. A. E. M., Mesker, W. E., & Tsirigos, A.
- Affiliations
- Karolinska Institutet (SE)
- Leiden University Medical Center (NL)
- New York University (US)
- University of Glasgow (GB)
- NYU Langone Health (US)
- Corresponding author
- Tsirigos, Aristotelis
- ORCID
- Venue
- Nature Communications
- Published
- 2025-03-08
- Volume
- 16
- Issue
- 1
- Pages
- 2328-2328
- ISSN
- 2041-1723 (ISSN-L)
- PMC
- PMC11890774
- OpenAlex
- W4408246989
- Semantic Scholar
- 61c79f7e44f6f1b786ff66dd5a48ee1ebafc7a3a
- Cited by
- 25
- References
- 68
- Citations by year
- 2026: 16 · 2025: 6
- FWCI
- 8.76
- Type
- journal article
- Language
- en
- Open access
- gold
- doi.org
- Licence
- cc-by
- creativecommons.org/licenses/by/4.0 (tdm)
- creativecommons.org/licenses/by/4.0 (vor)
- Locations
- Nature Communications (publishedVersion, cc-by)
- bioRxiv (Cold Spring Harbor Laboratory) (acceptedVersion, cc-by-nc-nd)
- Europe PMC (PubMed Central) (publishedVersion, cc-by)
- PubMed Central (publishedVersion, cc-by)
- PubMed (publishedVersion)
- ENLIGHTEN (Jurnal Bimbingan dan Konseling Islam) (acceptedVersion, cc-by-sa)
- Leiden Repository (Leiden University) (submittedVersion, cc-by)
- PubMed Central (submittedVersion, cc-by-nc-nd)
- RePEc: Research Papers in Economics (submittedVersion)
- DOAJ (DOAJ: Directory of Open Access Journals) (submittedVersion, cc-by-sa)
- Leiden Repository (Leiden University) (submittedVersion)
- Funders
- Vetenskapsrådet (2019-06360)
- National Institutes of Health
- Genentech
- National Cancer Institute (P30CA016087)
- Topics
- Physical Sciences › Computer Science › Artificial Intelligence › AI in cancer detection
- Health Sciences › Medicine › Radiology, Nuclear Medicine and Imaging › Radiomics and Machine Learning in Medical Imaging
- Life Sciences › Biochemistry, Genetics and Molecular Biology › Molecular Biology › Single-cell and spatial transcriptomics
- Keywords
- colon adenocarcinoma, self-supervised learning, Barlow Twins, whole slide images, tumor stroma, immune landscape, adjuvant chemotherapy response, overall survival prediction, personalized treatment
About these checks
Registry, retraction, Cites and statistics results are computed, not judged, with one exception: a printed reference that no index lists is read once by a model before it counts as a citation error. Claims are extracted by a model and kept only when their quote appears verbatim in the text; each cited source is then checked, with a model’s help, for whether it says what the claim relies on. Those verdicts can be wrong — read the claim’s quote and the cited source before relying on one.
The claim verdicts this report counts are experimental: their accuracy is not yet measured.
A language model drew the claims from the paper on 2026-10-10, under version 3 of the claim definition (model deepseek-v4.1-flash, prompt extract-v3).
A second model labelled each claim on 2026-10-10 (model jev-1.13-20260917, definition revision gold-guideline-v0.2).
Cited sources are checked with a language model’s help (gpt-6-sol).
Statistics and arithmetic are recomputed, not judged.
Confidence bands are shown only for fields calibrated on our annotated test set. None is calibrated yet, so no band is shown.
What counts as a claim ›How we measure confidence ›How we check this ›
Are you an author, or do you see a problem with this page? Request a review
How to cite
Cite CoChat for the checks on this page, and the paper for its own findings.
- This page
- CoChat. (2026). Citation check: Self-supervised learning reveals clinically relevant histomorphological patterns for therapeutic strategies in colon cancer. https://app.cochat.ai/papers/10.1038/s41467-025-57541-y
- The paper
- Liu, B., Polack, M., Coudray, N., Claudio Quiros, A., Sakellaropoulos, T., Le, H., Karimkhan, A., Crobach, A. S. L. P., van Krieken, J. H. J. M., Yuan, K., Tollenaar, R. A. E. M., Mesker, W. E., & Tsirigos, A. (2025). Self-supervised learning reveals clinically relevant histomorphological patterns for therapeutic strategies in colon cancer. Nature Communications. https://doi.org/10.1038/s41467-025-57541-y
Data sources
Bibliographic data: Semantic Scholar, OpenAlex, Crossref.
Contains information from the Semantic Scholar Academic Graph Datasets, made available under the ODC Attribution License (ODC-BY 1.0).
Semantic Scholar’s data is described in: Kinney, R., et al. (2023). The Semantic Scholar Open Data Platform. arXiv:2301.10140.
