

The DOI matches its Crossref record; 62 of the 62 references it cites were found in a registry or an index.
The identification of XPR1 as a voltage- and phosphate-activated phosphate-permeable ion channel
Open accessPublished version of a preprint
Abstract
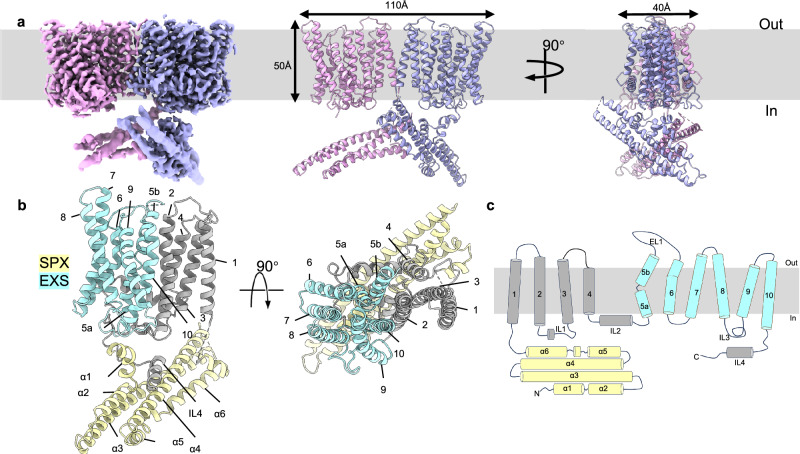
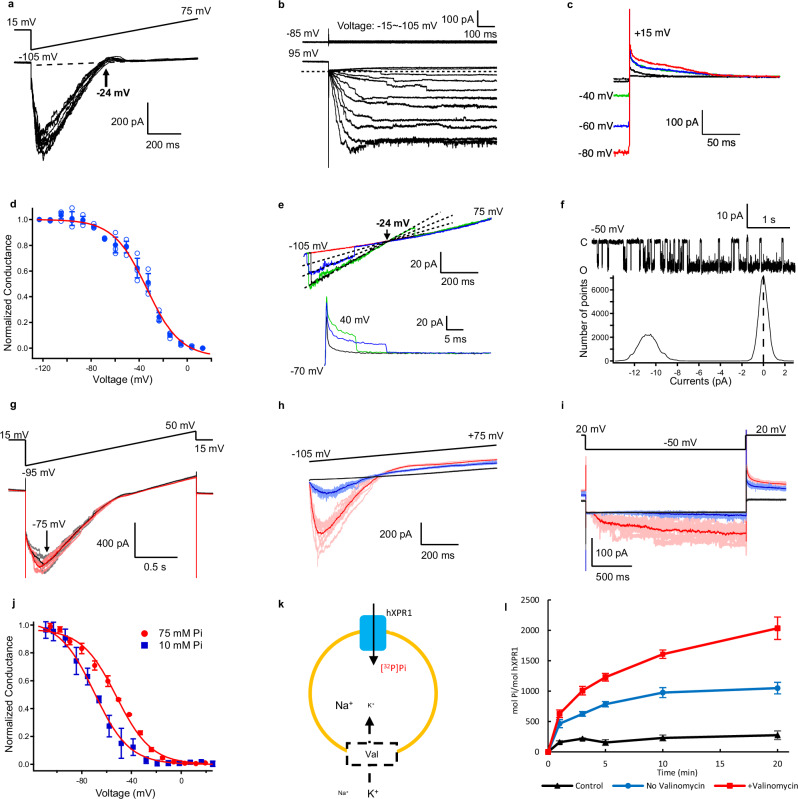
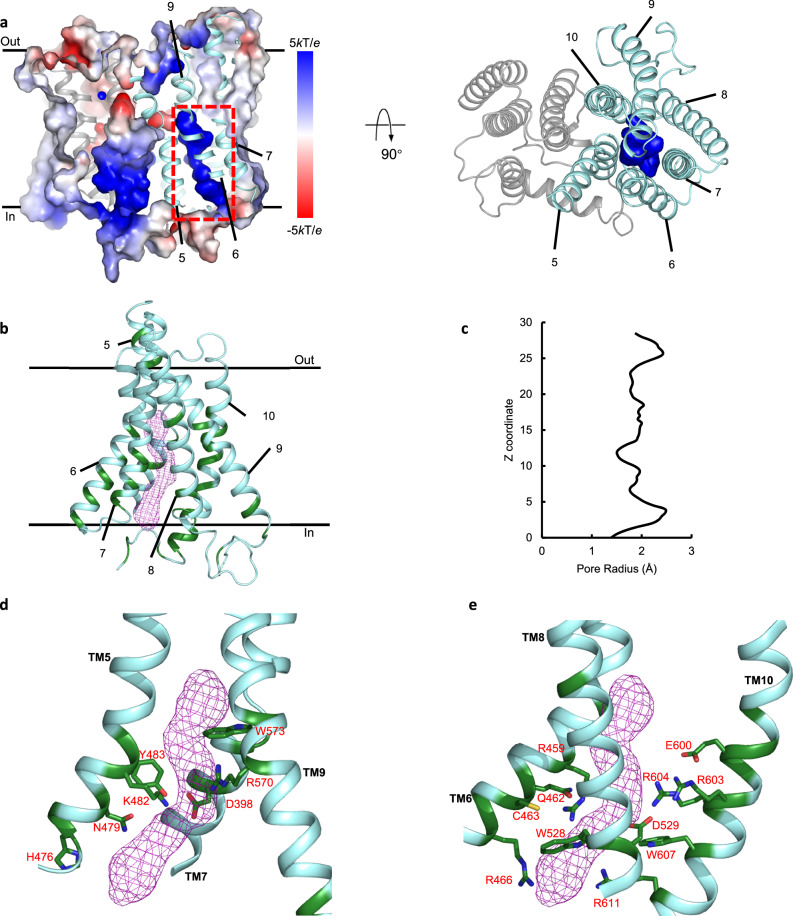
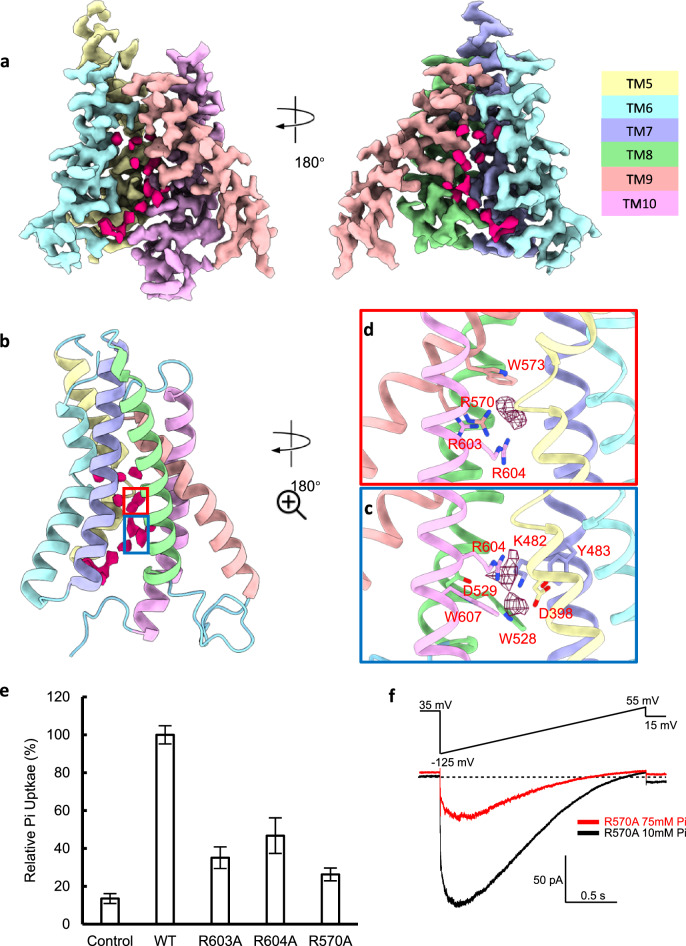
Maintaining a balance of inorganic phosphate (Pi) is vital for cellular functionality due to Pi's essential role in numerous biological processes. Proper phosphate levels are managed through Pi import and export, facilitated by specific Pi transport proteins. Although the mechanisms of Pi import have been extensively studied, the processes governing Pi export remain less understood. Xenotropic and Polytropic retrovirus Receptor 1 (XPR1) has been identified as the only known Pi export protein in mammals, playing a key role in facilitating Pi efflux from cells. Malfunctions in XPR1 are associated with human diseases, such as primary familial brain calcification and certain cancers, highlighting its critical role in maintaining Pi homeostasis. In this study, we introduce the cryogenic electron microscopy structure of human XPR1 (hXPR1), unveiling a structural arrangement distinct from that of any known ion transporter, with a topology not identified in previous computational predictions. Our structural results suggest that hXPR1 may operate as an ion channel, a hypothesis supported by patch clamp recordings revealing hXPR1's voltage- and Pi-dependent activity and large unitary conductance. Using proteoliposomal uptake assays, we demonstrate that purified and reconstituted hXPR1 catalyzes transport of Pi. Further analysis, including the structure of hXPR1 in presence of Pi, and functional effects of mutating a putative Pi binding site, leads us to propose a plausible ion permeation pathway. Together, our results provide novel perspectives on the Pi transport mechanism of XPR1 and its homologues.
Overview
The claims and statistics of this paper haven’t been checked yet.
Run the check — free, no account needed. It reads the open-access text and checks the sources it cites.
Integrity signals
Registry
Cites
Statistics
Figures
Verification
Claims the paper makes
The claims and statistics of this paper haven’t been checked yet.
Run the check — free, no account needed. It reads the open-access text and checks the sources it cites.
Self-check
Percentages, sums and reported differences re-computed from the paper’s own numbers.
The self-check needs the paper’s full text.
Citations
Cites
Highly accurate protein structure prediction with AlphaFold
Jumper, J., Evans, R., Pritzel, A., Green, T., Figurnov, M., Ronneberger, O., Tunyasuvunakool, K., Bates, R., Žídek, A., Potapenko, A., et al. (2021) · Nature · doi:10.1038/s41586-021-03819-2 · Cited by 43,764
Features and development of Coot
Emsley, P., Lohkamp, B., Scott, W. G., & Cowtan, K. (2010) · Acta Crystallographica Section D Biological Crystallography · doi:10.1107/s0907444910007493 · Cited by 29,915
cryoSPARC: algorithms for rapid unsupervised cryo-EM structure determination
Punjani, A., Rubinstein, J. L., Fleet, D. J., & Brubaker, M. A. (2017) · Nature Methods · doi:10.1038/nmeth.4169 · Cited by 11,626
MotionCor2: anisotropic correction of beam-induced motion for improved cryo-electron microscopy
Zheng, S. Q., Palovcak, E. J., Armache, J., Verba, K. A., Cheng, Y., & Agard, D. A. (2017) · Nature Methods · doi:10.1038/nmeth.4193 · Cited by 7,559
RELION: Implementation of a Bayesian approach to cryo-EM structure determination
Scheres, S. H. W. (2012) · Journal of Structural Biology · doi:10.1016/j.jsb.2012.09.006 · Cited by 5,446
CTFFIND4: Fast and accurate defocus estimation from electron micrographs
Rohou, A., & Grigorieff, N. (2015) · Journal of Structural Biology · doi:10.1016/j.jsb.2015.08.008 · Cited by 4,913
Real-space refinement in PHENIX for cryo-EM and crystallography
Afonine, P. V., Poon, B. K., Read, R. J., Sobolev, O. V., Terwilliger, T. C., Urzhumtsev, A., & Adams, P. D. (2018) · Acta Crystallographica Section D Structural Biology · doi:10.1107/s2059798318006551 · Cited by 3,281
Improvements to the APBS biomolecular solvation software suite
Jurrus, E. R., Engel, D. W., Star, K. T., Monson, K., Brandi, J., Felberg, L. E., Brookes, D. H., Wilson, L., Chen, J., Liles, K., et al. (2017) · Protein Science · doi:10.1002/pro.3280 · Cited by 2,519
Quantifying the local resolution of cryo-EM density maps
Kucukelbir, A., Sigworth, F. J., & Tagare, H. D. (2013) · Nature Methods · doi:10.1038/nmeth.2727 · Cited by 1,802
Non-uniform refinement: adaptive regularization improves single-particle cryo-EM reconstruction
Punjani, A., Zhang, H., & Fleet, D. J. (2020) · Nature Methods · doi:10.1038/s41592-020-00990-8 · Cited by 1,627
Cited by
Metadata
- Authors
- Wu, H., Sun, L., Huo, T., Wensel, T. G., Horrigan, F. T., & Wang, Z.
- Affiliations
- Baylor College of Medicine (US)
- The University of Texas MD Anderson Cancer Center (US)
- Corresponding author
- Horrigan, Frank T.
- Wang, Zhao
- Venue
- Nature Communications
- Published
- 2025-05-15
- Volume
- 16
- Issue
- 1
- Pages
- 4519-4519
- ISSN
- 2041-1723 (ISSN-L)
- PMC
- PMC12081713
- OpenAlex
- W4410401585
- Cited by
- 8
- References
- 62
- Citations by year
- 2026: 4 · 2025: 2
- FWCI
- 1.80
- Type
- journal article
- Language
- en
- Open access
- gold
- doi.org
- Licence
- cc-by-nc-nd
- creativecommons.org/licenses/by-nc-nd/4.0 (tdm)
- creativecommons.org/licenses/by-nc-nd/4.0 (vor)
- Locations
- Nature Communications (publishedVersion, cc-by-nc-nd)
- Research Square (acceptedVersion, cc-by)
- PubMed Central (publishedVersion, cc-by-nc-nd)
- PubMed (publishedVersion)
- PubMed Central (submittedVersion, cc-by)
- Digital Commons-TMC (Texas Medical Center) (submittedVersion)
- RePEc: Research Papers in Economics (submittedVersion)
- DOAJ (DOAJ: Directory of Open Access Journals) (submittedVersion, cc-by-sa)
- Funders
- U.S. Department of Health & Human Services | NIH | National Heart, Lung, and Blood Institute (R01HL162842)
- Topics
- Life Sciences › Biochemistry, Genetics and Molecular Biology › Molecular Biology › Ion channel regulation and function
- Life Sciences › Biochemistry, Genetics and Molecular Biology › Molecular Biology › Ion Transport and Channel Regulation
- Health Sciences › Medicine › Physiology (medical) › Erythrocyte Function and Pathophysiology
- Keywords
- XPR1, phosphate export, inorganic phosphate transport, ion channels, cryo-EM structure, voltage-gated ion channels, phosphate binding site, ion permeation pathway, single-channel conductance, membrane protein structure
About these checks
Registry, retraction, Cites and statistics results are computed, not judged, with one exception: a printed reference that no index lists is read once by a model before it counts as a citation error. Claims are extracted by a model and kept only when their quote appears verbatim in the text; each cited source is then checked, with a model’s help, for whether it says what the claim relies on. Those verdicts can be wrong — read the claim’s quote and the cited source before relying on one.
Statistics and arithmetic are recomputed, not judged.
Confidence bands are shown only for fields calibrated on our annotated test set. None is calibrated yet, so no band is shown.
What counts as a claim ›How we measure confidence ›How we check this ›
Are you an author, or do you see a problem with this page? Request a review
How to cite
Cite CoChat for the checks on this page, and the paper for its own findings.
- This page
- CoChat. (2026). Citation check: The identification of XPR1 as a voltage- and phosphate-activated phosphate-permeable ion channel. https://app.cochat.ai/papers/10.1038/s41467-025-59678-2
- The paper
- Wu, H., Sun, L., Huo, T., Wensel, T. G., Horrigan, F. T., & Wang, Z. (2025). The identification of XPR1 as a voltage- and phosphate-activated phosphate-permeable ion channel. Nature Communications. https://doi.org/10.1038/s41467-025-59678-2
Data sources
Bibliographic data: Semantic Scholar, OpenAlex, Crossref.
Contains information from the Semantic Scholar Academic Graph Datasets, made available under the ODC Attribution License (ODC-BY 1.0).
Semantic Scholar’s data is described in: Kinney, R., et al. (2023). The Semantic Scholar Open Data Platform. arXiv:2301.10140.
